Quantcast
Channel: Visual Studio Blog
Viewing all 1039 articles
Browse latest View live

Enhanced in Visual Studio 2019: Search for Objects and Properties in the Watch, Autos, and Locals Windows

$
0
0

Are you inspecting many variables at once in the Locals window? Tired of constantly scrolling through the Watch window to locate the object you are currently interested in? New to Visual Studio 2019 for most languages (with some exclusions such as Xamarin, Unity, and SQL), you can now find your variables and their properties faster using the new search feature found in the Watch, Autos, and Locals windows!

With the new search feature, you will be able to highlight and navigate to specified values contained within the name, value, and type columns of each watch window.

Find your keywords faster using search and highlighting

If you are a fan of scrolling to the items you want, highlighting will allow you to find what you want easier. As you start typing in the search bar, the highlighting of matches currently expanded on screen will occur, giving you a faster alternative to performing a large-scale search.

Navigate between your specified keywords quickly

You can execute a search query using ENTER or the right and left arrow icons (“find next” (F3) and “find previous” (Shift+F3), respectively) shown below. If you are not a fan of scrolling to the items you want, clicking the arrows are also used to navigate through each found match. We based the search navigation on a depth first search model, meaning that matches are found by diving as far into the selected variable as specified before looking for matches within the next variable. You don’t have to sit through the full search if you don’t want to because search can also be cleared and canceled at any time, whether the search is ongoing or not.

Search for items deeply nested in your code

Unable to find what you’re looking for on your initial search? We’ve provided a “Search Depth” drop down to find matches nested X number of levels deep into your objects, where levels are defined similarly to levels in a tree data structure context. This option gives you the power to choose how thorough you want to search inside your objects (up to 10 levels), letting you decide how long or short the search process takes.

When you are searching for items that are already expanded and visible on your screen, these items will always be returned as matches no matter what search depth you have specified. Having to loop back to the item you want after passing it can be a pain, so setting the search depth to 1 will allow you to navigate to previous matches using the “find previous” arrow icon.

Excited to start searching in the Watch, Autos, and Locals windows? Let us know in the comments!

For any issues or suggestions, please let us know via Help > Send Feedback > Report a Problem in the IDE. If you have any additional feedback about this feature, feel free to complete this brief survey.

Leslie Richardson, Program Manager, Visual Studio Debugging & Diagnostics
@lyrichardson01

Leslie is a Program Manager on the Visual Studio Debugging and Diagnostics team, focusing primarily on improving the overall debugging experience and feature set.


Debug your live apps running in Azure Virtual Machines and Azure Kubernetes

$
0
0

We are excited to announce that, in our Visual Studio Enterprise 2019 preview, we are expanding Snapshot Debugger support beyond Azure App Services hosting ASP.NET Core and ASP.NET applications to now also include Azure Virtual Machines (VM), Azure Virtual Machine scale sets (VMSS), and Azure Kubernetes Services (AKS)!

When Visual Studio 2017 Enterprise 15.5 became generally available, we introduced the Snapshot Debugger, an innovative diagnostic tool that enables you to quickly and accurately evaluate problems in their Azure production environments without stopping the process and with minimal performance impact.

When an unanticipated issue occurs in production, it can be difficult to replicate the exact conditions in your testing environment and almost impossible to do so on your local development machine. You might consider asking your DevOps team to “turn up” production logging but this relies on you having already anticipated where issues might occur prior to deployment. You may also request that a process dump be taken, but that requires perfect timing and some luck to capture the most important details, you also must gauge how your collection strategy might negatively imy pact performance.

The Snapshot Debugger provides a familiar and powerful debugging experience, allowing developers to set Snappoints and Logpoints in code, similar to debugger breakpoints and tracepoints. When a Snappoint is hit in your production environment, a snapshot is dynamically created without stopping the process. Developers can then attach to these snapshots using Visual Studio and see what’s going on with variables, Locals, Watches and Call Stack windows, all this while the live site continues to serve your customers.

Azure Virtual Machines/Azure Virtual Machine scale sets

For most PaaS scenarios, Azure App Service is more than capable of encapsulating a complete end-to-end experience. However, for developers and organizations that require greater control over of their platform and environment, VMs remain a critical option and Snapshot Debugger supports them in the latest preview of Visual Studio.

Once your VM/VMSS has been set up to host your ASP.NET or ASP.NET Core web application you can open your project in Visual Studio 2019, and click on the “Debug->Attach to Snapshot Debugger…” menu item, where you will now be able to select VM/VMSS as shown.

The UI experience remains almost identical but now you will be required to select an Azure Storage account to collect your snapshot logs and to share the snapshot collection plan (App Services will also require Azure Storage in Preview 2).

Selecting the “Install Remote Debugger Extension” option will prompt Visual Studio to install the extensions in Azure, which is necessary to view snapshots. This process also opens a specific set of ports (30398, 31398, 31399, 32398) to facilitate communication to your local machine, these ports are not required for retrieving and viewing logpoints.

Azure Kubernetes Services (AKS)

Azure provides an incredible cross platform experience and our debugging and diagnostics tools now provide feature parity in our Kubernetes service offerings.

Before attempting to use any of the Snapshot Debugger features in AKS it is vital that your Docker images include ASP.NET Core 2.2+ installed in a global location, as well as the correctly configured Snapshot Debugger and the requisite environment variables.

To help you enable support for Snapshot Debugger in AKS we have provided a repo containing a set of Dockerfiles that demonstrate the setup on Docker images. We support three variants of Linux (Debian, Alpine and Ubuntu) and they are organized according to the ASP.NET Core version, the OS platform, and the platform architecture.

For example, the ASP.NET Core 2.2 Debian 9 (Stretch) x64 Dockerfile is located at /2.2/stretch-slim/amd64/Dockerfile. This Dockerfile produces an image with Debian 9 x64 as the base with ASP.NET Core 2.2 Runtime, it includes the latest supported Snapshot Debugger backend package and sets the environment variables to load the debugger into your .NET Core application.

Try the preview

The latest Snapshot Debugger experiences are now in preview, download and try it out here.

This preview supports the following scenarios:

  • Azure App Services on the Windows OS running ASP.NET Core (2.0+) or ASP.NET (4.6.1+).
  • Virtual Machines on the Windows OS running ASP.NET Core (2.0+) or ASP.NET (4.6.1+).
  • Azure Kubernetes Services (Linux Docker Containers) running ASP.NET Core (2.2+).

If you have any issues using Snapshot Debugger, please review this guide on Troubleshooting and known issues for snapshot debugging in Visual Studio.

We would love to hear your feedback. To report issues, use the Report a Problem tool in Visual Studio. You’ll be able to track your issues on the Visual Studio Developer Community site where you can also ask questions and find answers.

Mark Downie, Program Manager, Visual Studio Diagnostics
@poppastring

Mark is a program manager on the Visual Studio Diagnostics team, working on Snapshot Debugger.

Become a Visual Studio for Mac super user with this Tips and Tricks Video Series

$
0
0

If you are a web, mobile or games developer and would like to know how to become more productive and efficient using Visual Studio for Mac then we’ve got you covered. Visual Studio for Mac is a powerful IDE for C# developers that work with Xamarin, .NET Core and Unity workloads. The new video series, hosted on the Visual Studio Toolbox, contains short, roughly 5-minute, videos that cover tips and tricks for specific tasks and may even unveil features you didn’t even know existed! The first few videos will be introducing Visual Studio for Mac and what you can do with it.

You don’t want to miss a single video in the series so make sure you subscribe now. We will be recording and releasing a new video each week over the next few weeks, and the links will be updated on the date specified below. The videos currently feature Program Managers, Cody Beyer (@cl_beyer) and Sayed Ibrahim Hashimi (@SayedIHashimi). You can also provide feedback using the Developer Community portal

Here are the links to all the videos:

Overview In this video, Sayed will give you a very brief overview of some of the types of applications you can develop with Visual Studio for Mac. Since this is a very short video, it just touches on some of the more common types of apps that can be developed. This is the first video in the Visual Studio for Mac Tips and Tricks series. The first few videos will be setting a foundation with some basic information on Visual Studio for Mac. Following that, each video will show one, or a few, tips and tricks for specific tasks.
Acquisition Visual Studio for Mac is our full-featured IDE for macOS, providing all the tools you need to create ASP.NET Core application, Unity games, Xamarin mobile apps, Azure Functions and so much more. Join Cody as he shows how to download and install Visual Studio for Mac.
Build Your First App In this video, Sayed will show you how you can create your first ASP.NET Core web application with Visual Studio for Mac. The application that will be developed is a web site that displays the emojis available on GitHub. The info for the emojis are retrieved using the GitHub API.
Launch Multiple Projects While developing applications, it’s common to need to debug, or simply launch, more than one project. In this video, Sayed will show you how you can do just that. You can launch more than one project on run, or debug, by creating a new Solution Run Configuration.
Work with Multiple Solutions 
(available 1/29/2019)
In this video, Sayed will show you how you can work with multiple solutions in Visual Studio for Mac. Specifically, he will demonstrate two ways to work with multiple solutions:
  1. How to open more than one solution in the same instance of the IDE
  2. How to open more than one instance of Visual Studio for Mac
Manage Projects with Git 
(available 1/29/2019)
Want to know how to “git” started with using Visual Studio for Mac? Join Cody as he introduces Git support in Visual Studio for Mac, from check-out to push.
Publish to Azure
(available 2/5/2019)
In this video, Cody will demonstrate how to log in and publish a web project to Azure. Join him and learn how to get the most out of Visual Studio for Mac by combining it with the power of Azure.
Customize the Look and Feel 
(available 2/5/2019)
No IDE is truly ready until it matches your unique style and preferences. In this video, Cody will walk you through the steps to enable dark mode, install custom editor color themes and change the interface language.
Refactoring Code
(available 2/12/2019)
Visual Studio for Mac offers the refactoring and suggestion engine that you know and love on Windows. Learn how to get the most out of the power of Roslyn in all of your projects using Visual Studio for Mac.
Using NuGet 
(available 2/12/2019)
Visual Studio for Mac supports NuGet for all of your dependency management needs. In this video, Cody will demonstrate how to add a NuGet package to your project, and how to connect Visual Studio for Mac to custom NuGet feeds.
Searching and Navigating 
(available 2/19/2019)
Learn how to be a keyboard wizard and navigate within your project with ease using Visual Studio for Mac. In this video, Cody shares his favorite tips and tricks for navigating around your code.
Using Navigate To
(available 2/19/2019)
In this video, Sayed will show you how you can improve your productivity when developing apps with Visual Studio for Mac using the Navigate To feature that allows you quickly find files, code, and more. Navigate To is a feature that is similar to the Visual Studio Quick Launch feature.


Tell us what you think!

We invite you to leave us a comment below and let us know what you think of the series. If these are helpful and valuable to our users, then we will record more videos and keep the series going. If there is another format that you think would be better, we would love to hear your thoughts.

Here are some useful links:

Cody Beyer, Program Manager
@cl_beyerCody Beyer is a Program Manager on the Visual Studio for Mac team at Microsoft. His primary areas of focus cover overall performance and reliability of the IDE. He is also interested in computer ethics and privacy and aims to create software that empowers and respects everyone.
Sayed Hashimi, Senior Program Manager
@sayedihashimiSayed Ibrahim Hashimi has a computer engineering degree from the University of Florida. He works at Microsoft as a Senior Program Manager creating better .NET Core, and ASP.NET Core, ­development tools in Visual Studio for Mac. Before joining the Visual Studio for Mac team, he worked on ASP.NET features in Visual Studio. Prior to joining Microsoft, he was a Microsoft Visual C# MVP. Sayed has written four book on MSBuild, http://msbuildbook.com and he is a co-founder of  the OmniSharp project.

A better multi-monitor experience with Visual Studio 2019

$
0
0

Visual Studio 2019 now supports per-monitor DPI awareness (PMA) across the IDE. PMA support means the IDE and more importantly, the code you work on appears crisp in any monitor display scale factor and DPI configuration, including across multiple monitors.

Visual Studio 2019 (left) with system scaling vs Visual Studio 2019 (right) with the PMA option enabled.

If you have used Visual Studio across monitors with different scale factors or remoted into a machine with a different configuration than the host device, you might have noticed Visual Studio’s fonts and icons can become blurry and in some cases, even render content incorrectly. That’s because versions prior to Visual Studio 2019 were set to render as a system scaled application, rather than a per-monitor DPI aware application (PMA).

System scaled applications render accurately on the primary display as well as others in the same configuration but have visual regressions such as blurry fonts and images when rendering on displays with different configurations. When working for extended periods of time, these visual regressions can be a distraction or even a physical strain.

Visual Studio 2019 Preview 1 included the core platform support for per-monitor DPI awareness and Preview 2 includes additional fixes for usability issues around scaling, positioning and bounding (e.g. content renders within the bounds of tool windows). Preview 2 also adds several more popular tool windows that now correctly handle per-monitor DPI awareness.

How to enable PMA for Visual Studio 2019

The easiest way to try the new PMA functionality is on Visual Studio 2019 Preview 2. You’ll need to have the Windows 10 April 2018 Update or a newer build installed along with the latest version of .NET Framework 4.8. If you’re still running Preview 1 then you also need to enable “Optimize rendering for screens with different pixel densities” in the Preview Features node of the Tools -> Options dialog.

There are many features where you’ll start to see Visual Studio render clear fonts and crisp images. Here’s a few of the most used UI in Visual Studio where you should notice a difference.

  • Core Shell
  • Menus and context menus
  • Most code editors
  • Solution Explorer
  • Team Explorer
  • Toolbox
  • Breakpoints
  • Watch
  • Locals
  • Autos
  • Call Stack

Visual Studio 2019 Preview 2 also fixes some of the usability issues affecting UI positioning, scaling and content bounding that were discovered in Preview 1.

Our goal is to have per-monitor awareness working across the most used features by the time we ship Visual Studio 2019. In future updates, we’ll continue enabling PMA across more areas and look forward to your feedback.

Tell us what you think!

We thank you for your ongoing feedback, and encourage you to install the latest Visual Studio 2019 preview, enable the PMA functionality, and tell us about your experiences through the Developer Community portal. Please upvote PMA related asks or create new ones whenever you feel a specific component (tool window, dialog, etc.) or issue has not being reported.

Reporting your experience alongside your display configurations, PMA feature state (on/off) and for bonus points, any screenshot or video showing the affected areas will help us resolve issues faster, and account for as many use-cases as possible.

Ruben Rios, Program Manager, Visual Studio
@rub8n

Ruben is a Program Manager on the Visual Studio IDE platform team. During his time at Microsoft, he’s helped build tools and services for web & mobile devs in both Visual Studio and the Microsoft Edge F12 dev tools. Before joining Microsoft, he was a professional web developer and has always been passionate about UX.

Microsoft Q# Coding Contest – Winter 2019

$
0
0

Are you new to quantum computing and want to improve your skills? Have you done quantum programming before and looking for a new challenge? Microsoft’s Quantum team is excited to invite you to the second Microsoft Q# Coding Contest, organized in collaboration with Codeforces.com.

The contest will be held March 1 through March 4, 2019. It will offer the participants a selection of quantum programming problems of varying difficulty. In each problem, you’ll write Q# code to implement the described transformation on the qubits or to perform a more challenging task. The top 50 participants will win a Microsoft Quantum T-shirt.

This contest is the second one in the series started by the contest held in July 2018. The first contest offered problems on introductory topics in quantum computing: superposition, measurement, quantum oracles and simple algorithms. The second contest will take some of these topics to the next level and introduce some new ones.

For those eager to get a head start in the competition, the warmup round will be held February 22-25, 2019. It will feature a set of simpler problems and focus on getting the participants familiar with the contest environment, the submission system and the problem format. The warmup round is a great introduction, both for those new to Q# or those looking to refresh their skills.

Another great way to prepare for the contest is to work your way through the Quantum Katas. They offer problems on a variety of topics in quantum programming, many of them similar to those used in the first contest. Most importantly, the katas allow you to test and debug your solutions locally, giving you immediate feedback on your code.

Q# can be used with Visual Studio, Visual Studio Code or command line on Windows, macOS or Linux, providing an easy way to start with quantum programming. Any of these platforms can be used in the contest.

We hope to see you at the second global Microsoft Q# Coding Contest!

Mariia Mykhailova, Senior Software Engineer, Quantum
@tcnickolas
Mariia Mykhailova is a software engineer at the Quantum Architectures and Computation group at Microsoft. She focuses on developer outreach and education work for the Microsoft Quantum Development Kit. In her spare time she writes problems for programming competitions and creates puzzles.

Break When Value Changes: Data Breakpoints for .NET Core in Visual Studio 2019

$
0
0

“Why is this value changing unexpectedly and where or when is this occurring?!

This is a question many of us dread asking ourselves, knowing that we’ll have to do some tedious trial-and-error debugging  to locate the source of this issue.  For C++ developers, the exclusive solution to this problem has been the data breakpoint, a debugging tool allowing you to break when a specific object’s property changes.  Fortunately, data breakpoints are no longer a C++ exclusive because they are now available for .NET Core (3.0 or higher) in Visual Studio 2019 Preview 2!

Data breakpoints for managed code were a long-requested ask for many of you. They are a great alternative to simply placing a breakpoint on a property’s setter because a data breakpoint focuses on a specific object’s property even when it’s out of scope, whereas the former option may result in constant, irrelevant breaks if you have hundreds of objects calling that function.

How do I set a data breakpoint?

Setting a data breakpoint is as easy as right-clicking on the property you’re interested in watching inside the watch, autos, or locals window and selecting “Break when value changes” in the context menu.  All data breakpoints are displayed in the Breakpoints window. They are also represented by the standard, red breakpoint circle next to the specified property.

Setting a data breakpoint in the Locals window and viewing the breakpoint in the Breakpoints window

When can I use data breakpoints?

Now that you know how to set a data breakpoint, now what?  Here are some ways to take advantage of data breakpoints when debugging your .NET Core applications.

Let’s say that you want to figure out who is modifying a property in an object and for most of the time, this property change does not happen in the same file. By setting a data breakpoint on the property of interest and continuing, the data breakpoint will stop at the line after the property has been modified.

Break when _data value changes

This also works for objects. The data breakpoint will stop when the property referencing the object changes value, not when the contents of the object change.

Break when the property referencing an object changes

As illustrated in the GIF above, calling the toEdit._artist.ChangeName() function did not cause a breakpoint to hit since it was modifying a property (Name) inside the Song’s Artist property.  In contrast, the data breakpoint is hit when the _artist property is assigned a reference to a new object.

Data breakpoints are also useful when you want to know when something is added or removed from a collection. Setting a data breakpoint on the ‘Count’ field of classes from System.Collections.Generic makes it easy to detect when the collection has changed.

Break when an object is added or removed from a list

Are there opportunities for improving managed data breakpoints?

Since Visual Studio 2019 is still in preview, we highly encourage you to experiment, play around with, and provide feedback for this iteration of data breakpoints.  Here are some known scenarios where data breakpoints currently cannot be set that we are working on erasing and improving in future Visual Studio updates:

  • Properties that are not expandable in the tooltip, Locals, Autos, or Watch window
  • Static variables
  • Classes with the DebuggerTypeProxy Attribute
  • Fields inside of structs

Managed data breakpoints also exclude properties that call native code and properties that depend on too many fields.

Ready to try data breakpoints in your .NET Core applications?  Let us know in the comments!

For any issues or suggestions about this feature, please let us know via Help > Send Feedback > Report a Problem in the IDE or in the Developer Community.

Leslie Richardson, Program Manager, Visual Studio Debugging & Diagnostics
@lyrichardson01

Leslie is a Program Manager on the Visual Studio Debugging and Diagnostics team, focusing primarily on improving the overall debugging experience and feature set.

New features for extension authors in Visual Studio 2019 version 16.1

$
0
0

Earlier this week, we released Visual Studio 2019 version 16.1 Preview 1 (see release notes). It’s the first preview of the first update to Visual Studio 2019. If you’re not already set up to get preview releases, then please do that now. The preview channel installs side-by-side with the release channel and they don’t interfere with each other. I highly recommend all extension authors install the preview.

Got the 16.1 preview installed now then? That’s great. Here are some features in it you might find interesting.

Shared Project support

There are several reasons why extension authors sometimes must split an extension into multiple projects to support the various versions of Visual Studio. If you’re using an API that did not exist for an earlier version of Visual Studio or if there are breaking changes between the versions you want to support, now there’s a simple easier to split your extension.

With Visual Studio 2019 version 16.1 Preview 1, we’ve added support for referencing Shared Projects from VSIX projects in the same solution.

You can place common code in a separate Shared Project that compiles directly into the VSIX projects at build time. The only code that then exists in the VSIX projects themselves, is code that is specific to the Visual Studio version it supports. The result is two separate VSIXs that target their own specific Visual Studio version range and share most of the code from the Shared Project. Checkout the code for the Extension Manager extension that does exactly this.

No more need for .resx file

When adding commands, menus etc. using a VSCT file, you must specify a .resx file marked with the MergeWithCTO MSBuild property. The templates in Visual Studio takes care of adding that file and it also adds a .ico file referenced by the .resx file. However, the need for a .resx is an implementation detail and most extensions don’t need to use it.

In an effort to make VSIX project simpler, the requirement for the .resx/.ico files have been removed when using the latest Microsoft.VSSDK.BuildTools NuGet package version 16.0 or newer.

Behind the scenes, the NuGet package provides an empty .resx to compile with the MergeWithCTO property unless you registered your own in the project.

Per-monitor awareness

Additional per-monitor awareness support is being enabled in 16.1 with .NET Framework 4.8 installed. Windows Forms UI now better handle DPI scaling across monitors. However, this may cause UI issues in your extension after installing .NET Framework 4.8.

When using Windows Forms in an extension, you can match the Visual Studio 2017 scaling behaviors by wrapping your form or control creation in a DpiAwareness.EnterDpiScope call.

using (DpiAwareness.EnterDpiScope(DpiAwarenessContext.SystemAware))
using (var form = new MyForm())
{
    form.ShowDialog();
}

All you need is to add a reference to the Microsoft.VisualStudio.DpiAwareness NuGet package. Use this package in extensions targeting earlier versions of Visual Studio too but be aware that it will only take effect when running in 16.1 and newer. So, it is safe to use in extensions spanning multiple versions of Visual Studio.

To make it easier to simulate multiple monitors running with different DPI scaling, an engineer from the Visual Studio IDE team built a handy little tool and put it on GitHub. The team used this tool while they were adding support for per-monitor awareness, so you may find it helpful too.

Read more about how to deal with per-monitor awareness for extenders.

Synchronous auto-load disabled

18 months ago, we sent an email to extension partners announcing the deprecation of synchronous auto-loading of extension packages. A year ago, we followed up with a blog post with more details that outlined that synchronously auto-loaded package would be unsupported in a future version of Visual Studio. That version is 16.1.

There are great samples on how to migrate to AsyncPackage with background load enabled, and most extensions today have already made the transition. If you haven’t already, now is a good time to do that before 16.1 goes out of preview.

New SDK meta package

The meta package Microsoft.VisualStudio.SDK is a single NuGet package that references all the various Visual Studio packages that make up the SDK. The cool thing about the meta package is that you have access to all the interfaces and services. In addition, you also avoid issues with mismatched package versions.

When we released Visual Studio 2019 (16.0), the VSIX Project template referenced the 15.9 version of the SDK meta package. That was because the 16.0 version was still under development. All the individual packages had to be published to NuGet before we could take dependency on them from the meta package.

The good news is that now we finally have the 16.0 version ready. You should use it if the lowest version of Visual Studio if your extension supports 16.0. and you can read more about extension versioning here.

The post New features for extension authors in Visual Studio 2019 version 16.1 appeared first on The Visual Studio Blog.

Build Visual Studio templates with tags, for efficient user search and grouping

$
0
0

Visual Studio’s project templates enable you, the developer, to create multiple similar projects more efficiently by defining a common set of starter files. The project templates can be fully customized to meet the needs of a development team, or a group, and can be published to the Visual Studio Marketplace for others to download and use too! Once published, developers can install and access the template through Visual Studio’s New Project Dialog.

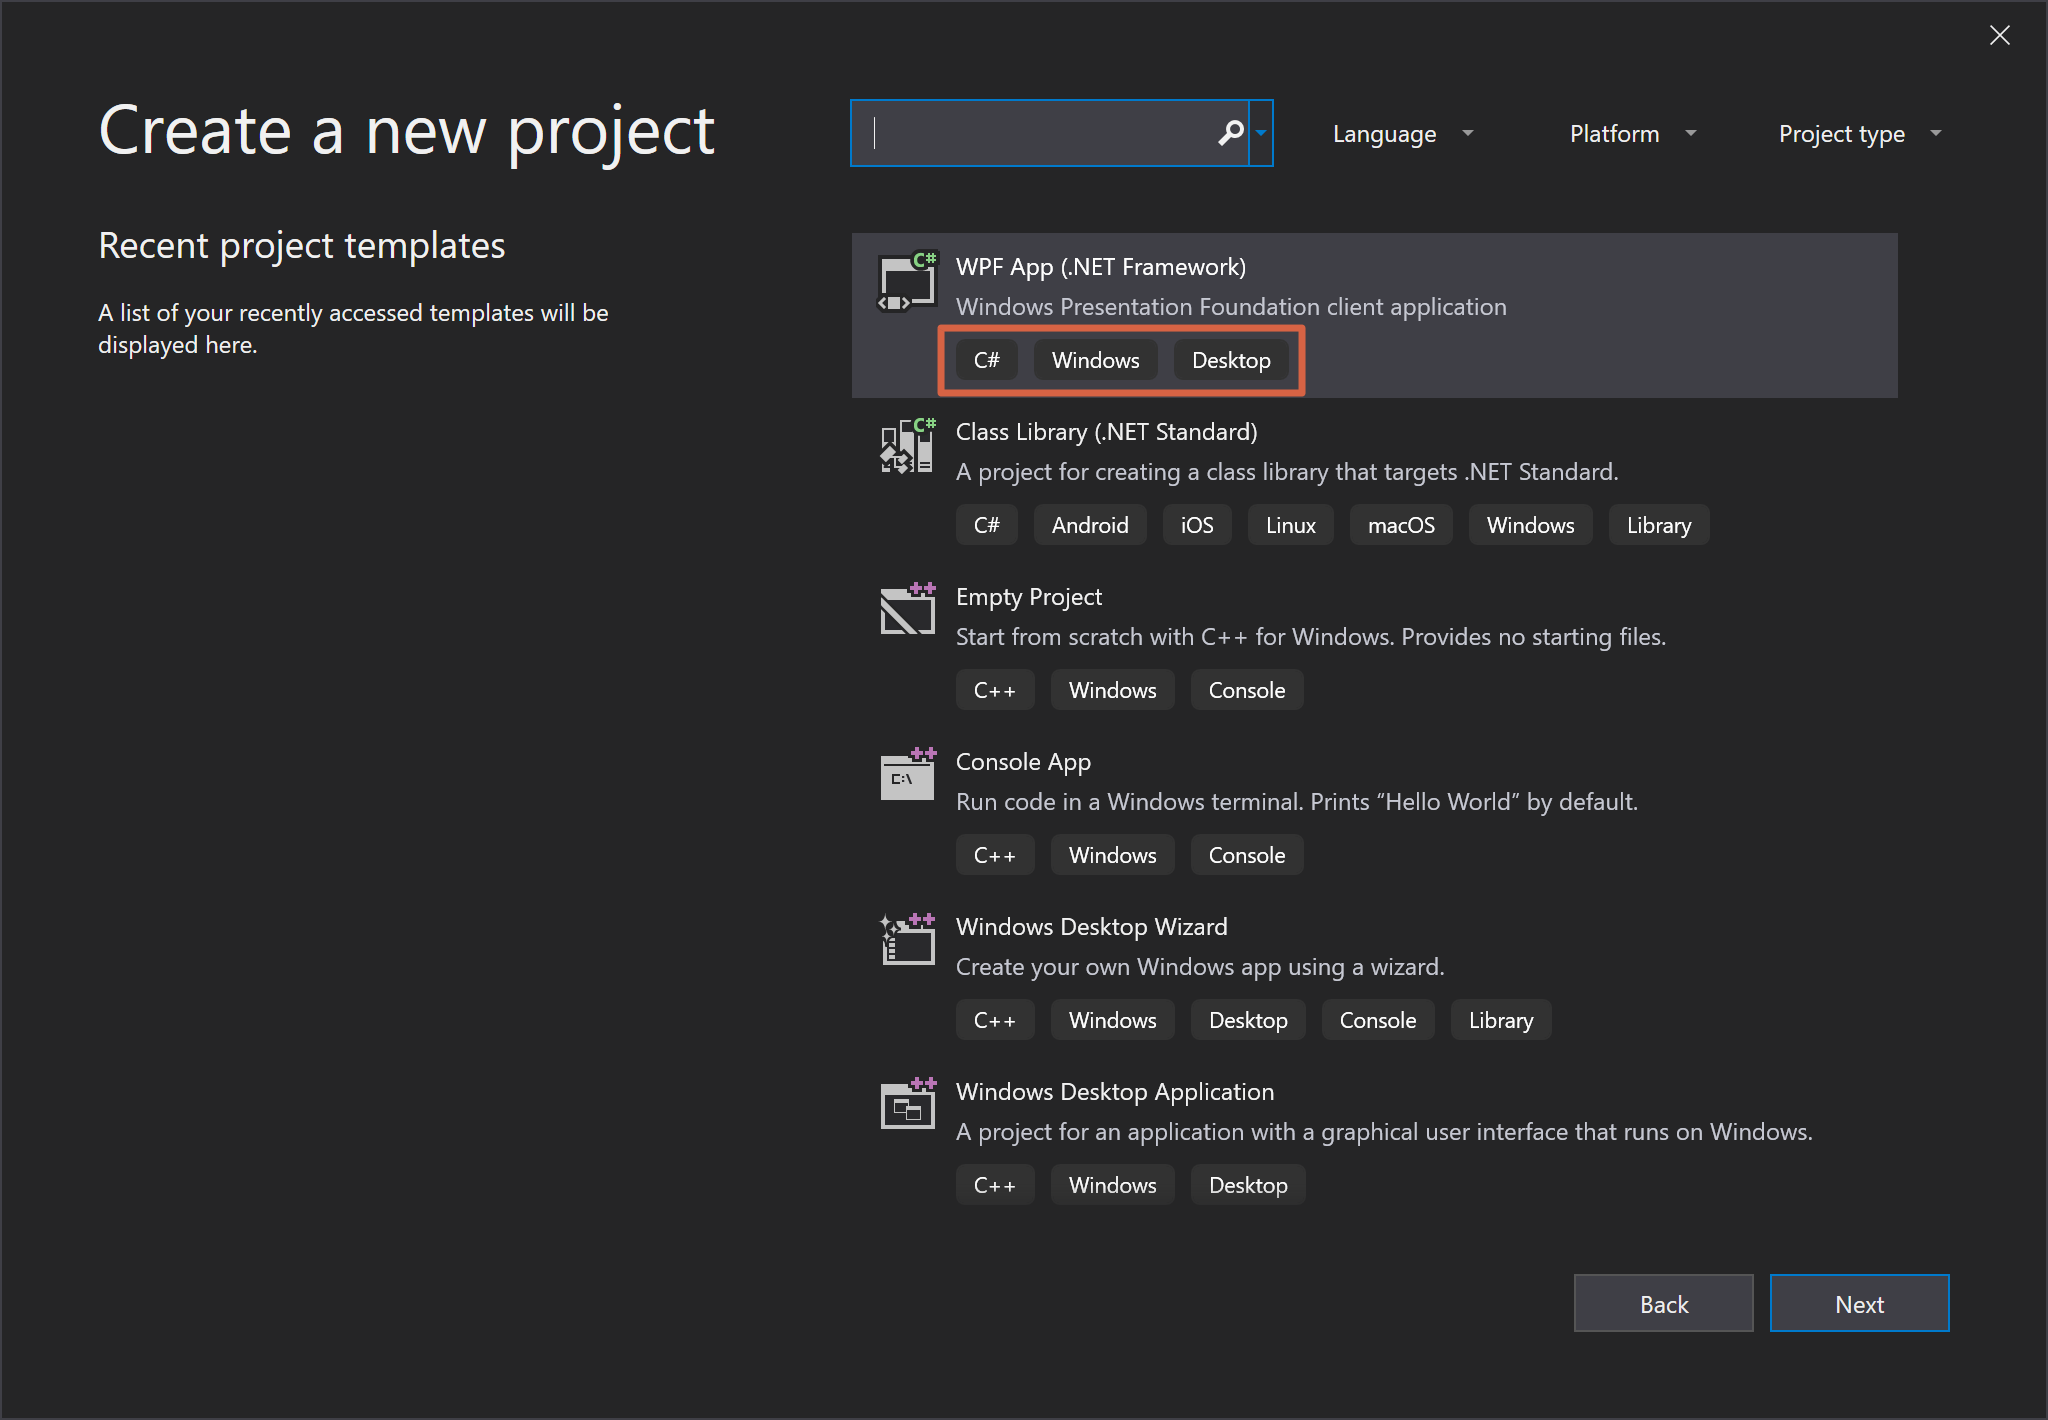
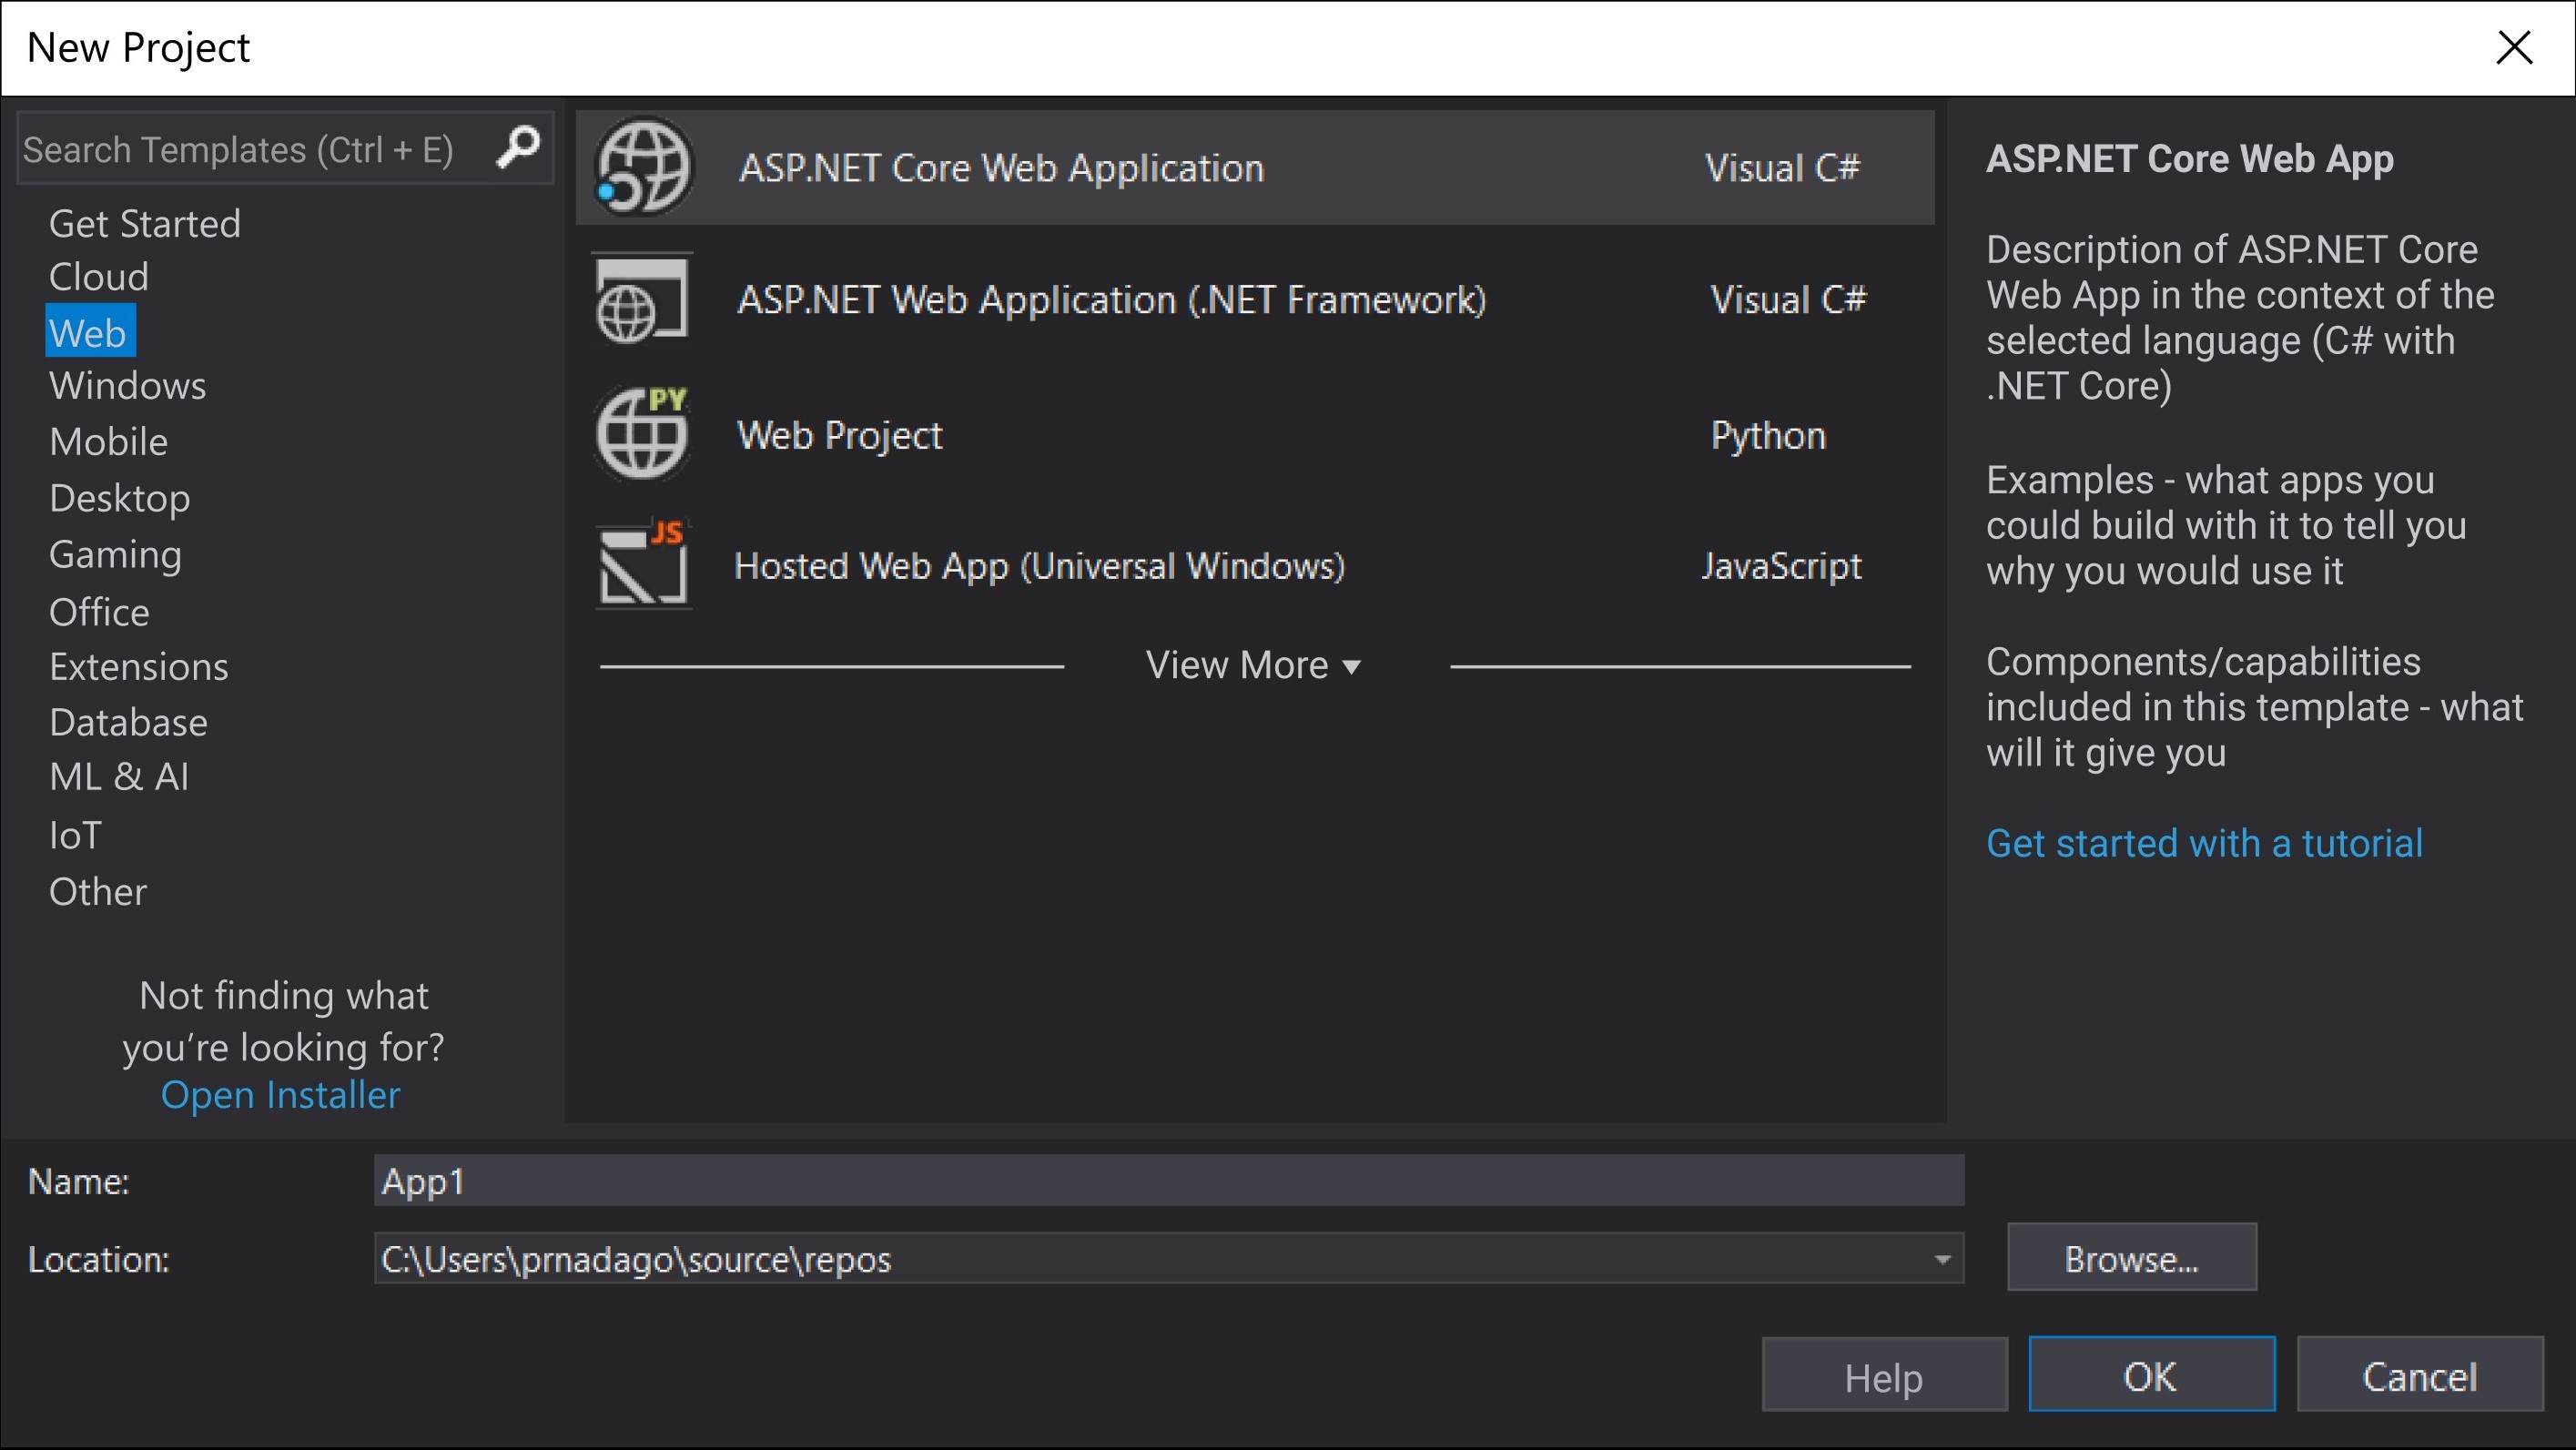
The newly designed New Project Dialog for Visual Studio 2019 was built to help developers get to their code faster. Using a search and filter focused experience, we are aiming to provide better discoverability for specific templates to start your application development. 


In this walkthrough, you will learn to 

  • Create a project template 
  • Add tagor filters to the project template 
  • Deploy the template as an extension using the VSIX project template 

Before getting started, please make sure you have installed Visual Studio 2019 with Visual Studio SDK. 


Creating a project template 

There are a few ways you can create a project template, but in this walkthrough, we will create a C# project template using the New Project Dialog. 

  1. In Visual Studio, launch the New Project Dialog File New > Project
    (or use the keyboard shortcutCTRL + SHIFT + N).
  2. Filter the list by Project type Extensions and select C# Project Template.
  3. Click Next then modify the Project name field and click Create.


Adding tags / filters to your project template 

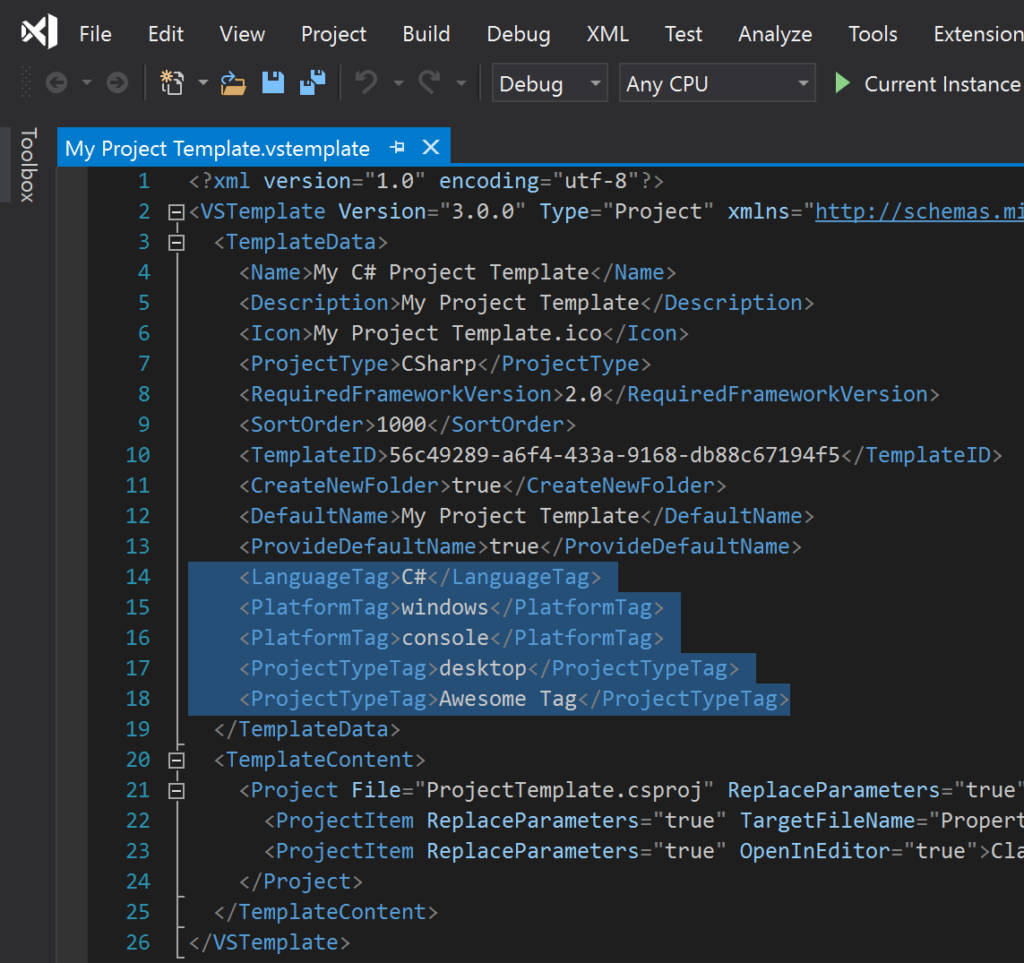
Once you’ve created a project template, you can add tags or filters to it in the template’s .vstemplate XML file. 

  1. Add Visual Studio’s built-in tags as well as any custom tags to your project template using <LanguageTag>, <PlatformTag>, <ProjectTypeTag> elements under <TemplateData> and save the file. For example, as highlighted below:
  2. Save and close the vstemplate the XML file. 


Deploying the template as an extension using the VSIX project template 

Wrap your project template in a VSIX project template to deploy your template as an extension. 

  1. Create an Empty VSIX Project in the Solution created for the C# project template above.
    1. In the Solution Explorer, right click on the Solution and select Add > New Project.
    2. Type “vsix” in the search box and select Empty VSIX Project for C# (or VSIX Project if you are using earlier versions of Visual Studio).
    3. Click Next then modify the Project name field and click Create.
  2. Set the VSIX Project as a startup project.
    In the Solution Explorer, right click on the VSIX project and select Set as StartUp Project. Your Solution Explorer should now look something like this (with your VSIX project bolded):

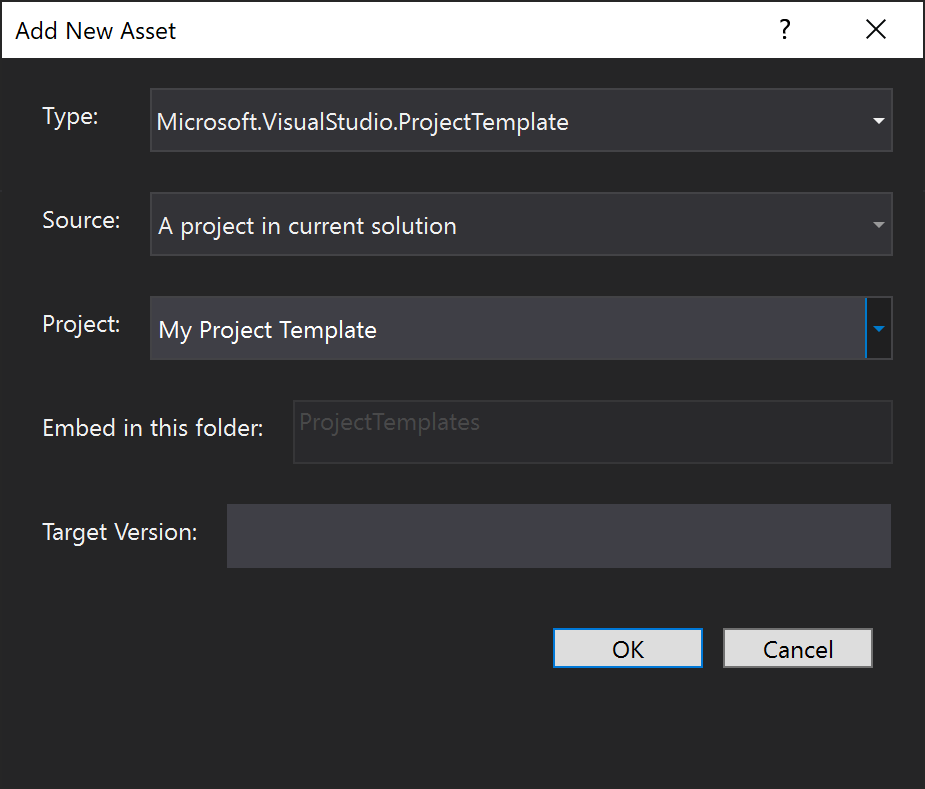
  3. Add your project template as an asset to the VSIX project.
    1. Click on the Assets tab and select the New button.
    2. Set the Type field as Microsoft.VisualStudio.ProjectTemplate.
    3. Set the Source field as A project in current solution.
    4. Set the Project field as your project template.
    5. Click OK, then save and close the source.extension.vsixmanifest file.

  4. Run your code without invoking the debugger (CTRL + F5) 

That’s it! Your new project template will appear in the New Project dialog with the tags under your template’s description and filters enabled by those tags. You can also take it a step further and easily publish your project template to the Visual Studio Marketplace (and while you’re at it, also try out the little great things about Visual Studio 2019 and please let us know what you think)! Here is an example of one in an existing extensionTextmate Grammar Template. 

Have suggestions? 

We are continuing to work on our tools and to do that, we could use your help! Please share your feedback/comments below, or through the Visual Studio Developer Community, or tweet at our team @VisualStudio. 

The post Build Visual Studio templates with tags, for efficient user search and grouping appeared first on The Visual Studio Blog.


Visual Studio 2019 version 16.1 Preview 2

$
0
0

The second preview of Visual Studio 2019 version 16.1 is now available. You can download it from VisualStudio.com, or, if you already have installed Preview, just click the notification bell inside Visual Studio to update. This latest preview contains additional performance and reliability fixes as well as enhancements for debugging, NuGet, extensibility, and C++ development. We’ve highlighted some notable features below. You can see a list of all the changes in the Preview release notes.

Improvements for C++ developers

CMake integration

In-editor helpers: We’ve added in-editor documentation for CMake commands, variables, and properties. You can now leverage IntelliSense autocompletion and quick info tooltips when editing a CMakeLists.txt file, which will save you time spent outside of the IDE referencing documentation and make the process less error-prone. See the C++ Team blog post on in-editor documentation for CMake in Visual Studio for more information.

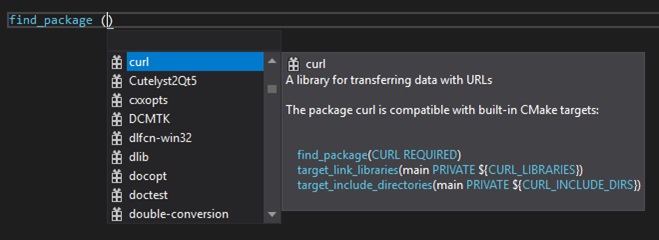
In addition, Preview 2 adds lightbulbs for missing #includes that can be installed by vcpkg, and provides package autocompletion for the CMake find_package directive.

CMake Lightbulb hints for missing #Includes

CMake Find Package Autocompletion

Clang/LLVM support: CMake integration now supports the Clang/LLVM toolchain for projects targeting Windows and/or Linux, so you can build, edit, and debug CMake projects that use Clang, MSVC, or GCC. The CMake version that ships with Visual Studio has been upgraded to 3.14 as well. This version adds built-in support for MSBuild generators targeting Visual Studio 2019 projects as well as file-based IDE integration APIs.

To learn more about these and other CMake improvements, see the C++ Team blog post Visual Studio 2019 version 16.1 Preview 2 CMake improvements.

C++ productivity improvements

C++ Template IntelliSense: The Template Bar dropdown menu is populated based on the instantiations of that template in your codebase. More details on this feature can be found in the post “C++ Template IntelliSense: Auto-populate instantiations in template bar” on the C++ Team blog.

C++ Template IntelliSense

Progress on C++20 conformance

Conformance improvements: New C++20 preview features have been added to the compiler and are available under /std:c++latest. Per P0846R0, the compiler has increased ability to find function templates via argument-dependent lookup for function call expressions with explicit template arguments. Also supported is designated initialization (P0329R4), which allows specific members to be selected in aggregate initialization, e.g. using the Type t { .member = expr } syntax.

We have also added new C++20 features to our implementation of the C++ Standard Library, including starts_with() and ends_with() for basic_string/basic_string_view, and contains() for associative containers. For more information, see the Preview 2 release notes.

Improved NuGet package debugging

Last year, we announced improved package debugging support with NuGet.org Symbol Server. Starting with Visual Studio version 16.1 Preview 2, debugging NuGet packages just became a whole lot simpler now that you can enable NuGet.org Symbol Server from the Debugging\Symbols option.

NuGet Symbol Server

Source Link Improvements

Source Link now supports Windows authentication scenarios. Ultimately, using Windows authentication will allow you to use Source Link for on-premises Azure DevOps Servers (formerly, Team Foundation Server).

Visual Studio Search

Based on user feedback, Visual Studio Search will now display the three most recently used actions on focus. This makes it even easier to find previously searched-for items.

Visual Studio Search Most Recently Used List

Solution view selector

The button for switching the Solution Explorer view will now consistently show you a dropdown menu of all possible views. Per your feedback, this solution removes the confusion of having the button default to toggling between Folder View and Solution View and not being clear on which solution it would open.

Solution View Selector

We have also improved the loading time for very large solutions, where the amount of improvement varies based on the size of the solution.

Extensibility

A number of updates to Visual Studio extensibility are included in this release, including Shared Project support and per-monitor awareness for dialogs. We’ve also eliminated the need for a .resx file and disabled synchronous auto-load. Additionally, the Visual Studio 2019 version of Microsoft.VisualStudio.SDK is now available as a NuGet package. Read all about these changes in the New features for extension authors in Visual Studio 2019 version 16.1 blog post.

Another notable extensibility update in this Preview is that project templates now support custom tags which allow them to show up in the New Project Dialog. See how to add tags in the blog post Build Visual Studio templates with tags, for efficient user search and grouping.

App Installer Templates

Over the last few releases, Visual Studio has improved the sideload packaging distribution experience for developers by introducing the App Installer file which specifies where an application is located and how it should be updated. Users who choose this method of application distribution simply share the App Installer file with their users rather than the actual app container.

The options available for use in the App Installer file are different based upon the Windows version the user is targeting. To enable maximum flexibility, Visual Studio 2019 version 16.1 allows users to define and configure the App Installer Update settings from a template Package.appinstaller.

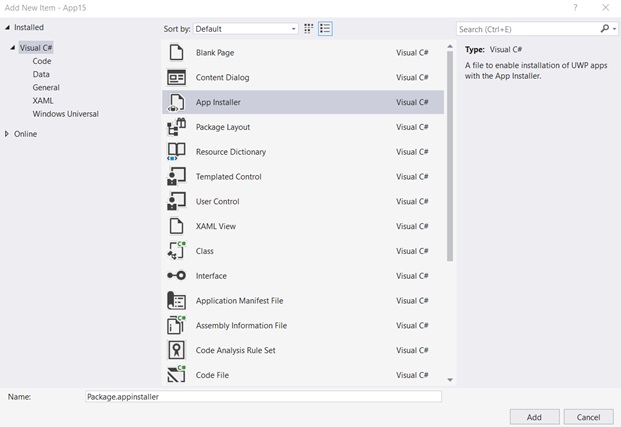
Activate this template by right-clicking the project and selecting Add > New Item > App Installer Template.

App Installer Templates

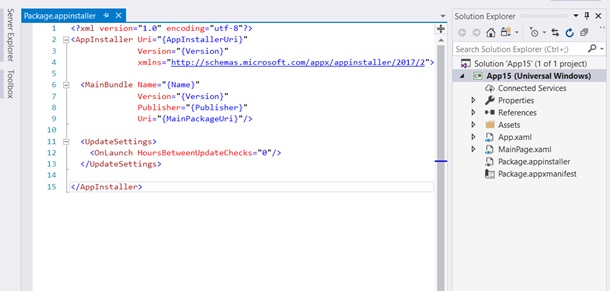
The Package.appinstaller template file is available to edit and customize the update settings you want to use.

App Installer Template Settings

Note that once the template is added to the project, the user will no longer be able to customize update settings in the packaging wizard. All customizations must thus be edited in the template.

Use the latest features; give us feedback

To try out this preview of the latest features, either download Visual Studio 2019 version 16.1 Preview 2, update your existing preview channel installation by using the notification bell inside Visual Studio, or click Update from within the Visual Studio Installer.

We continue to value your feedback. As always, let us know of any issues you run into by using the Report a Problem tool in Visual Studio. You can also head over to the Visual Studio Developer Community to track your issues, suggest a feature, ask questions, and find answers from others. We use your feedback to continue to improve Visual Studio 2019, so thank you again on behalf of our entire team.

The post Visual Studio 2019 version 16.1 Preview 2 appeared first on The Visual Studio Blog.

Redesigning the New Project Dialog

$
0
0

Last week, we released Visual Studio 2019 version 16.1 Preview 2. If you have the latest update – awesome and thank you. If not, you can download it from the link above. Or, if you already have the Preview, just click the notification bell inside Visual Studio to update. This post discusses one of the most visible interface changes we’ve made in Visual Studio 2019 – the New Project Dialog.

Motivation

In Visual Studio 2019, one of our main objectives was to help you (both new and experienced developers) get to your code faster. You can read more about this journey in the blog post that discussed the new start window. One of the most common ways to start coding in Visual Studio is to create a new project.

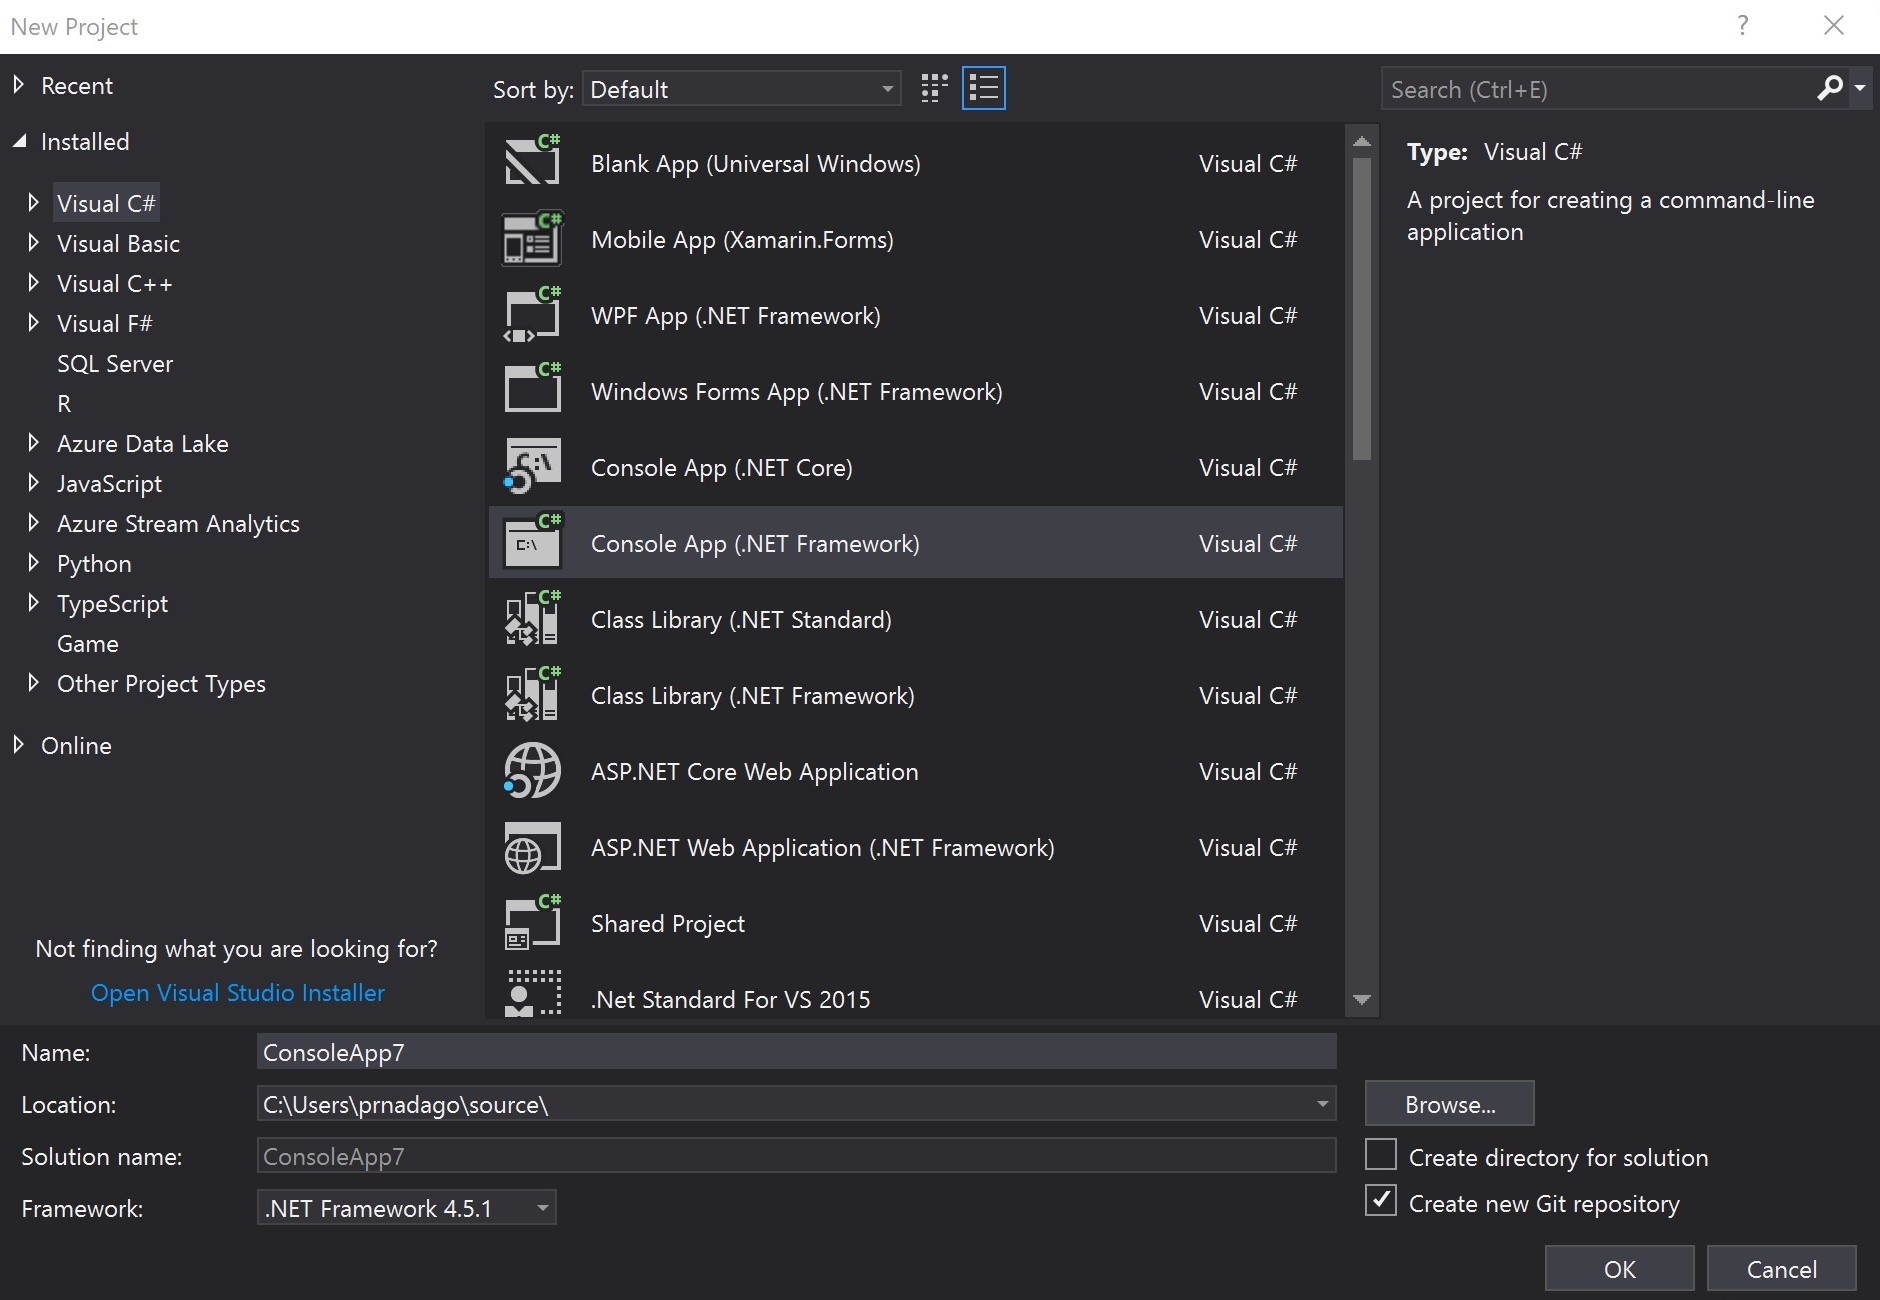
The dialog hadn’t changed much since 2010, and the interaction model between folders and items has been in place since Visual Studio .NET back in 2002. We hadn’t put much time into the New Project Dialog because we believed it largely served its purpose. Until recently, we didn’t have the telemetry in place to be able to analyze how this dialog was used. Our initial hypothesis was that most of you interacted with the dialog rarely. And instead you spend much more time modifying projects you had previously created. After a bit of user research and analysis, we found that the latter holds true. But we were quite mistaken about the former. Many of you use the dialog to create new projects to try out new things or add on functionality to existing solutions a lot more often than we thought.

User research

We then dove deeper into the data, particularly looking at the usage patterns from new users of Visual Studio. We found that there was a surprisingly large drop-off in usage after launching Visual Studio to opening a project to start coding. That led us to the hypothesis that the New Project Dialog might be somehow inhibiting success with the tool. So, we expanded our user research and gathered that this dialog was presenting you with too many concepts, choices, and decisions. The process of getting started with your code wasn’t straightforward enough. The hierarchy of the nodes wasn’t consistent. When you installed several workloads you would see too many languages and technologies presented at the top level. Further down into the second and third level of nodes, the taxonomy became quite unmanageable with differences in naming conventions of categories.

When we asked participants in our usability studies to search for code scaffolding to get started with certain types of projects. We saw them click around through the top level nodes, and not click through the hierarchy. Sometimes they completely ignored the structure on the left and focused just on the default list of templates in front of them. What surprised us was that even for experienced developers, some of the options weren’t intuitive. Most couldn’t pinpoint the link to ‘Open Visual Studio Installer’ when the templates they were looking for weren’t available. They glazed over the search box without interacting with it. They seemed to completely ignore the recent templates list. And when they finally selected a template, they lacked confidence in their choice.

In addition, we learned that most of you think about your app type first but there are some who think about languages first when finding templates to start coding. It became clear that this mixed structure wasn’t intuitive for either use case. The barrier to the first actions within Visual Studio was too high. And this was a problem that small UI tweaks weren’t going to solve.

Design principles

During the design and development of Visual Studio 2019, we looked at usage across different areas of the project creation process and honed down on a core design goal –

“Get to code quickly with the minimum necessary scaffolding and help developers configure their application with the right settings”

Remove unnecessary choices

There were several options in the dialog box that we sought to remove as a way of simplifying the set of decisions you had to make. We first cleared out the rarely used toggles to sort templates and change icon size. The checkbox to create a git repository provided little value when creating a project. Our research told us that the right step for git init was either before project creation when you create the local folder or after project creation when you know you want to move ahead with the project. You can now do this in one click through the ‘Add to Source Control’ button in the bottom right of the status bar.

The last option to go was the ability to view and download online extension templates through the dialog. You can also do this through the Manage Extensions dialog in the Extensions menu. So, we eliminated the duplicate behavior to reduce cognitive load while looking for templates. After all that, our design looked something like this:

Search-first

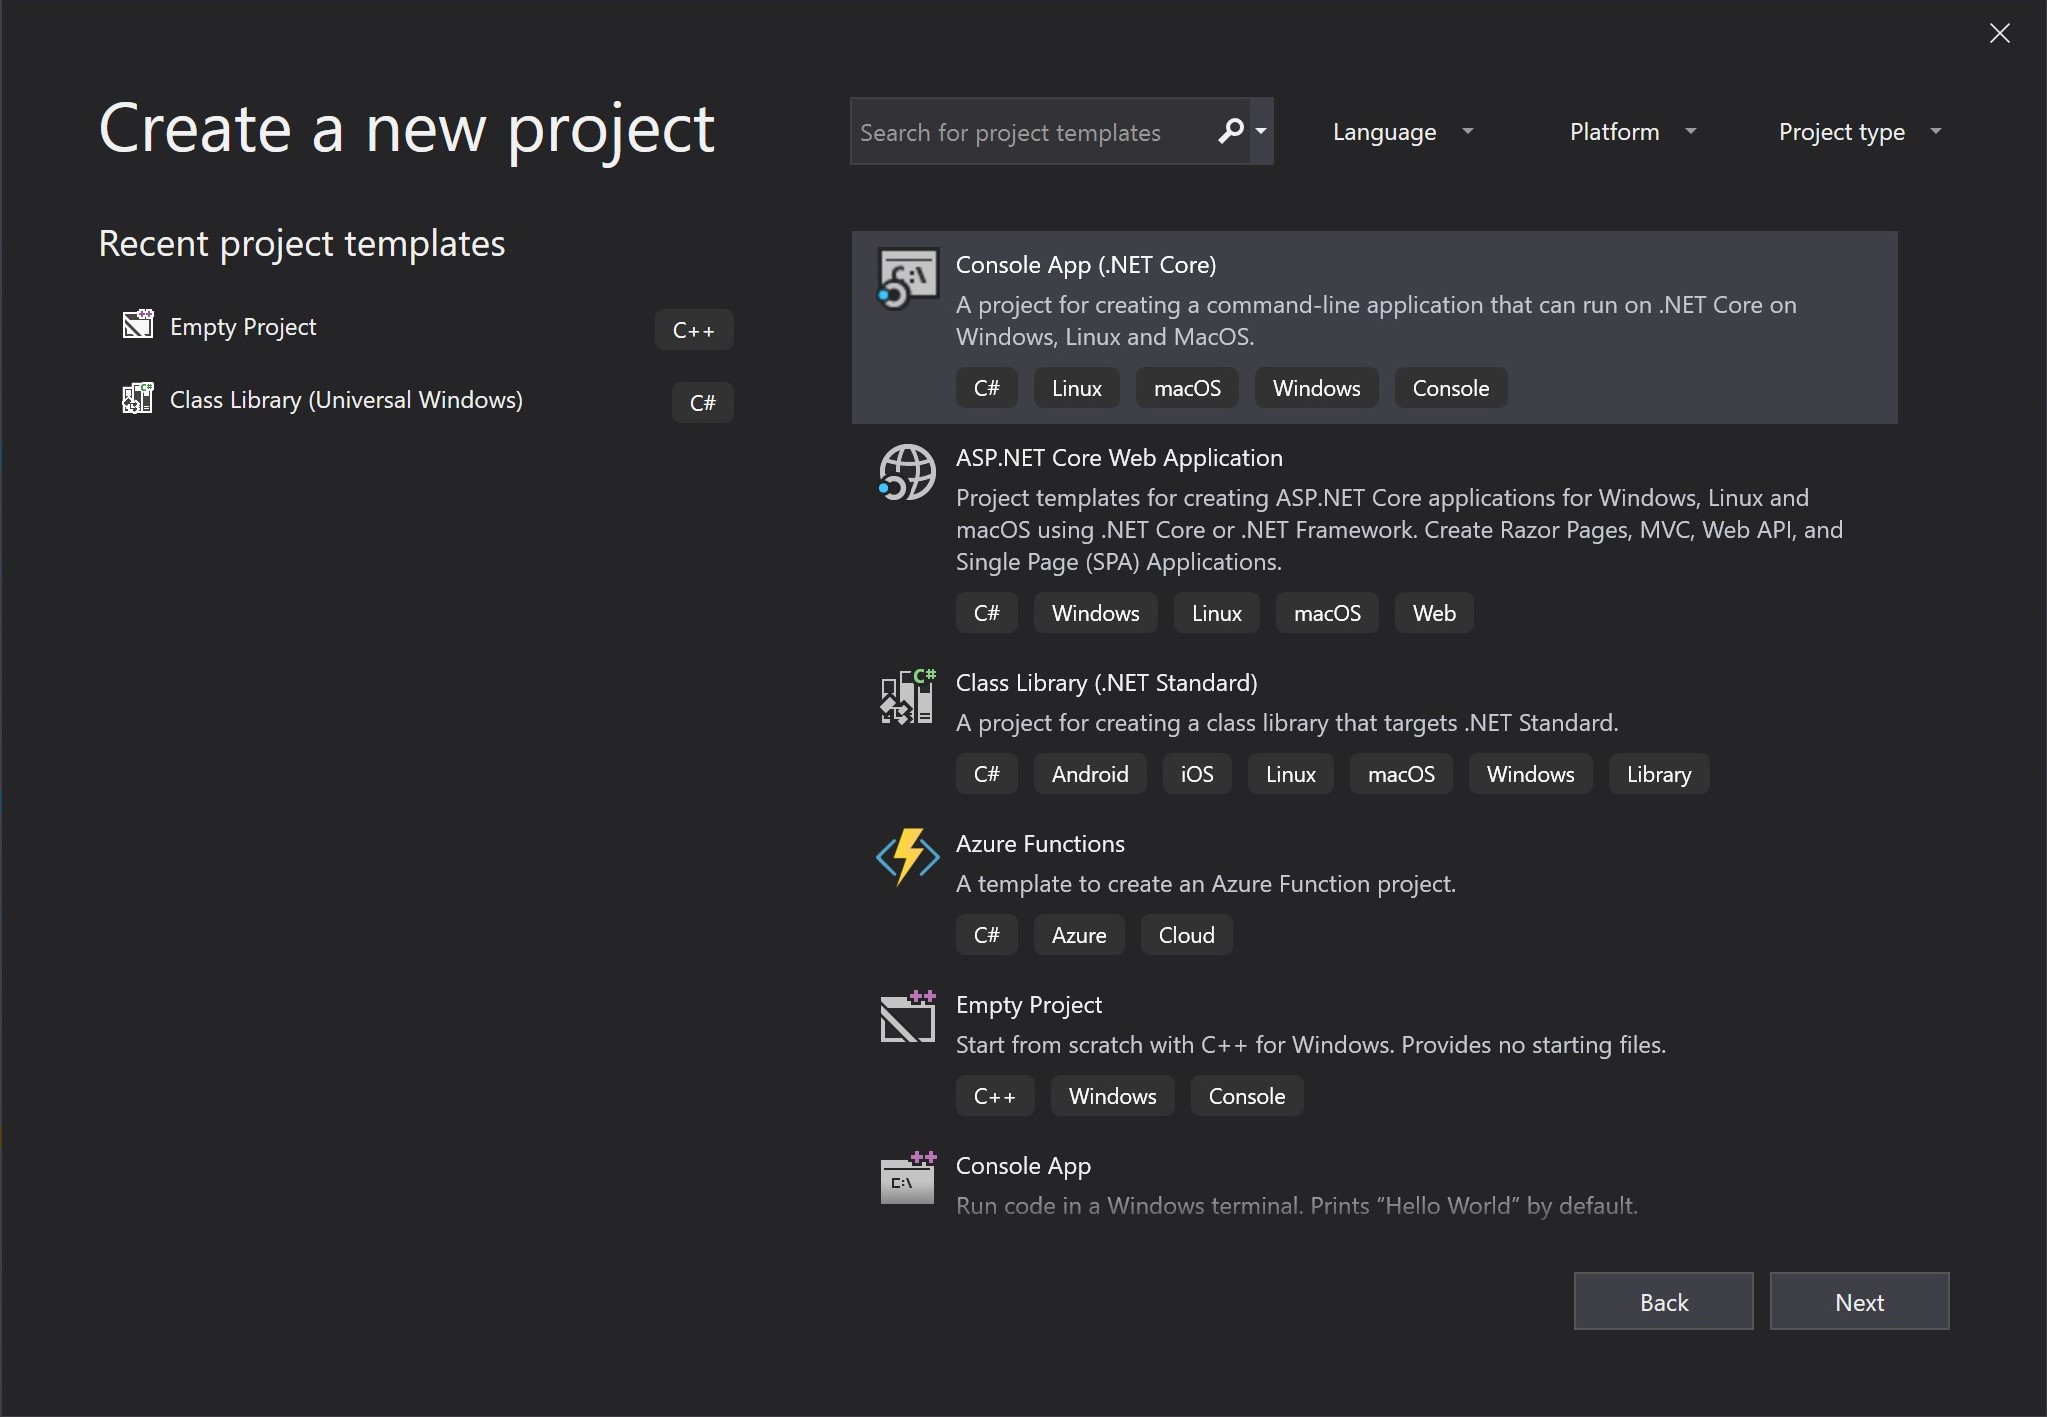
But through design studies we found that this still wouldn’t lead to success. The node structure was still too convoluted to be understandable in early usage. We initially wanted to flatten the tree so that there was less digging and clicking to do. But we soon realized that with the overabundance of supported project types, it was an exercise in futility coming up with a single taxonomy that supported every single template. So, we decided to fundamentally shift the way users could discover templates. The search box had low usage in the old dialog box because its position made it a secondary function. But search is a prominent discoverability mechanism across the industry. So, we wanted to improve the way Visual Studio utilized search to help find what you need.

Our early studies saw participants gravitating towards the search box when we changed its position. But there was still a slight hesitation before typing something in – “what do I search for?”. This led to the realization that search cannot be a catch all, and there needs to be a little more guidance. We took the values we knew from the old dialog’s node structure and saw that they roughly fell into three categories – ‘languages’, ‘platforms’, and the more vague ‘project types’. So we introduced filters and tags as secondary mechanisms to support search. Browsing through the tags in the template list will help you discover the different capabilities of Visual Studio based on the tool-sets installed in your instance. Setting filters will allow you to narrow down the list to your preferred choices when starting with a new project.

One decision at a time

We also broke up the process into two separate screens. There is a single decision point on the first screen – select a template. And all the interface elements direct you to make that choice. The second screen is all about providing details about the project type you’ve selected. You can modify the values here or move through the project configuration screen without changing anything since all the recommended defaults are set for you. Some of the more complex project templates then open a third screen which has custom options specific to that project type.

Looking at the template list itself, we made a point to sort this list by our most recommended project templates for the workloads you have installed. So, the template that you should select if you aren’t exactly sure what to do would be the one placed higher in the list. We found that most of you don’t use more than 10 different types of templates, so we’ve made the recent templates list even more prominent than it was in Visual Studio 2017, so that you can get to your most common templates without having to search for them.

Looking forward

This is the first iteration of a new design paradigm we’re trying to adopt for Visual Studio. We’ve been measuring adoption and engagement since the launch of Visual Studio 2019 earlier this month and we’re happy to see a significant increase in success rate through the get to code journey. But at the same time, we acknowledge that the evolution of the experience isn’t over just yet. We’re continuing to listen to your feedback and learning from you to ensure success. We’re on the path to make improvements to search and filtering as they are now the key functionality to finding the right templates. In addition, we recently built in the ability to add tags to your own custom templates. If you’re a template author, find out more on how to update your templates in this blog post. We released this functionality as the result of your direct feedback, and we thank you for it. But we are looking to do better and could use more of your help. Please continue to share your feedback through the Visual Studio Developer Community.

The post Redesigning the New Project Dialog appeared first on The Visual Studio Blog.

Java on Visual Studio Code April Update

$
0
0

Welcome to April update! Java 12 is now officially supported with Visual Studio Code. We’d also like to show you some new and helpful code actions now available, along with new features from Debugger, Maven and CheckStyle.

Try these new features by installing Java Extension Pack with Visual Studio Code. See below for more details!

Java 12 Support

Java is now updating with a faster pace and we’re following closely. Thanks to the upstream update from JDT, you can build your project with Java 12 features now with VS Code as well. To use the experimental language features such as the new switch statement, add the following settings to pom.xml:

<build>
    <plugins>
        <plugin>
            <groupId>org.apache.maven.plugins</groupId>
            <artifactId>maven-compiler-plugin</artifactId>
            <version>3.8.0</version>
            <configuration>
                <source>12</source>
                <compilerArgs>--enable-preview</compilerArgs>
            </configuration>
        </plugin>
    </plugins>
</build>

Easier Getting Started

Although Java has been there for a long time, it still attracts new developers, and we’d like to make sure it’s easy enough for anyone to start programming Java with VS Code. One of the improvement we made recently is to provide you more detailed information to fix your environment setting.

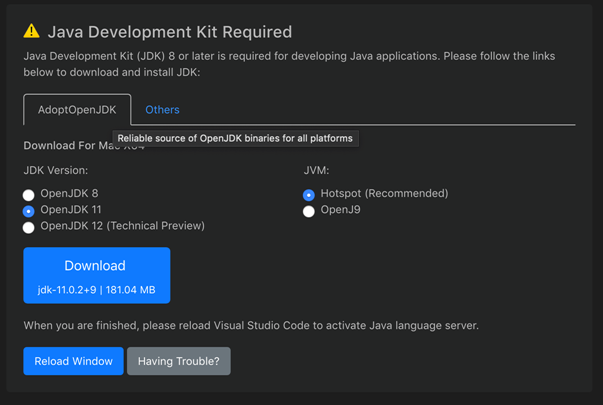
What if you don’t yet have JDK installed? No problem. When the Java extension pack is loaded, we will automatically detect whether a JDK is present. If not, we will provide you links to download reliable JDK at your choice.

Better yet, we’re also working on a customized VS Code distribution which will help get you ready with everything needed for Java development with a single installer. To learn more, please sign up at the end of this post to receive latest news and updates for Java on VS Code.

Performance Improvements

We’ve been benchmarking and profiling the performance of VS Code for Java, on all platforms and major scenarios including loading and editing. There were several enhancement to improve performance in recent releases.

  • Improved editing performance when dealing with large amount of source file opened in the editor
  • Optimize start up and load time with better server initilization and lazy downloading Java source

As we try our best improving performance, it would still take some time when importing a big Java project to Visual Studio Code. In this case, it would be helpful to show more progress details and let you know what’s actually happening behind the scene. Instead of just showing the percentage of progress, we now added detailed step information into the status, such as inspecting location, configuring project, updating Maven dependencies, refreshing workspace and build workspace to let you know the wait is meaningful.

More Code Actions

Code actions are key to your productivity, so we keep bringing more of them to Visual Studio Code.

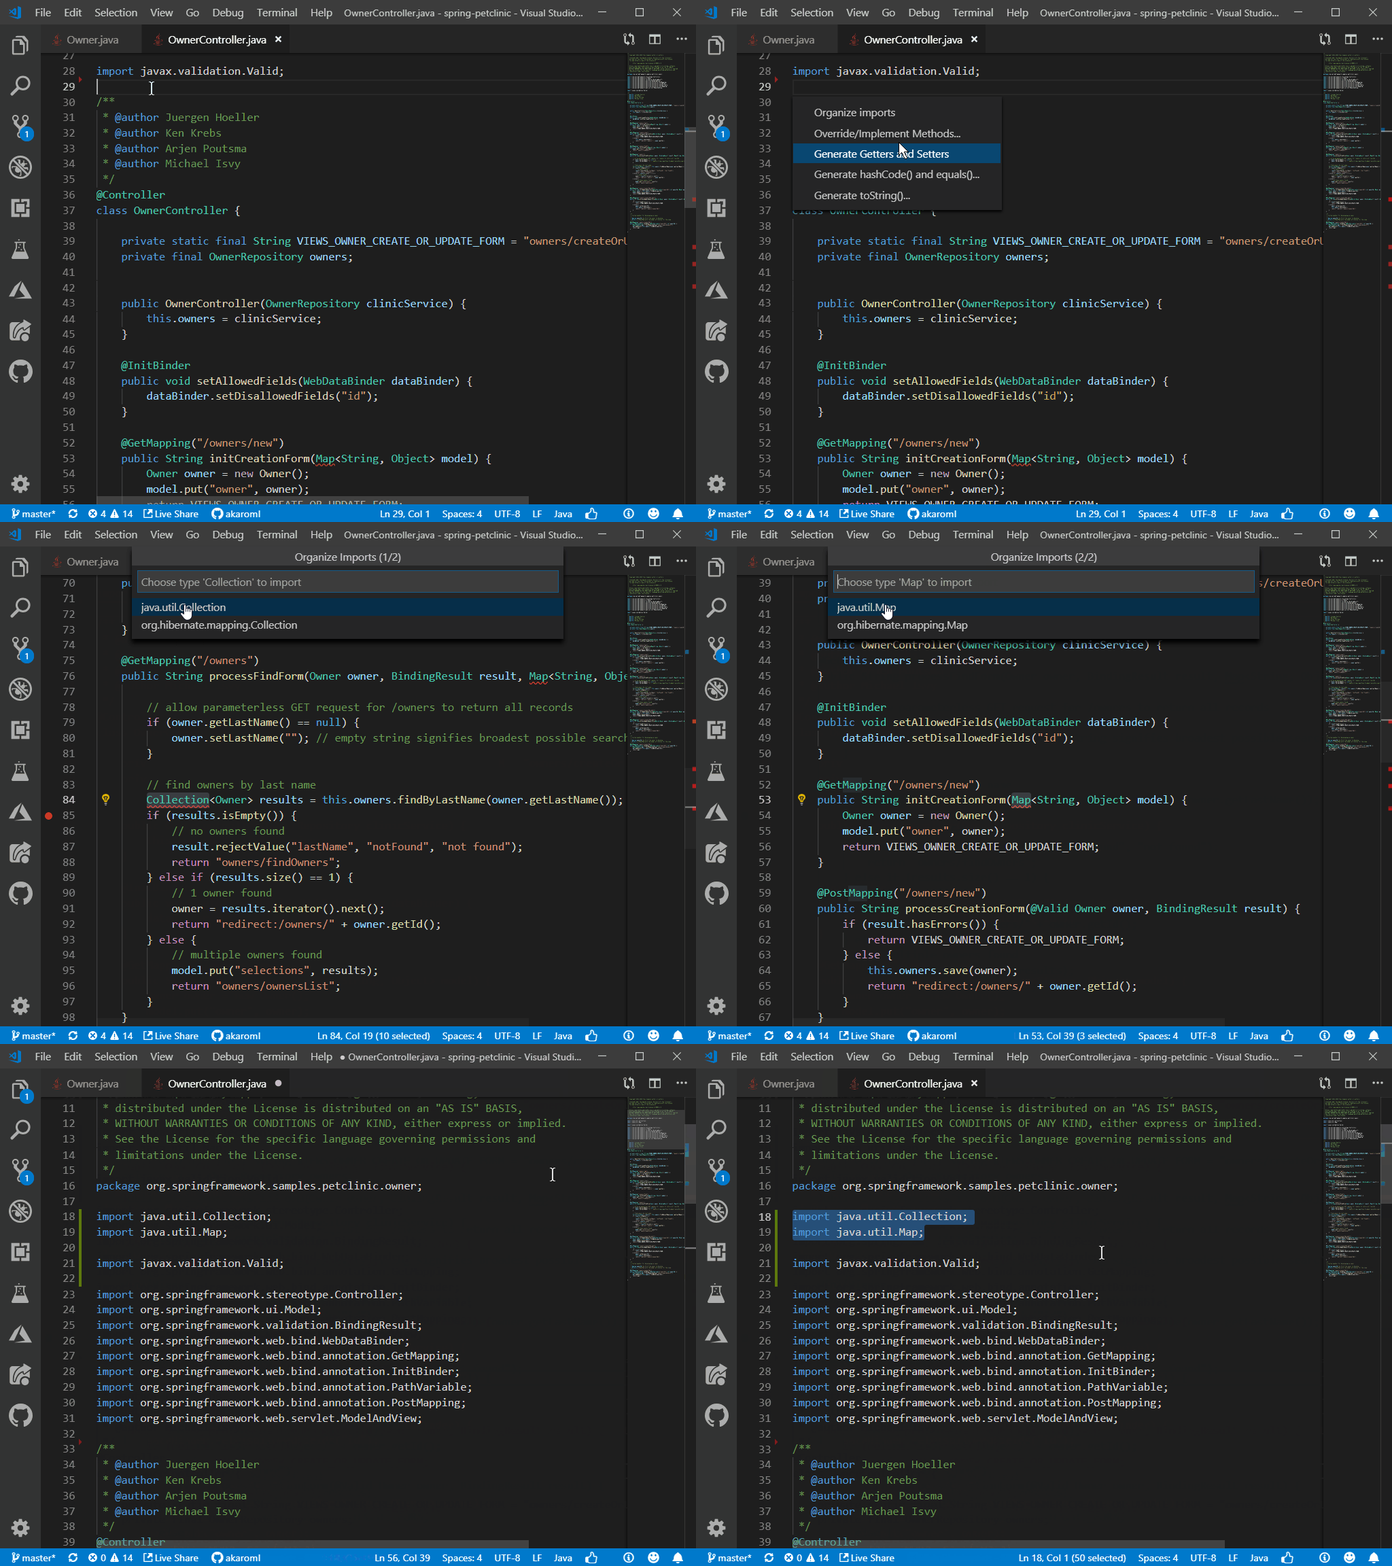
Resolve ambiguous imports

To deal with ambiguous imports, you now have a dropdown list to pick the right one. The code line with the unresolved type is also presented to you to help you decide.

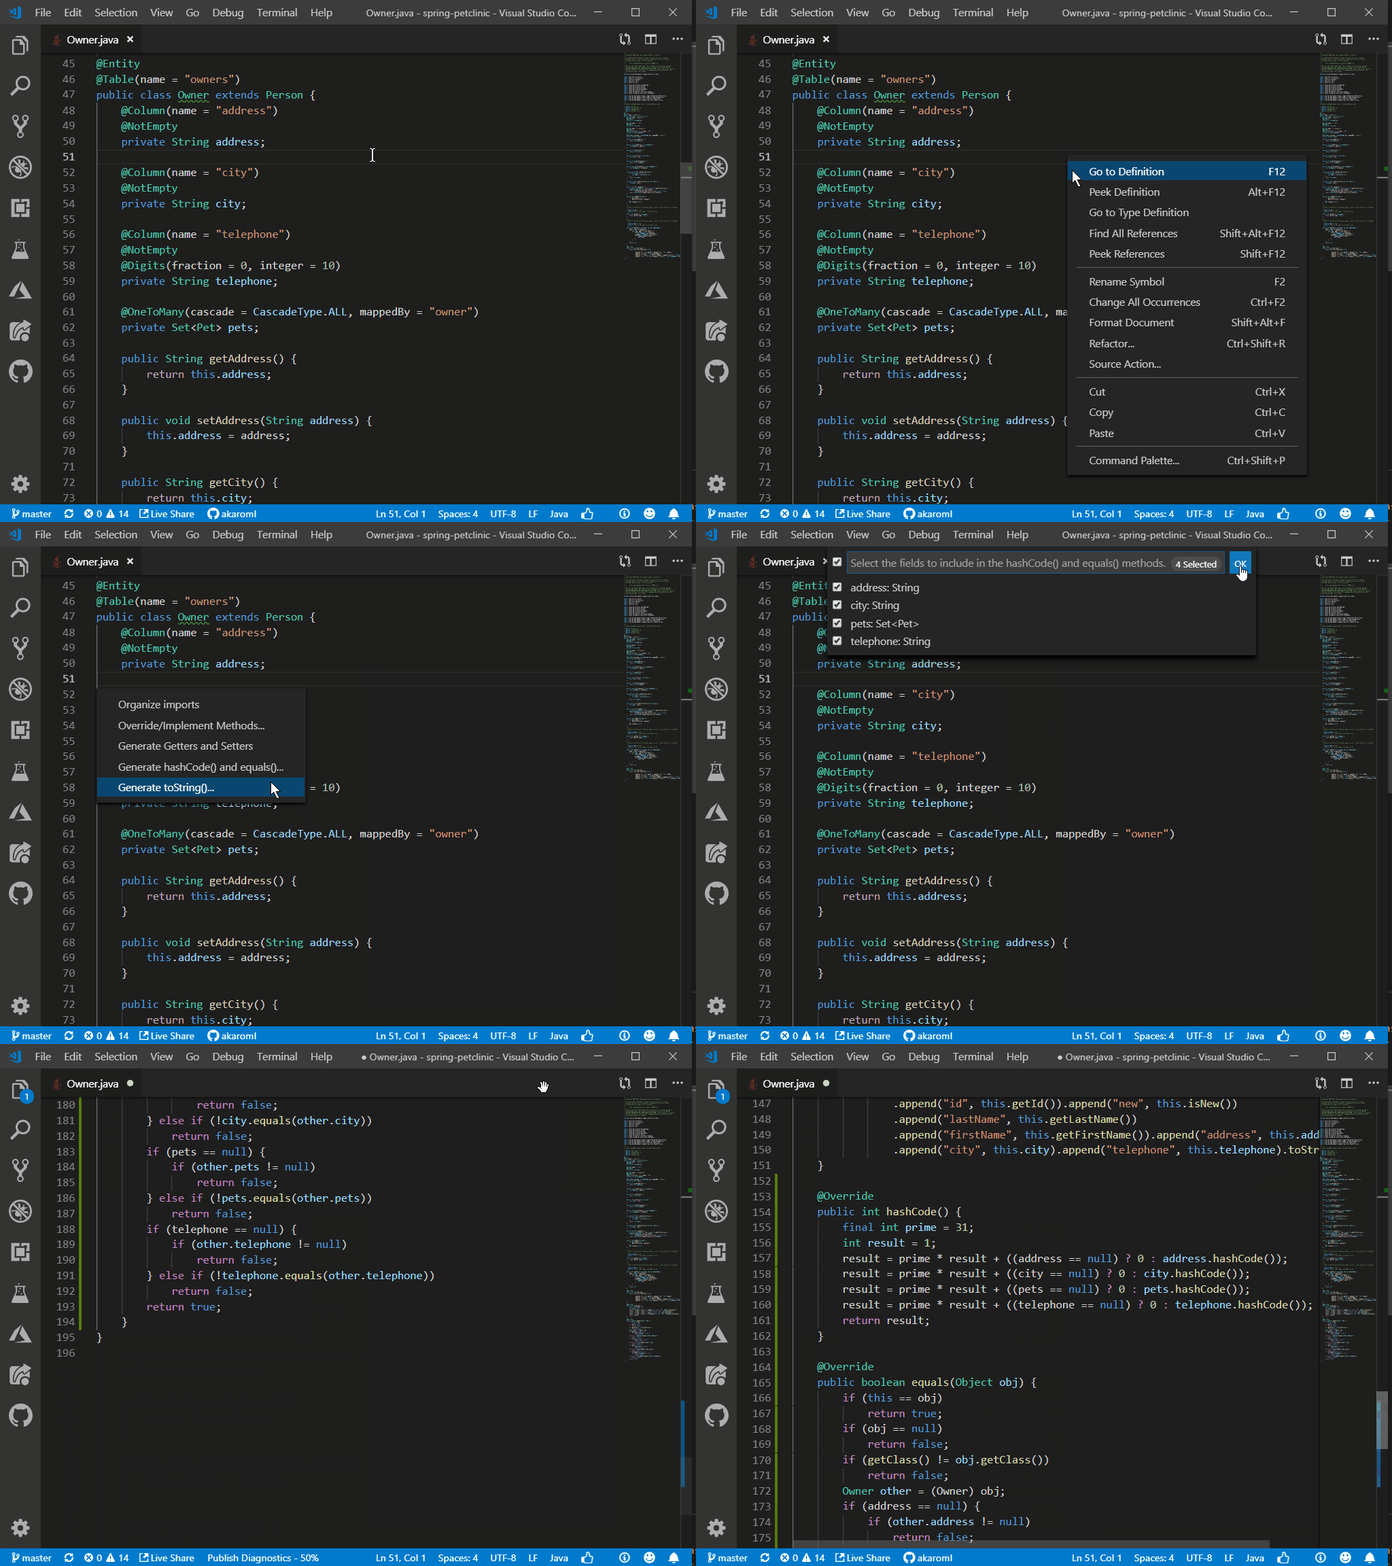
Generate hashCode() and equals()

Now hashCode() & equals() can be generated with default implementations. All the non-static member variables are listed, and you can customize the generated code using the check list.

There are two options for you to customize the generated code:

  • If you use Java 7+, you can set java.codeGeneration.hashCodeEquals.useJava7Objects to true to generate shorter code which calls Objects.hash and Objects.equals.
  • You can also set java.codeGeneration.hashCodeEquals.useInstanceof to check the object type instead of calling Object.getClass().

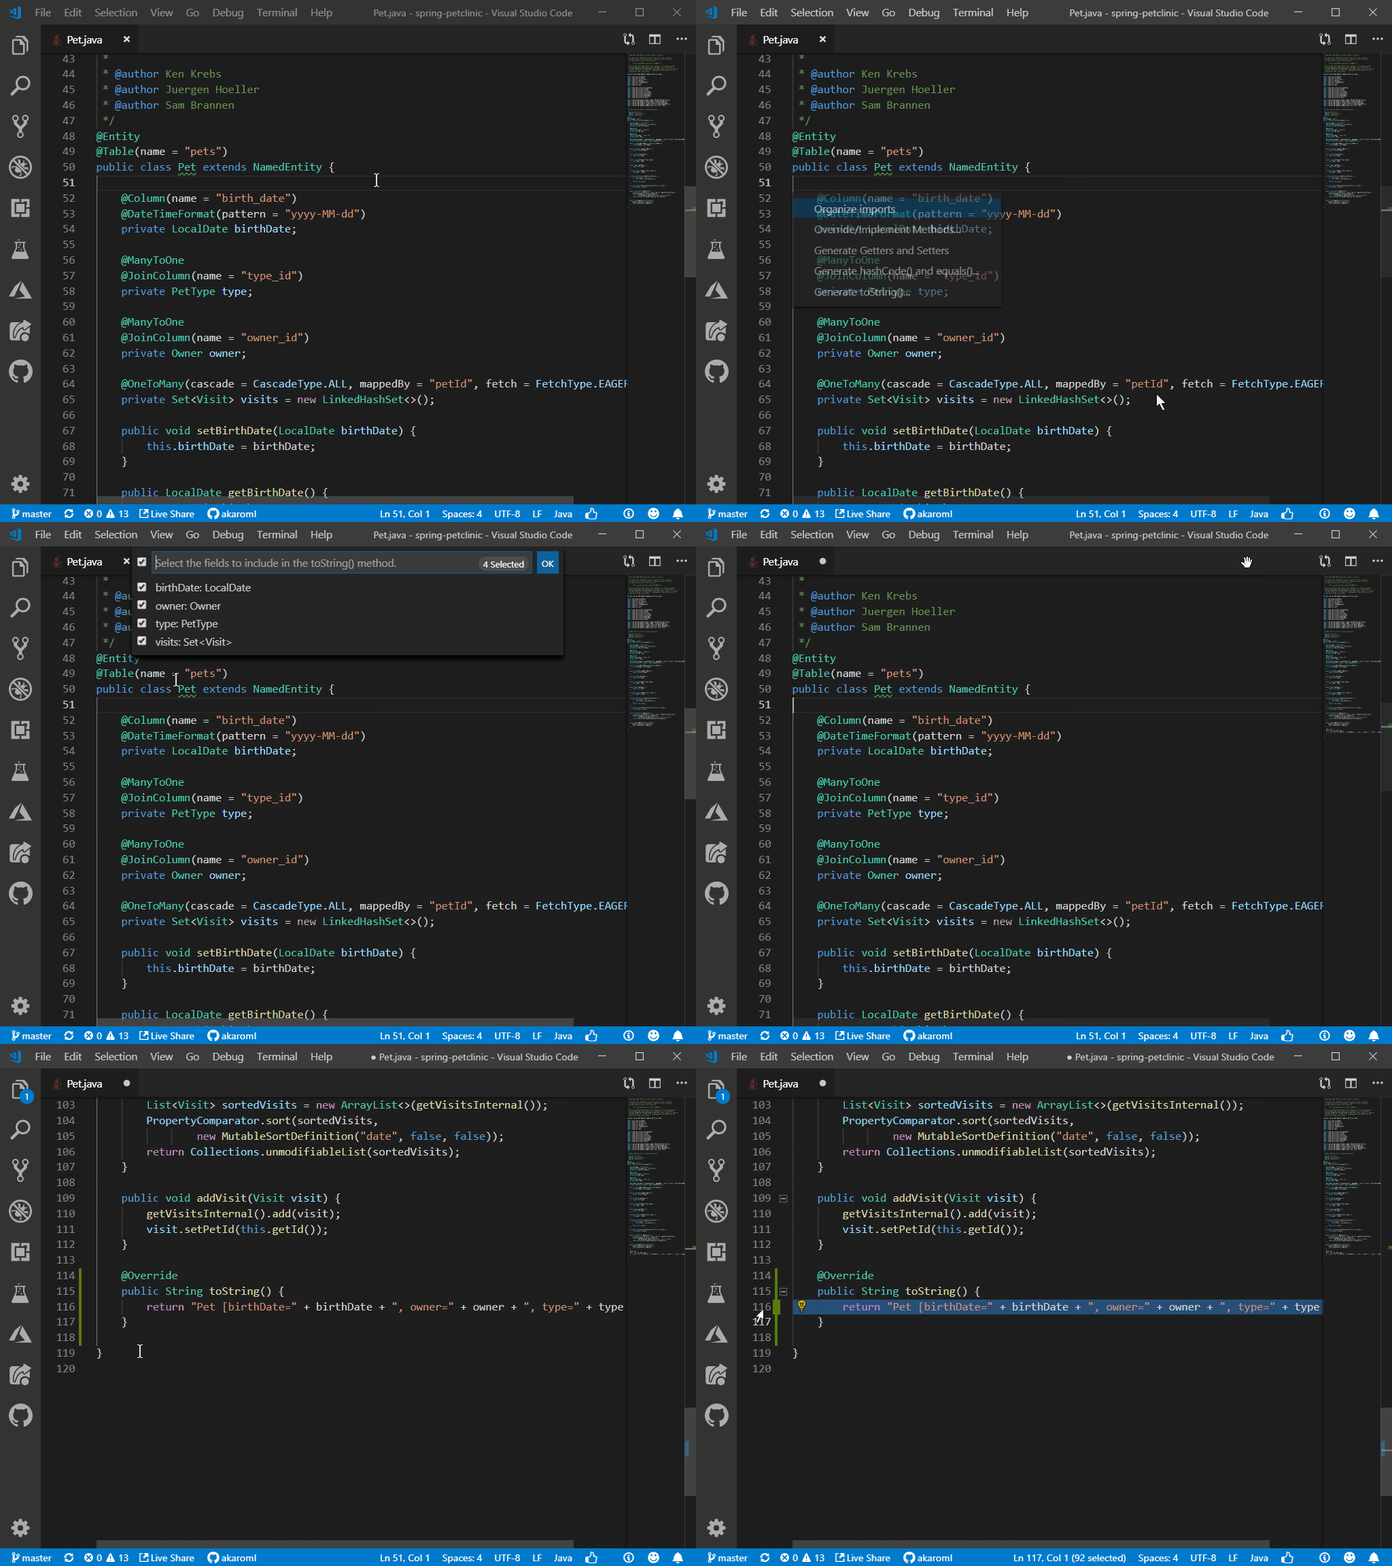
Generate toString()

Picking which fields to be included in the toString() method and configure its template are all supported with the Generate toString() code action.

Extract to local variable

To create a new variable (correctly typed) from the return value of an expression, the new quick fix extract to local variable provides a quick fix bulb which appears when the cursor stops at the bracket (). The keyboard shortcut is ctrl + .

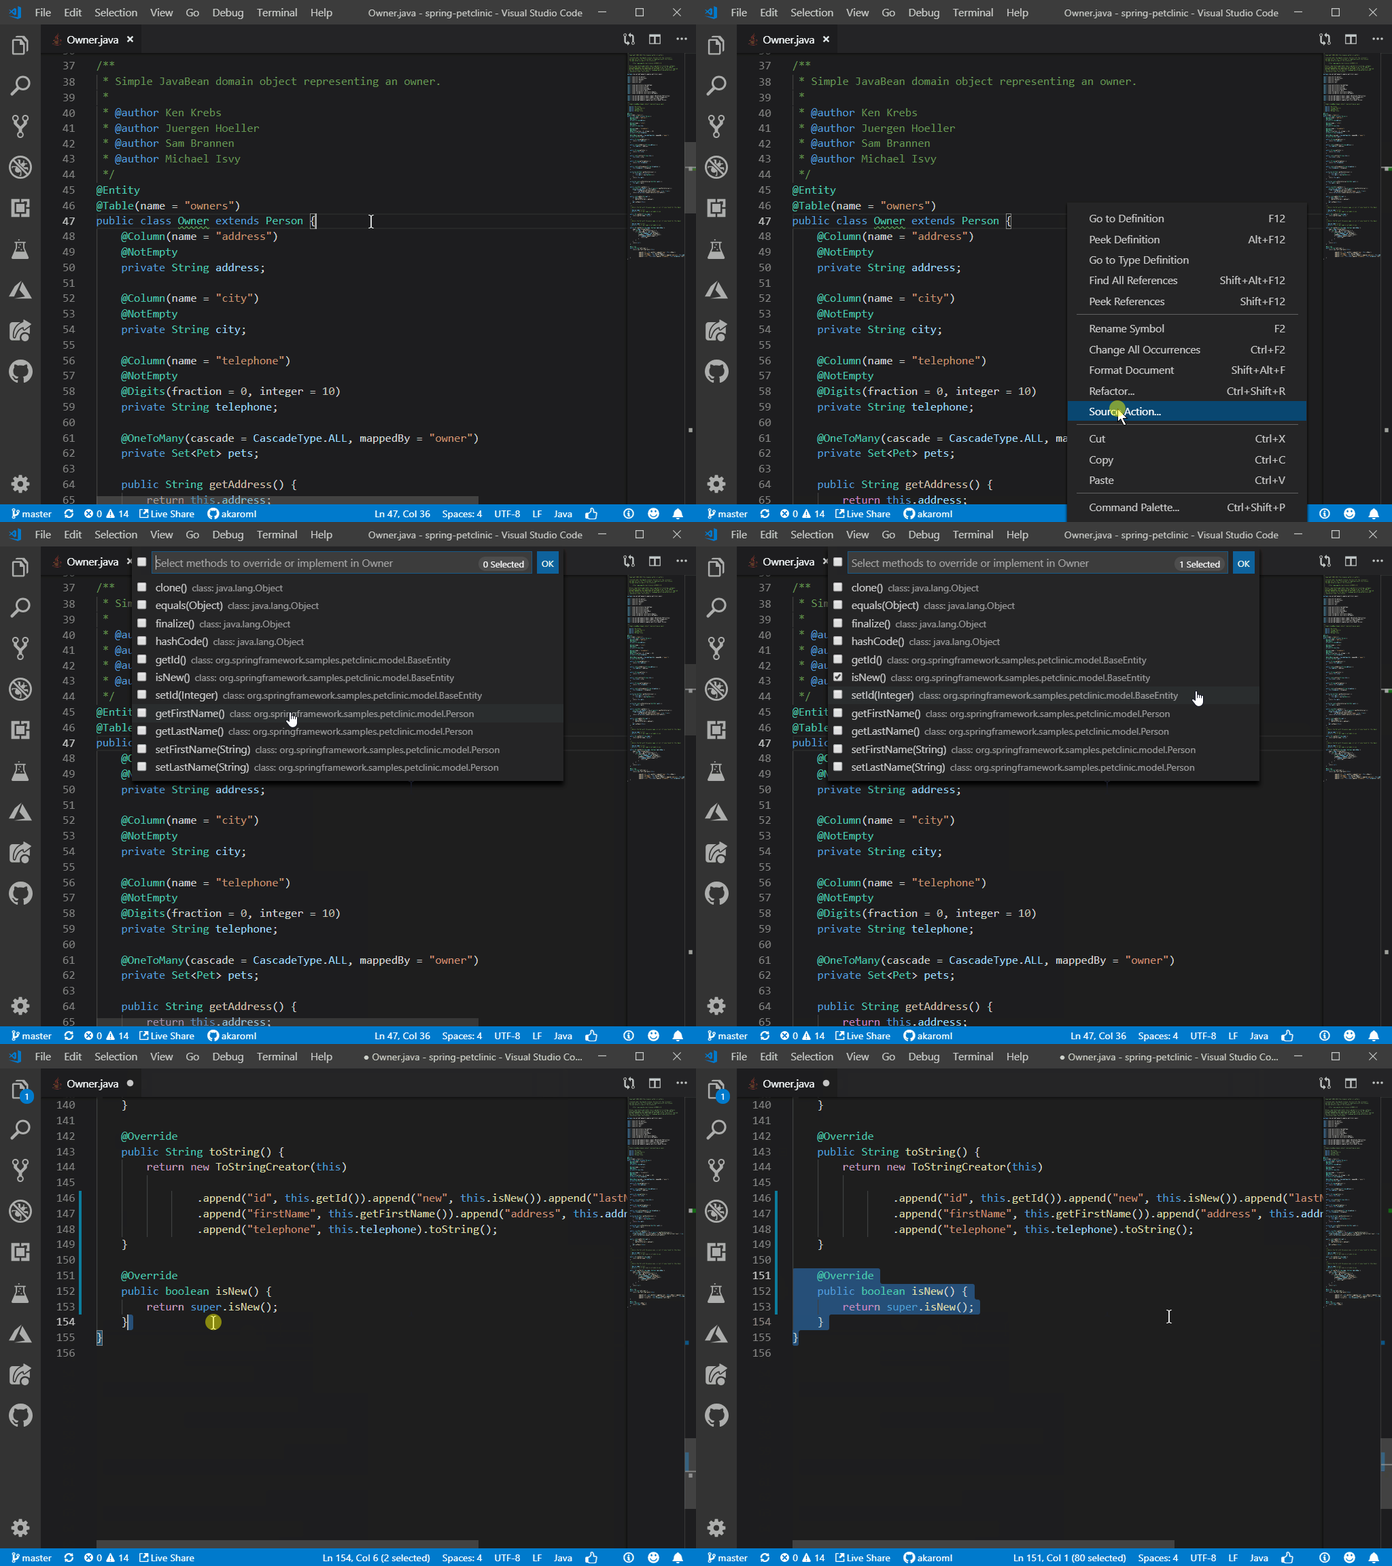
Override/Implement methods

With this new source action, all the cadidates are presented to you with a checklist. Then you can decide what to override or implement.

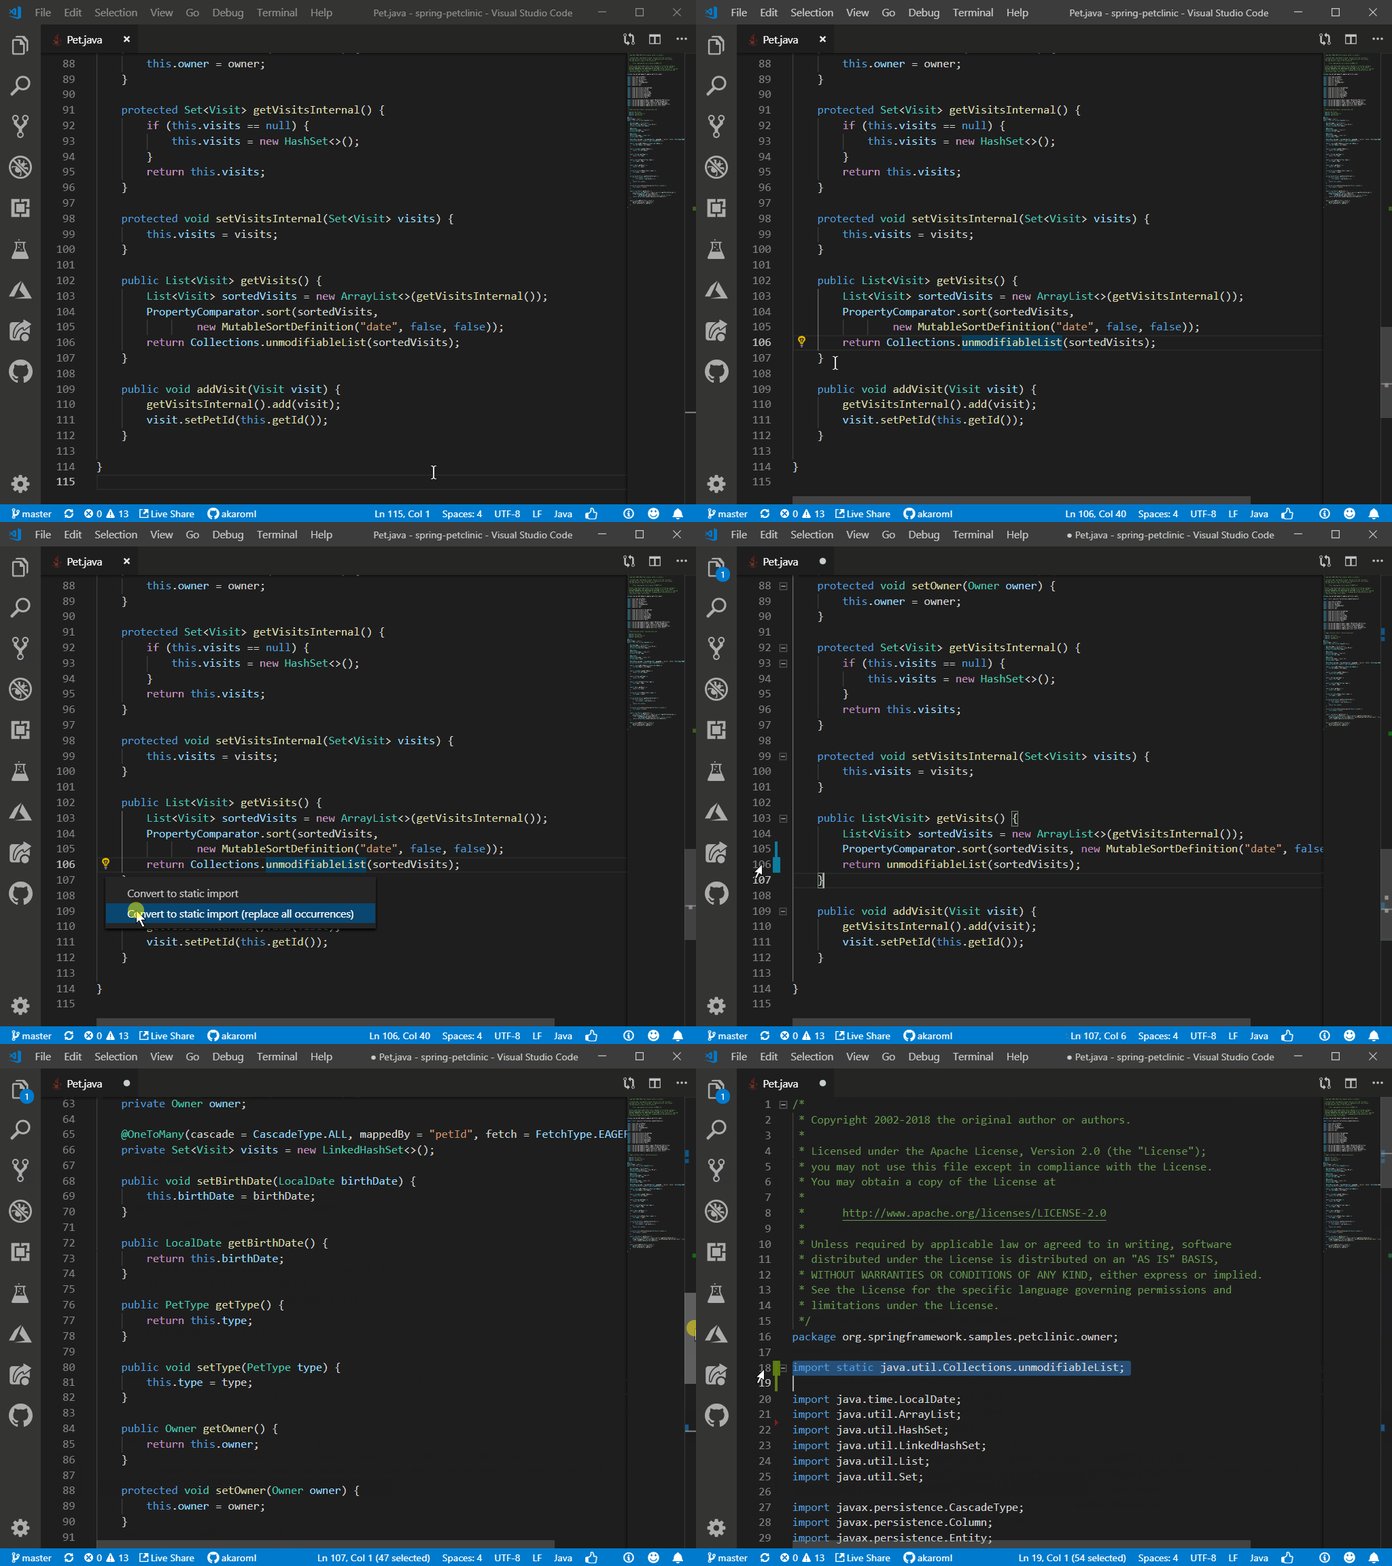
Add static import

You can now convert static functions calls to static imports.

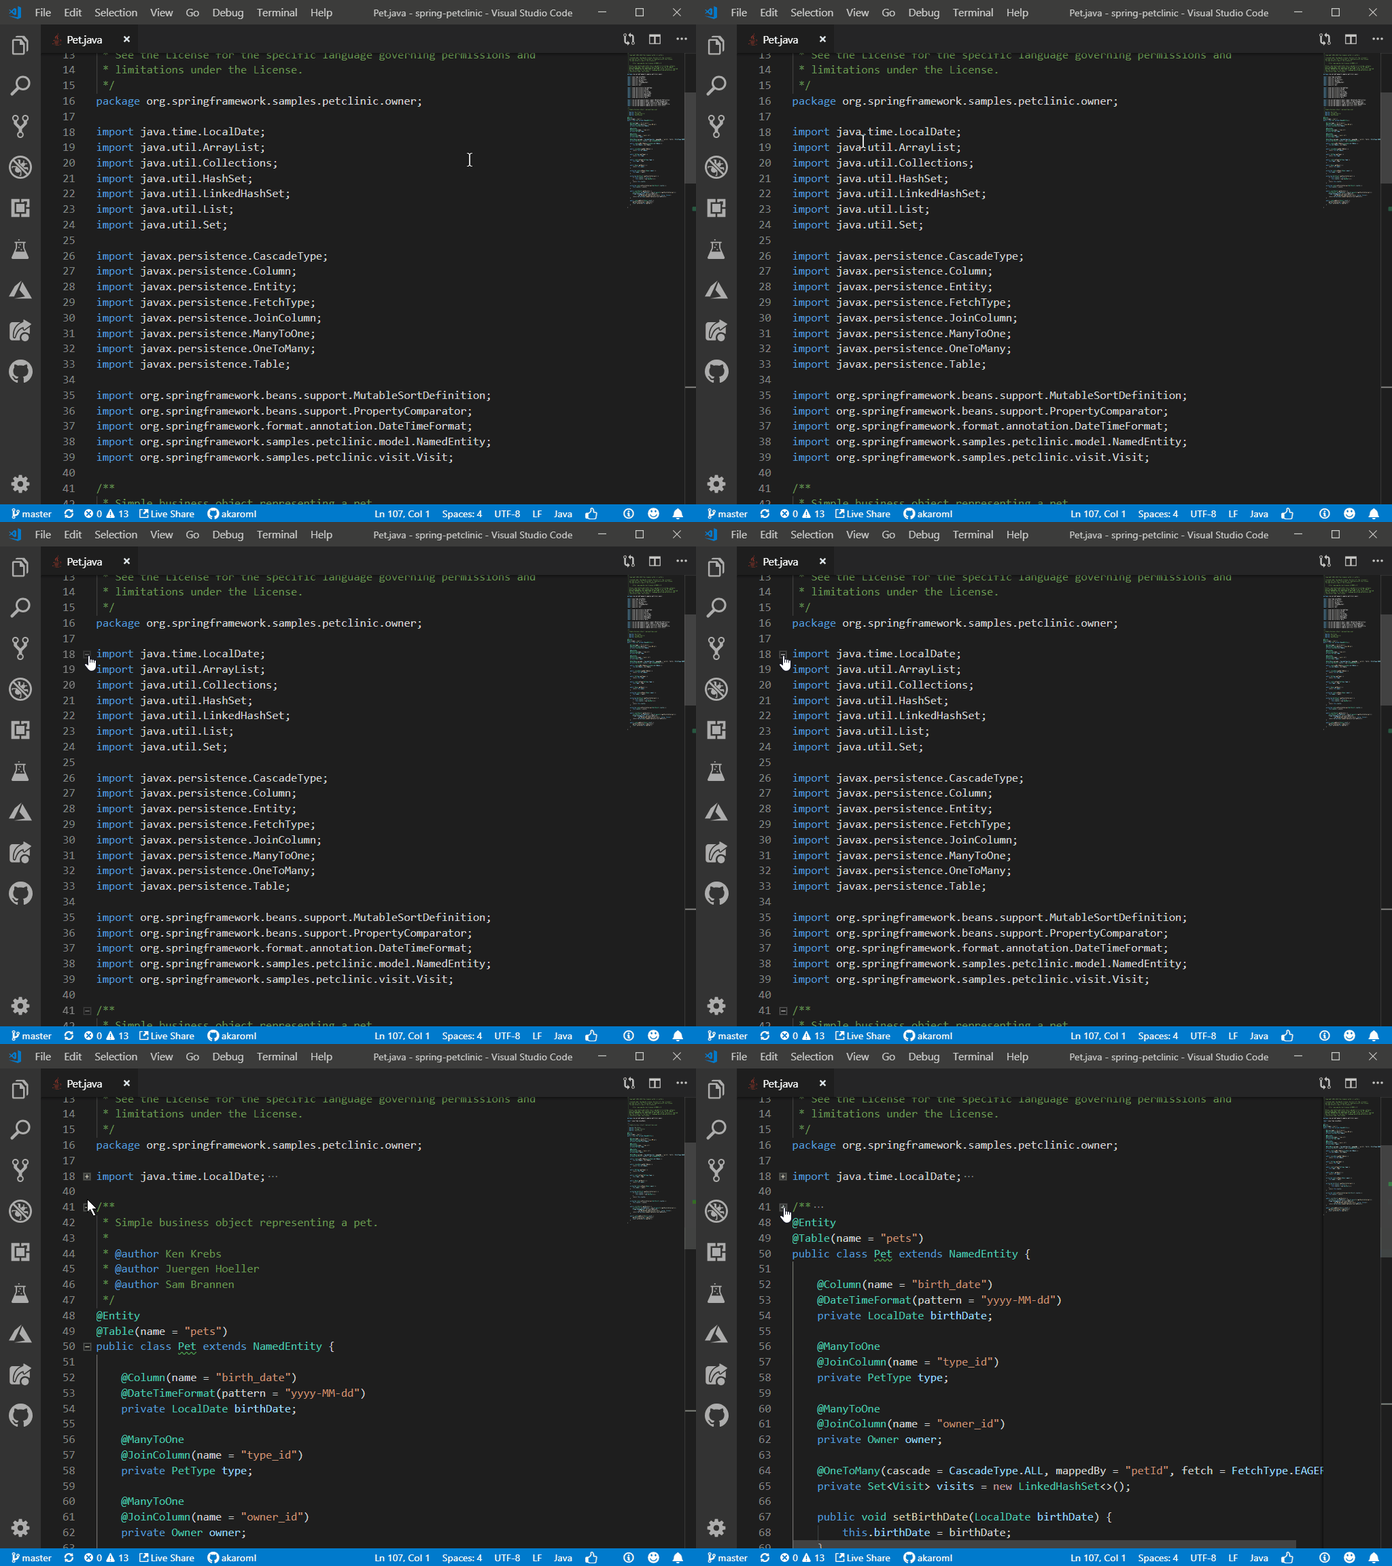
Folding Range

Now you can expand or collapse sections of code to make your Java file easy to read. We’ve enabled a couple popular ways for you to specify which code elements should be considered as a region to fold.

Debugger Updates

Debugger is one of the most used extension in the Java extension family, and we’re excited to show you the improvements below

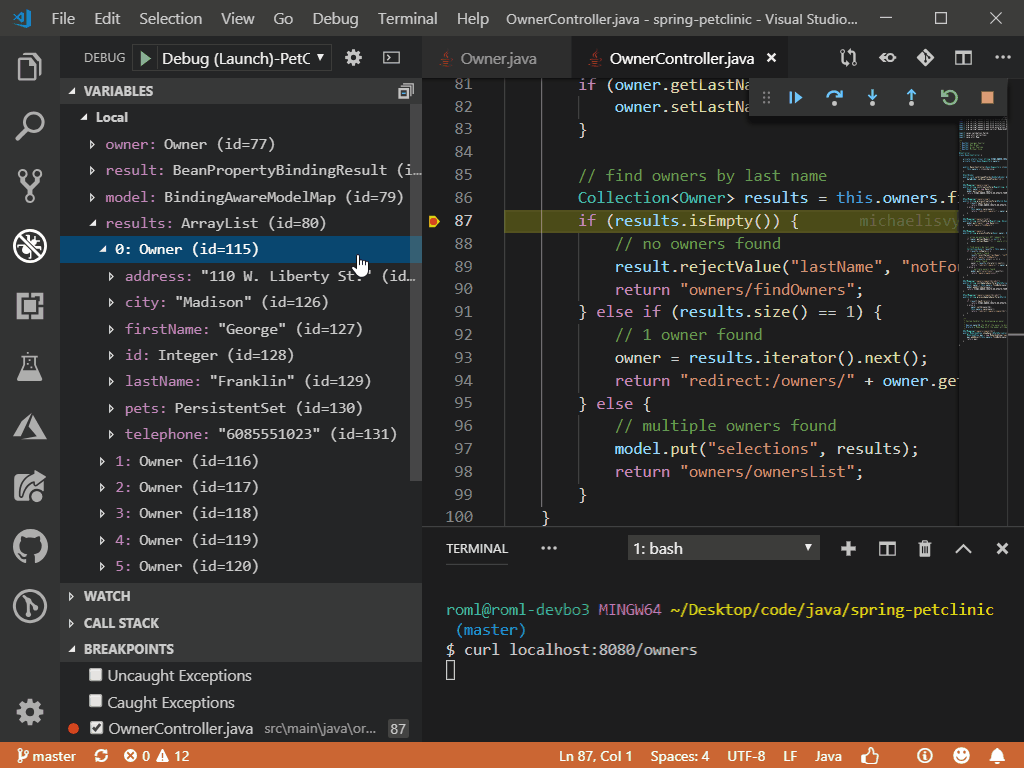
Display Logical Structure of Collections

The debugger is now showing the logical structure of lists and maps, instead of the physical layout of the collections. If you prefer the physical layout view, you can go back by setting java.debug.settings.showLogicalStructure to false.

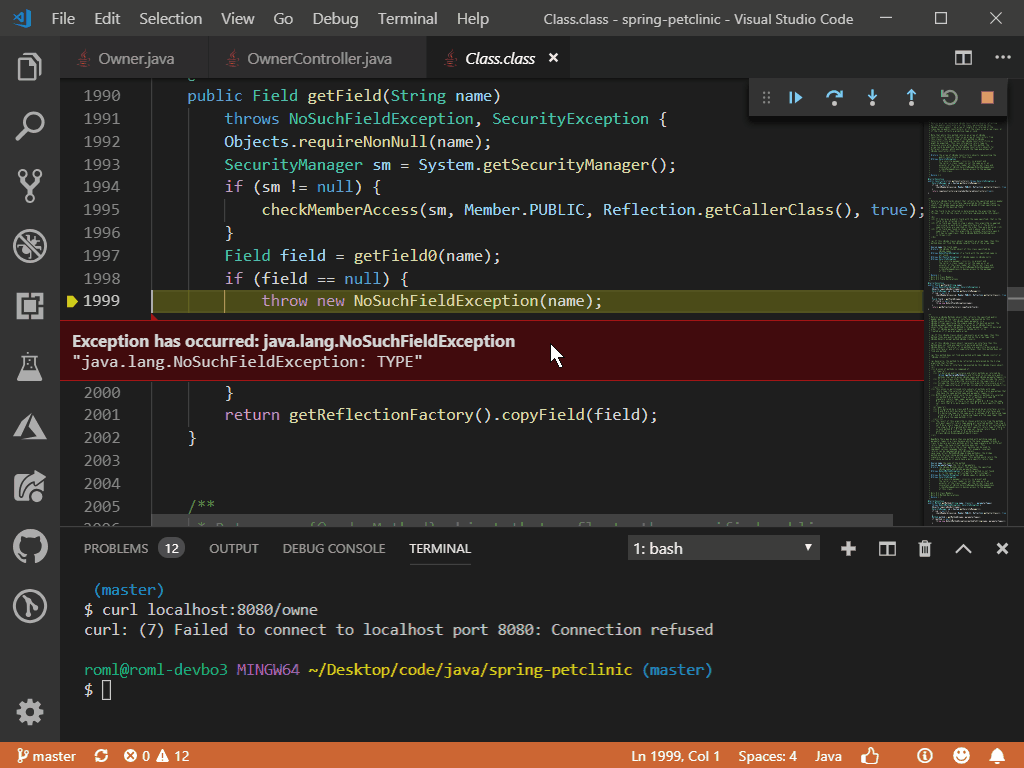
Hightlight Exceptions in Editor

Exceptions are now highlighted with extra info in the editor window. Before that, you need to hover on the exception to see details. Now the most important info is presented to you right at where it occurs.

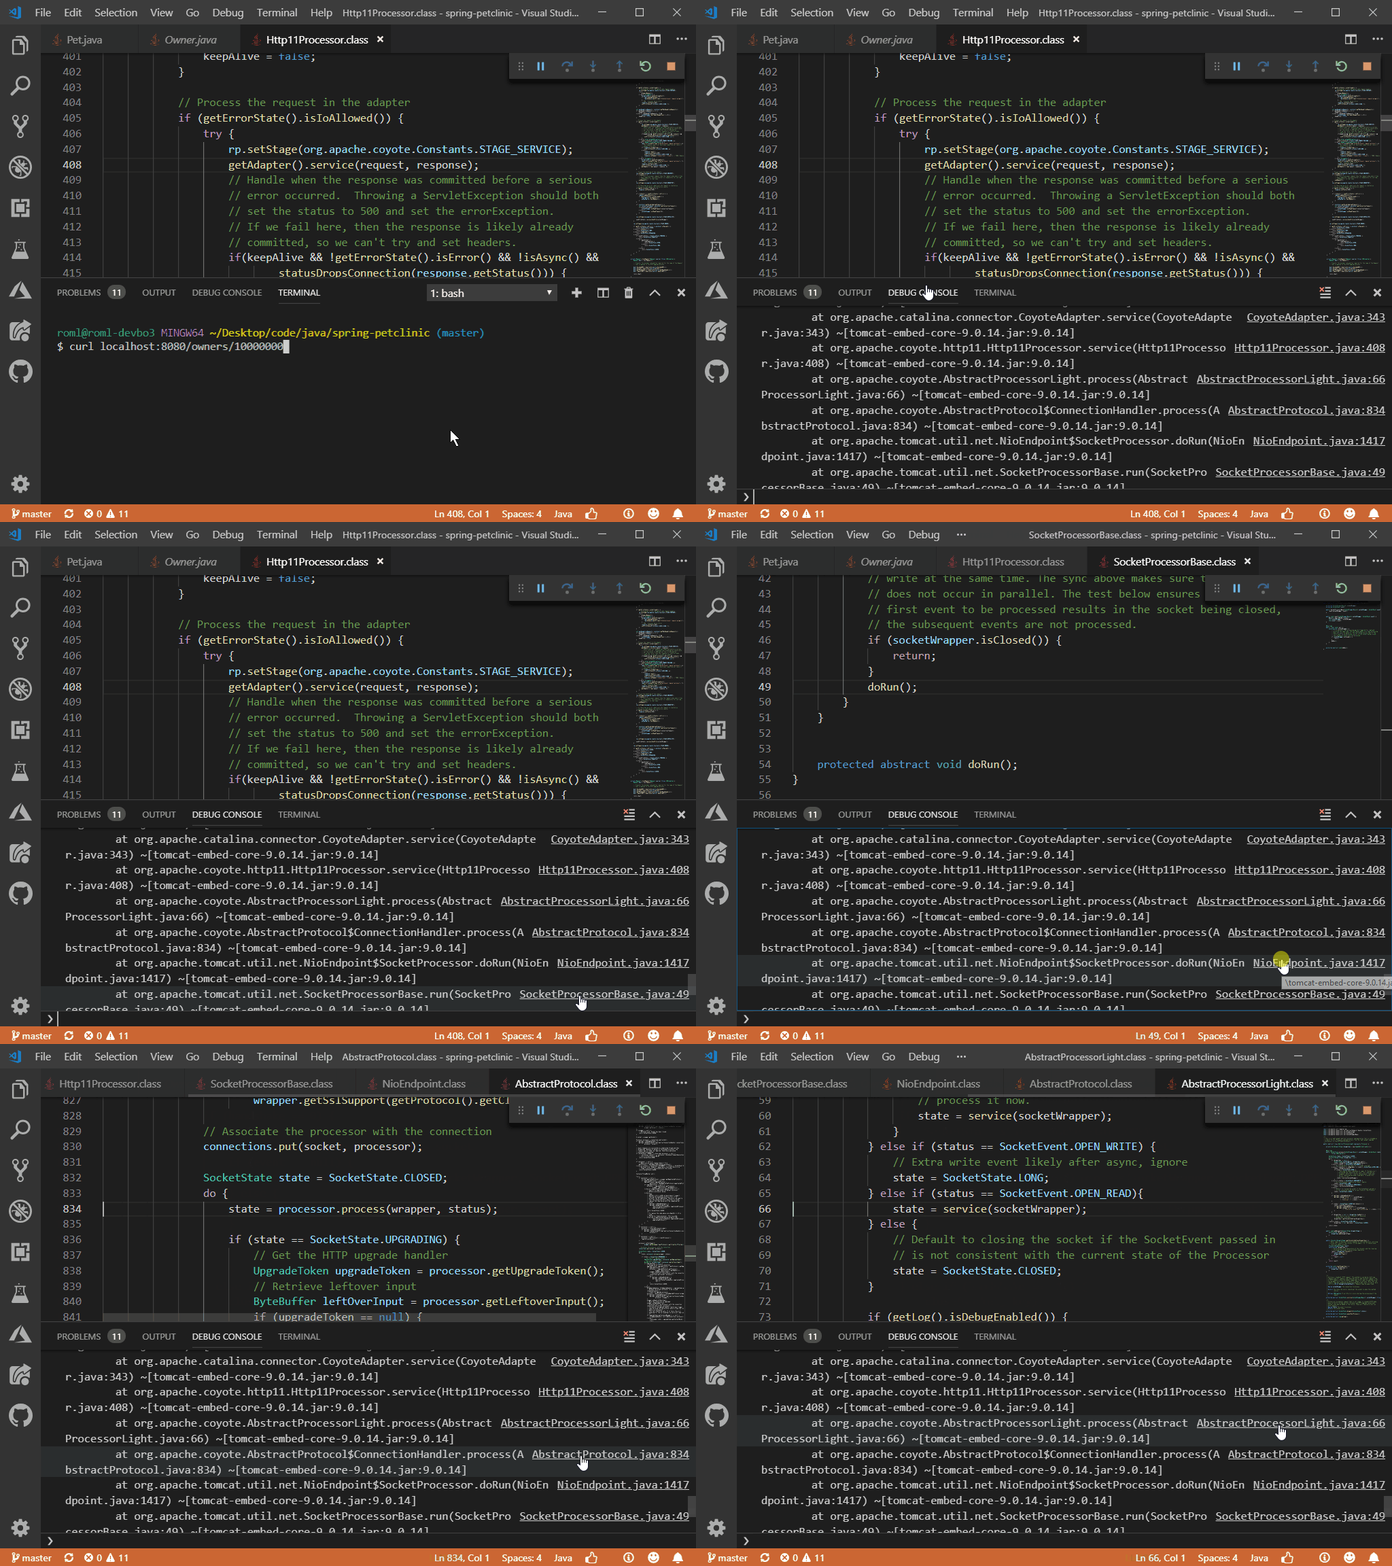
Go to Definition by Clicking Stack Trace in Debug Console

When there an exception, you can now click on the stack trace to see the definition of the function calls.

Other notable featutes include

  • Auto-completion in debug console for types without source code
  • Auto shorten the command line when file name or extension is too long.

Maven Updates

And a couple new features for Maven as well.

Debug Maven Plug-in Goal

Now you can easily configure your breakpoint and start debug any Maven goals with just a couple clicks.

Customize maven commands

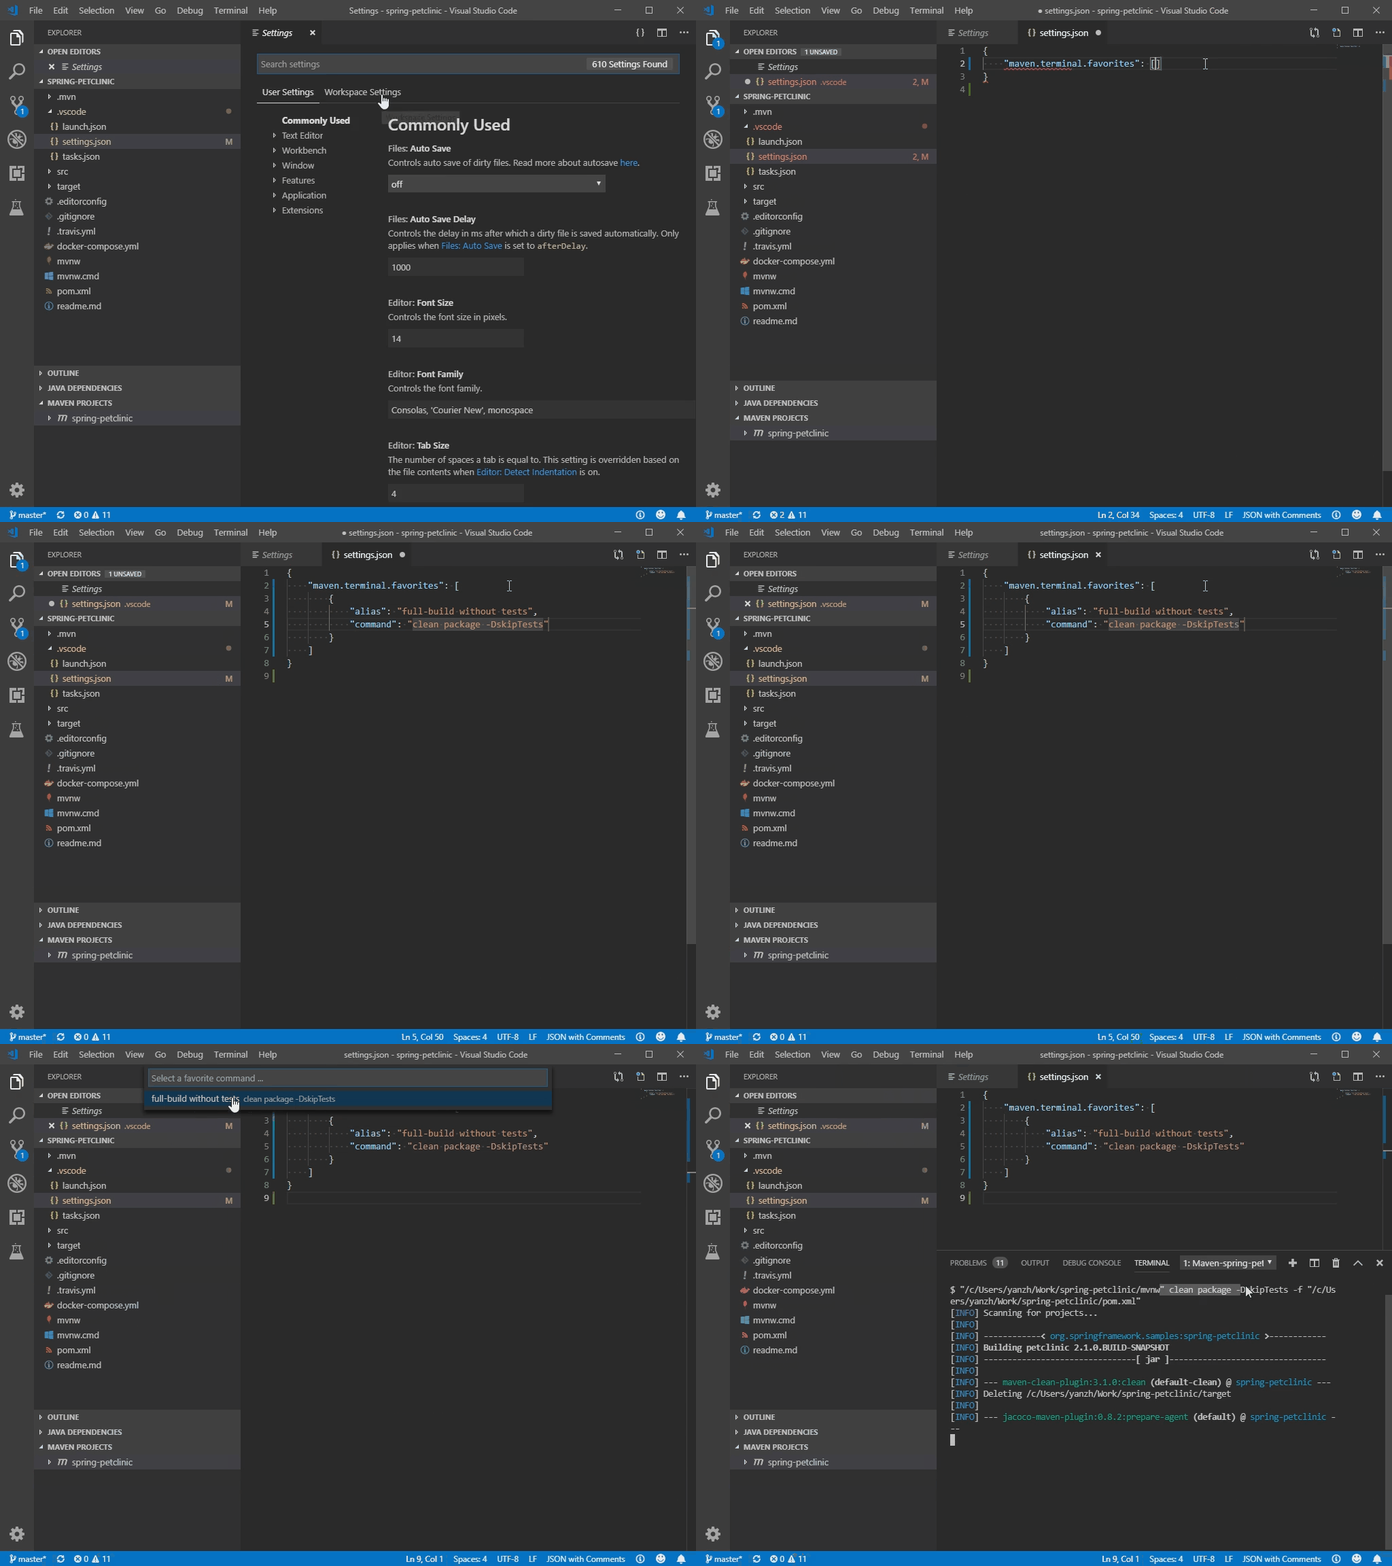
Now you are able to specify your favorite commands in settings for future execution.

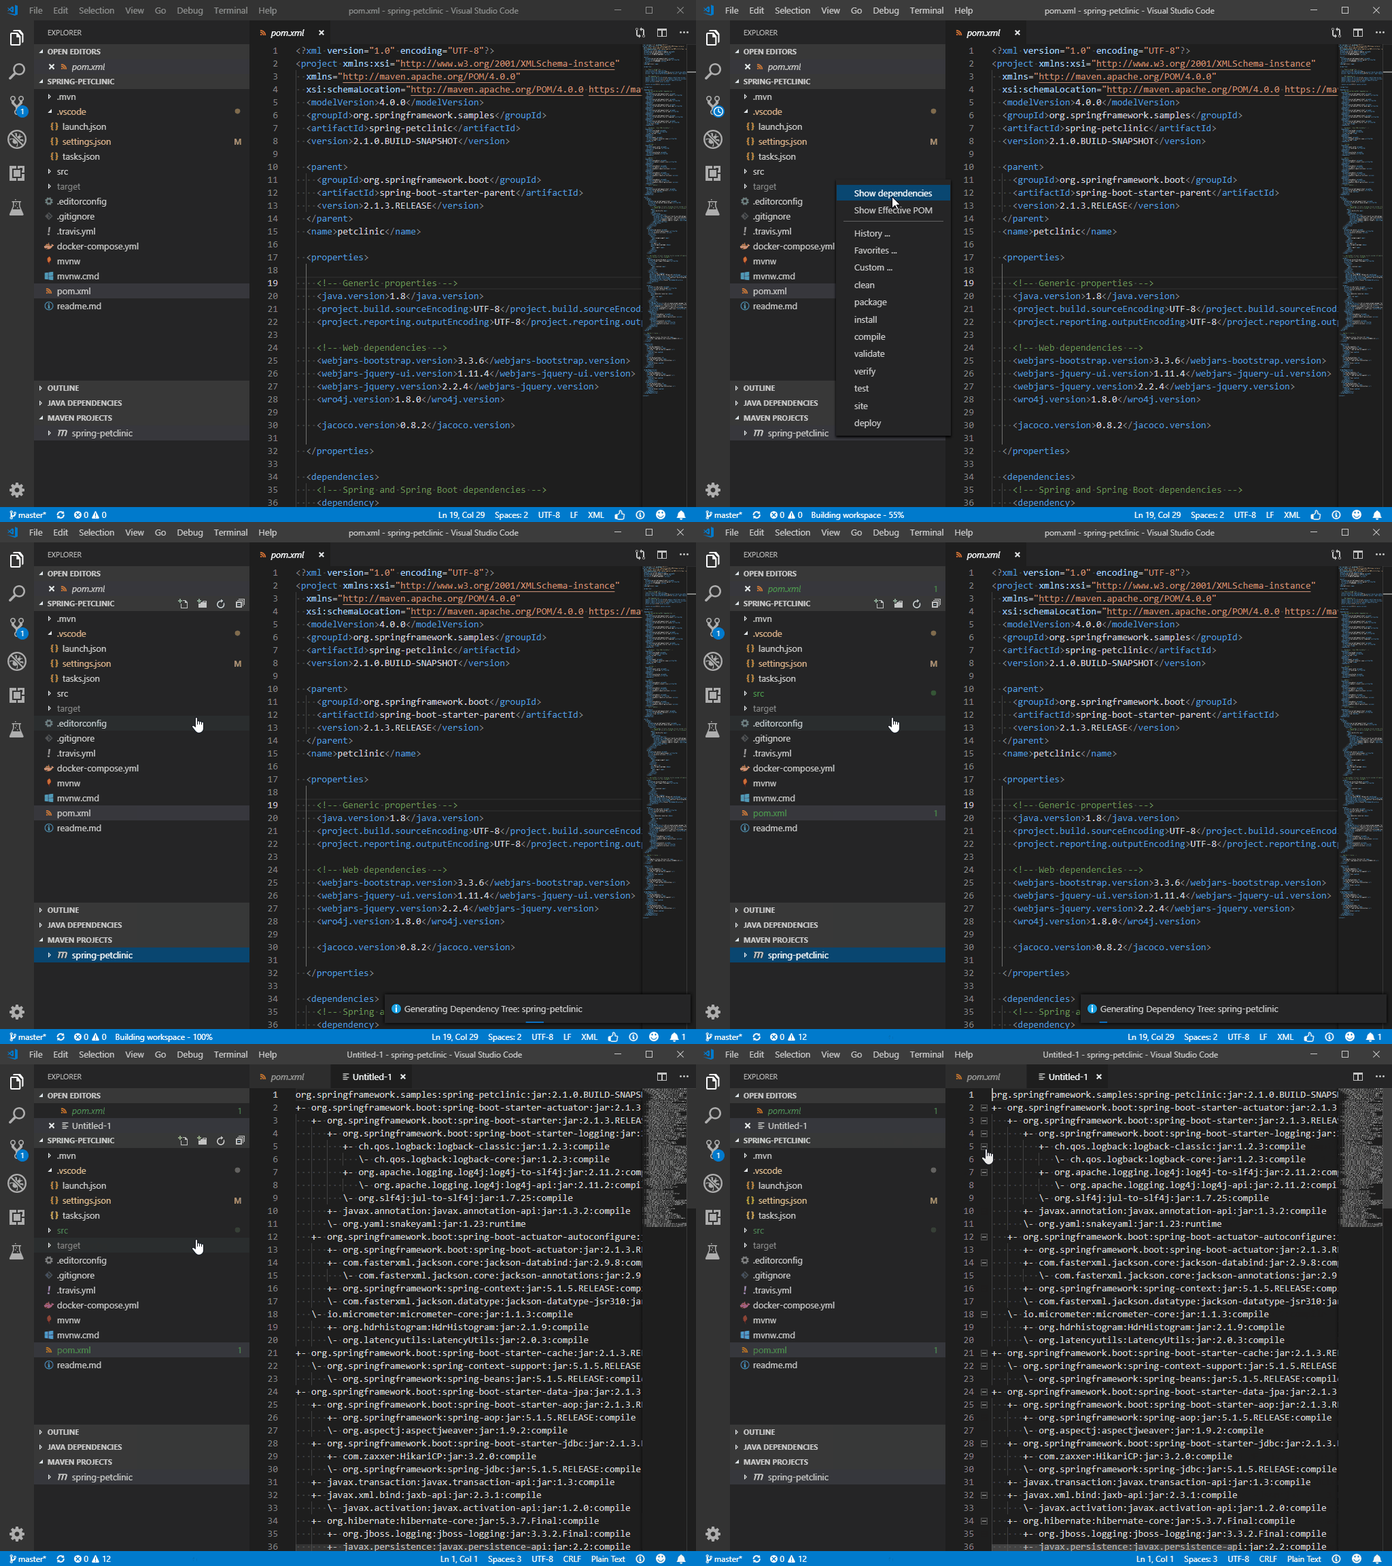
Show Dependency Tree

We also support showing dependencies in a tree view which allows you to inspect all dependencies in your project at a single place and check for potential issues.

One more thing. There’s one more shortcut to add dependencies. When editing a POM file, there is a shortcut command to search and add a dependency. Try Command Palette -> Maven: Add a dependency.

Sign up

If you’d like to follow the latest of Java on VS Code, please provide your email with us using the form below. We will send out updates and tips every couple weeks and invite you to test our unreleased feature and provide feedback early on.

Try it out

Please don’t hesitate to give it a try! Your feedback and suggestions are very important to us and will help shape our product in future. You may take this survey to share your thoughts!

Visual Studio Code is a fast and lightweight code editor with great Java support from many extensions

The post Java on Visual Studio Code April Update appeared first on The Visual Studio Blog.

Intelligent Productivity and Collaboration, from Anywhere

$
0
0

Developers today are encountering an overwhelming amount of complexity due to the growing emphasis on time-to-market, and a broader variety of technologies being used than ever before (e.g. polyglot apps, microservices). Additionally, teams are becoming more geographically distributed, which increases the need for efficient collaboration in order to maintain knowledge transfer within agile environments.

Over the past couple of years, we’ve spoken with thousands of developers, and learned that addressing these fundamental challenges required a new set of capabilities in your development tools and processes. As a result, our focus has been to significantly enhance individual productivity, improve team collaboration, and radically embrace workplace flexibility. To date, we’ve made a ton of progress (and are still iterating!) on the first two capabilities, thanks to feedback from the developer community:

  • Visual Studio IntelliCode helps enhance individual productivity by instilling intelligence into the IDE. It does this by making things like auto-completion smarter, based on an understanding of how APIs are used across thousands of open-source GitHub repositories.
  • Visual Studio Live Share facilitates real-time collaboration by enabling developers to edit and debug together, from the comfort of their favorite tools.
  • We also have a rich code navigation experience to improve asynchronous collaboration, and enable developers to deeply review PRs via multi-repo, cloud-based language services.

Today, we’re excited to share an early look of three new capabilities that are in private preview, and will enable developers to work from anywhere, and on any device, while virtually eliminating the amount of setup needed to start productively coding.


Remote-Powered Developer Tools

After we released Visual Studio Live Share, we immediately heard interest in an adjacent scenario: individual remote development. In fact, this had been the #1 feature request on GitHub for Visual Studio Live Share for over a year. Being able to develop against remote machines has numerous benefits, such as working on a different OS than the deployment target of your application, being able to leverage higher-end hardware, and having multi-machine portability. Today, many developers want to do remote development, but aren’t necessarily satisfied with the experience of using SSH + Vim or RDP/VNC.

Last week, the Visual Studio Code team released the Remote Development extensions (for Visual Studio Code Insiders) to enable connecting your local tools to a WSL, Docker container, or SSH environment, while retaining the full-fidelity, editing experience in Visual Studio Code (e.g. extensions, themes, debugging). Today, we’re excited to share an early look at Visual Studio Remote Development, which will enable Visual Studio users to achieve the same benefits, and go beyond the limits of their local dev machines. We’re starting with C# and C++, and look forward to working with the community to define the experience. Sign up for the private preview to get future updates.


Developing a C++ app without any local tools installed


Cloud-Hosted Development Environments

Having remote-capable tools unblocks a ton of developer scenarios, but on their own, they still require you to manually manage machines. We’ve heard loud-and-clear that developers are spending too much time setting up their developer environments, and that it can get in the way of onboarding new team members or enabling you to quickly move between tasks. To simplify this, we’re announcing the private preview of a capability that can provision fully-managed cloud-hosted development environments on-demand.

When you need to work on a new project, pick up a new task, or review a PR, you can simply spin up a cloud-based environment, and let the service take care of configuring it correctly. This allows you to spend more time coding, and little-to-no time installing dependencies. You can then connect to these environments using Visual Studio or Visual Studio Code (or both!) which ensures you can use the right tool for the job, and maximize your personal productivity, no matter where you are.


Creating a new cloud-hosted development environment directly within Visual Studio Code


Connecting to an existing environment and debugging it remotely


Browser-Based Web Companion

Developers are highly opinionated about their editor, and commonly spend countless hours customizing them. As a result, you’d want remote development and collaboration capabilities directly within your existing tools, where you spend the bulk of your time working. However, in some scenarios, it can actually be more convenient to perform a task in the browser, such as making a quick edit on-the-go, reviewing a PR, or joining a teammate’s Live Share session. To address this, we’re excited to share an early look at Visual Studio Online, a new web-based companion editor that compliments the Visual Studio family, and ensures you can work effectively from any device.

In the future, you will be able to navigate to https://online.visualstudio.com and access any of your remote environments. Because Visual Studio Online is based on Visual Studio Code, it will feel immediately familiar, and benefits from the rich ecosystem of extensions you already know and love – while supporting both the Visual Studio Code workspaces, as well as Visual Studio’s projects and solutions. Additionally, it will support IntelliCode and Live Share out-of-the-box, which ensures it provides the rich collaboration and productivity features developers need.


Editing a web application in the browser via Visual Studio Online


We Need Your Feedback!

We’re excited to share this progress, gather feedback, and learn how we can continue to improve team-based productivity moving forward. We believe that the combination of these experiences can address the needs of modern teams, and ensure you can achieve a high level of productivity, collaboration, and workplace flexibility. If you’re interested in getting your hands on early bits and chatting with our team, you can sign-up for the private preview here. We look forward to hearing from you and sharing more updates in the near future!

The post Intelligent Productivity and Collaboration, from Anywhere appeared first on The Visual Studio Blog.

Visual Studio 2019 for Mac version 8.1 Preview 1

$
0
0

Today, we are proud to announce the next major update for Visual Studio for Mac: Visual Studio 2019 for Mac version 8.1 PreviewIn this update, we are offering our new C# editor as the default experience in addition to introducing support for .NET Core 3 Preview and new project templates. We’ve also been working to improve performance and reliability across the board, based on feedback that we’ve heard from the Visual Studio for Mac community.  

You can install this update via the Updater inside Visual Studio for Mac by switching your channel from Stable to Preview. If at any time you would like to switch back to the Stable channel, you can do that via the Updater as well. We always welcome your feedback, so please make sure to share your thoughts with us via Developer Community or from the built-in Report a Problem tool in the IDE. 

A new default editor in VS for Mac: More speed, more reliability  

When we released Visual Studio 2019 for Mac in April, we offered an entirely new C# editor as an opt-in experienceWe wanted to ensure that the new editor meets our standards of performance and reliability before promoting it to the default editor within Visual Studio 2019 for Mac. Additionally, we wanted to ensure no major gaps existed in behavior or functionality between the legacy editor and the new editor. After a lot of testing and many conversations with our community, we believe the editor is now at a point where it can be the default experience.  

As the new editor shares all of its non-UI code with the editor in Visual Studio on Windows, we can now leverage the power of Visual Studio to provide a fast, fluent, and reliable experienceNumerous new features and capabilities were introduced in the new editor in Visual Studio 2019 for Mac, including: 

  • Improved typing responsiveness and scrolling speeds for a more fluid editing experience 
  • Modern editor features such as Multi-caret editing, Word Wrap, and Right-to-Left support 
  • Improved support for accented characters via macOS native input methods
  • An improved IntelliSense UI with faster performance 
  • New quick-action analyzers, shared with Visual Studio on Windows 

Visual Studio for Mac Editor

In this update, we have re-introduced many of your favorite and most requested features of the old editor, such as support for code snippets as well as various formatting and navigation tools, error highlights within the scrollbar and source control tabs. We have also made many improvements to the overall look and feel of the new editor, including refreshed tooltips and signature view adornments. Before we release the final version of Visual Studio 2019 for Mac 8.1, we also plan to add in-line lightbulbs adornments and Format Selection commands. 

Visual Studio for Mac - Editor Snippets

.NET Core 3 Preview Support

Visual Studio 2019 for Mac 8.1 now offers full support of the .NET Core 3 Preview SDK, which means you can get started with the latest and greatest that .NET Core has to offer! You can learn more about the new features and fixes offered in .NET Core 3 through the What’s New documentation.

To get started on using .NET Core 3 Preview within Visual Studio 2019 for Mac, you must first download and install the latest Preview SDK. To do this, download the macOS installer from the .NET Core Download page and run the installer to add .NET Core 3 support to your system.

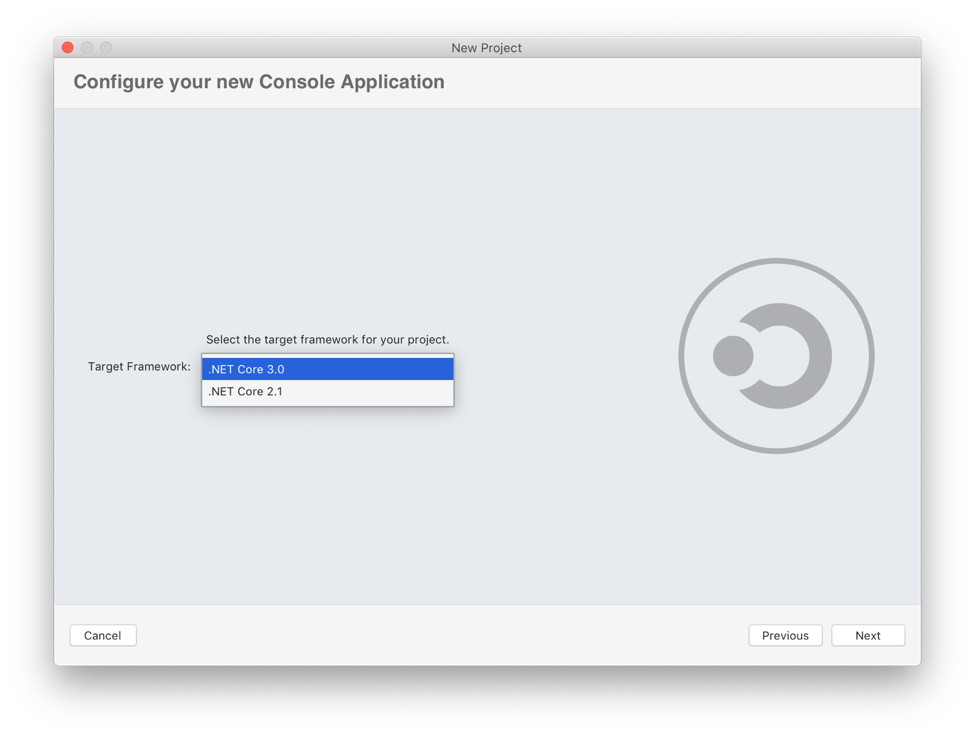
Once .NET Core 3 Preview is installed, you can create a new .NET Core 3 project simply by using the .NET Core template and selecting .NET Core 3 at the SDK Selection page.

.NET Core 3.0 Selection

As support for .NET Core 3 is still in preview, not all features are currently in place. One such example is support for C# 8, which will be available in a future update of Visual Studio 2019 for Mac.

New ASP.NET Core templates to help build complex web applications

When building web applications today, it’s common to work with a rich client-side JavaScript library like Angular or React. In this release, we’re including four new templates in Visual Studio for Mac, the same templates provided by the dotnet command line tool and Visual Studio on Windows:

These templates provide a starting point with a sample client-side application written using each of the technologies above. The application consumes data provided by an ASP.NET Core API backend. The project files generated by these templates are setup to build the TypeScript and JavaScript assets when you run your application, so that you can stay focused on building your app without leaving the IDE.

We’ve also added a new Razor Class Library template to make it easier to package and reuse your Razor views, pages, controllers, page models, view components, and data models. You can learn more about this in the ASP.NET Core Razor Pages documentation.

Performance and reliability

As we talk to our user community, one theme is clear: performance and reliability need to continue to improve. We have worked to ensure that each release is more reliable and better performing than the last. In this release, we have worked to optimize NuGet restore time, reduce the time it takes to load an existing project, resolved an issue where Visual Studio for Mac would hang on saving files when working with Unity projects, and improved the reliability of the new editor. We have also fixed several crashes and hangs, all of which can be reviewed in our Release Notes.

Please share your thoughts

We encourage you to download and try out the release today! Our aim is to make .NET development on macOS a breeze, and this release is our next step on this journey. Check out our recently updated product roadmap to see what we’re working on next and share your feedback and suggestions! We strive to be 100% driven by customer feedback and we love to hear from you.

The post Visual Studio 2019 for Mac version 8.1 Preview 1 appeared first on The Visual Studio Blog.

Visual Studio Container Tools Extension (Preview) Announcement

$
0
0

Today we’re excited to announce the preview availability of the new Visual Studio Container Tools Extension (Preview) for Visual Studio 2019. This is an important milestone in the iteration of our container tooling in Visual Studio, as we try to empower developers to work better with their containerized applications directly from within the IDE. The current Visual Studio Tools for Containers provide a great getting started experience for developers building new containerized applications, as well as capabilities to containerize an existing application. The extension tooling, available today, will provide developers additional functionality to help with building and diagnosing containerized applications from right within Visual Studio. 

Prerequisites 

To use the new extension, you’ll need to have the following installed: 

Installation 

You can easily acquire and install the new extension from the Visual Studio Marketplace. 

 Visual Studio Marketplace

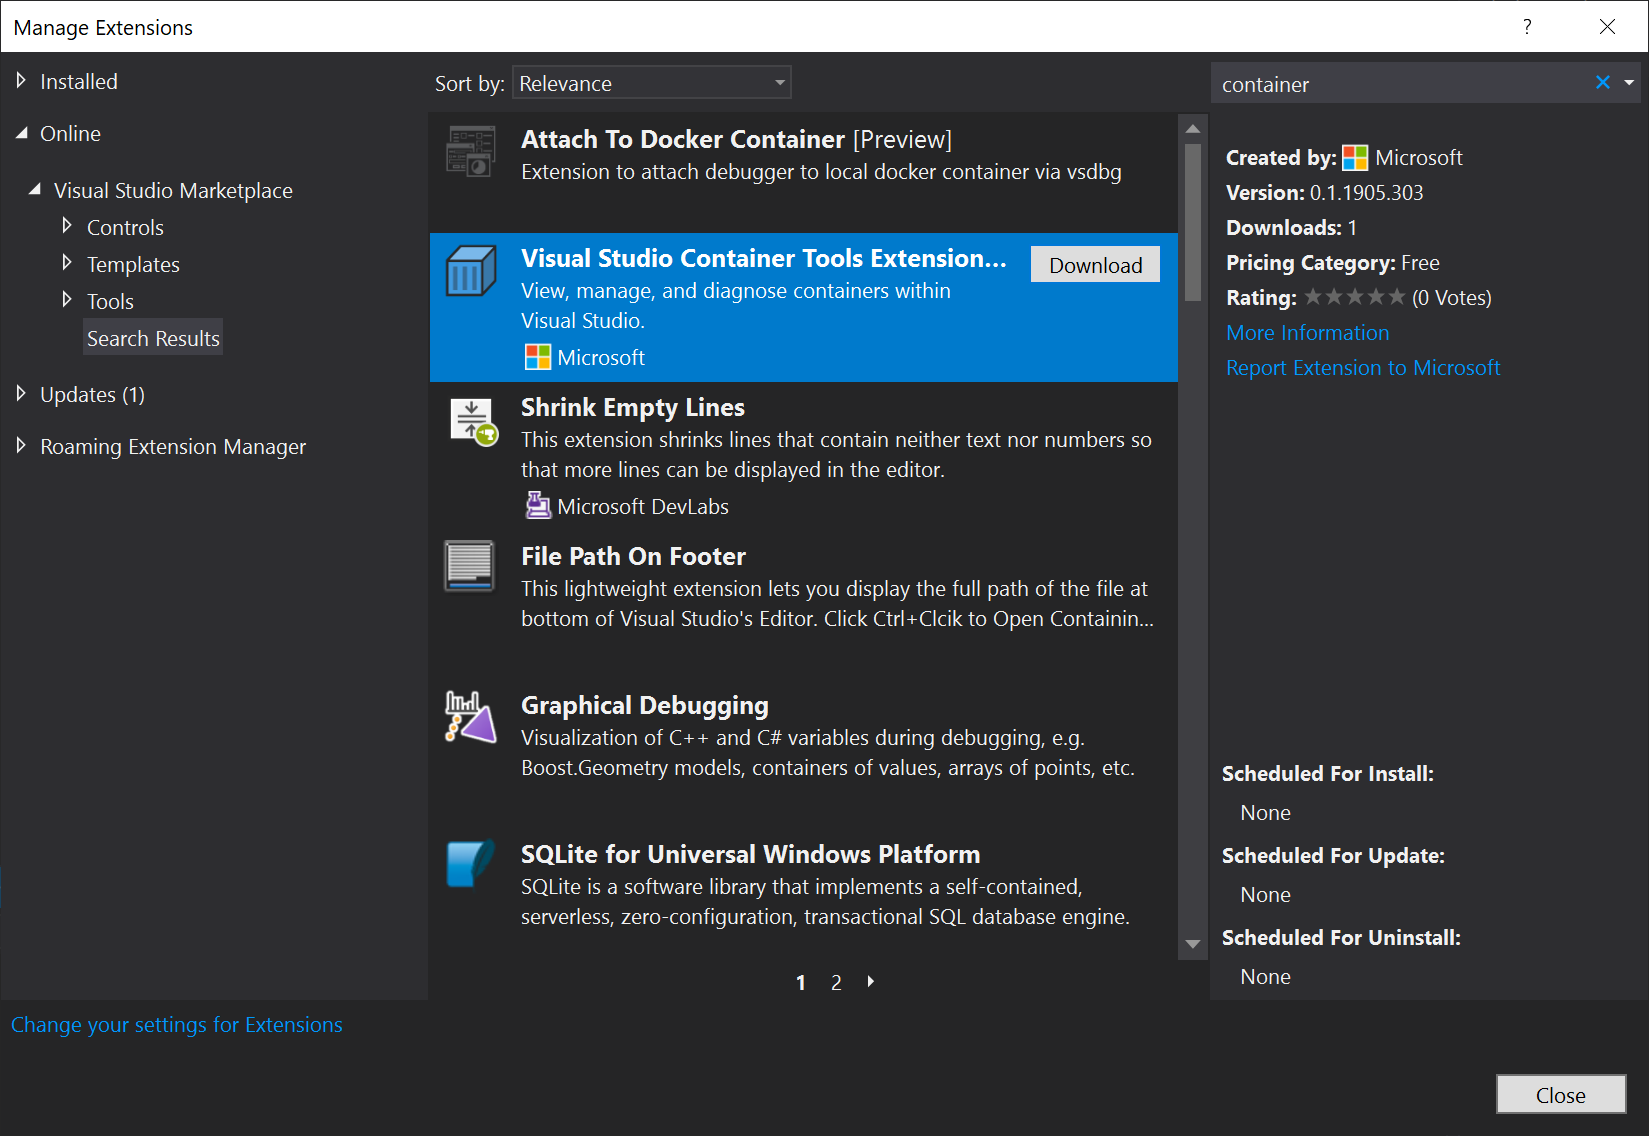
Alternatively, you can acquire the extension directly from within Visual Studio using the Extensions -> Manage Extensions menu option. On the Manage Extensions window, select Online from the left and then use the Search text box on the top right-hand corner to search for “Visual Studio Container Tools Extensions”. 

Install Container tools from Visual Studio

What is this new extension? 

The goal of the Container Tools window is to provide a GUI experience within Visual Studio 2019 to aid container developers in building and diagnosing their containerized applications. At a high level, the new tooling provides the following capabilities: 

  • Show a list of containers on your local machine 
  • StartStop, and Remove containers 
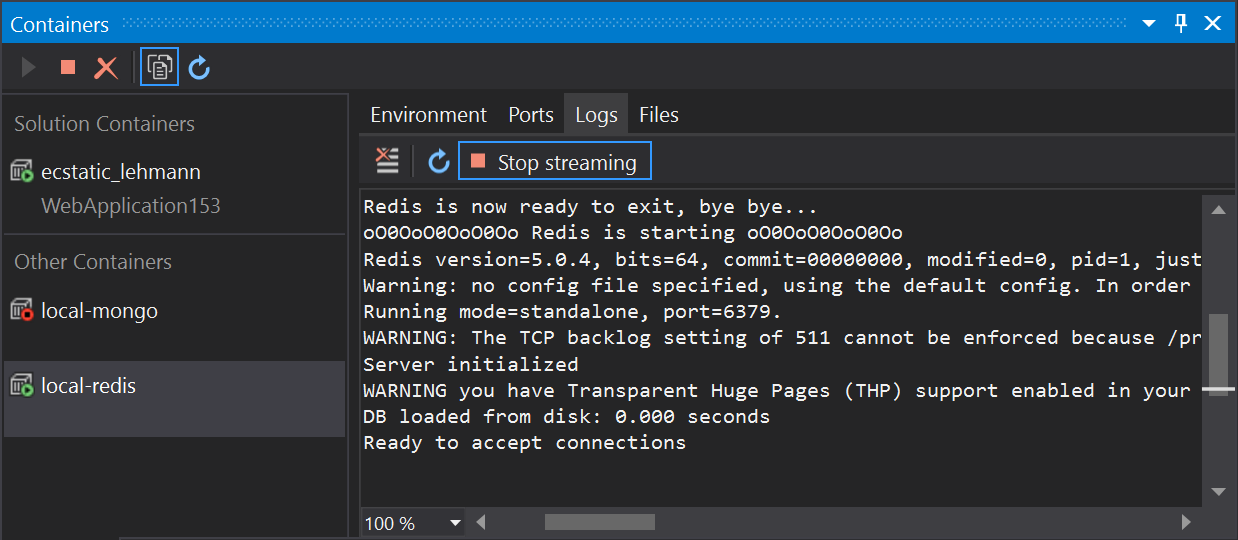
  • View containers log (stdout/stderr) – choose to stream logs or not 
  • Search log contents using the standard Visual Studio Find Dialog 
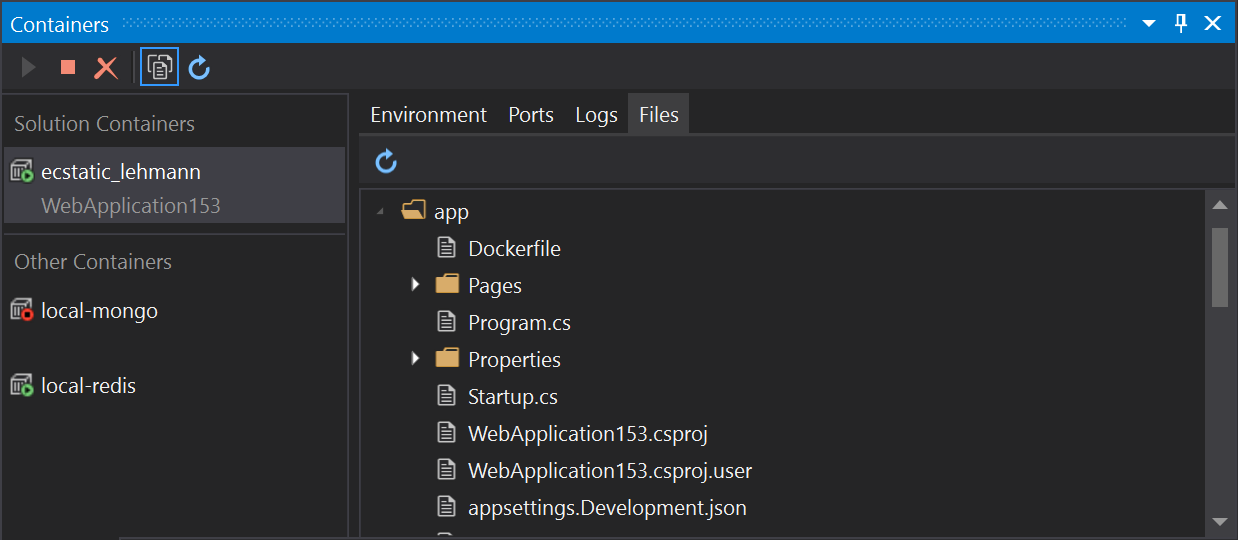
  • Show the folder & files in a running container 
  • Open files from a running container inside Visual Studio 
  • Inspect container port mappings and environment variables 

If you’re used to using the Docker CLI tool to interact with your containersthis window provides a more convenient way to monitor your containers in the IDE and helps you be more productive by not having to switch constantly between your IDE and separate command/terminal windows. 

Container filesystem in Visual Studio

Container Logs in Visual Studio

Note: Containers started (F5 and Ctrl+F5) from Visual Studio will not display logs in this tab, use the Output window instead. 

Please share your thoughts 

We are very excited about our new Container tooling extension and encourage you to download and try out it out today, whether you’re new to containers or an experienced docker developerYou can also check out the Visual Studio documentation for more details. 

Our goal is to make working with containers a great experience in Visual Studio 2019 and we have many other ideas for the Containers window we feel will help in building containerized applications. Wwant to hear from you, and we hope you can share your comments and suggestions on how we can make our tools work better for youDo this by opening a new issue at https://github.com/Microsoft/DockerTools/issues.  

The post Visual Studio Container Tools Extension (Preview) Announcement appeared first on The Visual Studio Blog.

Announcing the general availability of IntelliCode plus a sneak peek

$
0
0

We’re excited to announce the general availability of Visual Studio IntelliCode and offer a sneak peek at an up-and-coming feature we think you’ll love! With the release of Visual Studio 2019 Version 16.1, IntelliCode will be included with any workload supporting C#, C++, TypeScript/JavaScript, and XAML. However, only the C# and XAML models are currently generally available. C++ and TypeScript/JavaScript remain in preview at this time. We’ve learned so much from all of you in during our year in public preview and are thrilled for this next step. 

If you haven’t heard of IntelliCode,  it’s a set of AI-assisted capabilities that aims to improve developer productivity with features like contextual IntelliSense, code formatting and style rule inference. 

General Availability with Preview Perks 

IntelliCode is growing fast so we’ve also packed in some preview features you can try out if you’d like, no extra installations required. Preview features, such as such as C++ and TypeScript/JavaScript support and argument completion, will be disabled by default but you can easily enable any preview features via Tools > Options > IntelliCode. Check out our updated docs for a full list of preview features. 

A Quick PEEK: finding repeated edits 

Have you ever found yourself making a repeated edit in your code, for instance when you’re refactoring to introduce a new helper function? You might consider creating a regular expression search to find all the places in your code where the change is required – but that seems like a lot of work, so you resign yourself to the tedious and error prone task of going through the code manually. What if an algorithm could track your edits (locally of course), and learn when you were doing something repetitive like that after only a couple of examples? Repeated edit detection does just that, and suggests other places where you need that same change:

This feature is under development right now, and we’re looking to make it available in a future release of IntelliCode.  

Want to hear about new preview features like this first? Sign up to receive regular updates! 

Let us know what you think! 

IntelliCode has benefitted greatly from all the customer feedback we’ve received in the past year and we hope you’ll help us continue to improve by letting us know how IntelliCode is working for you! Feel free to let us know what you’d like to see next by filing feature requests or reporting issues via Developer Community. 

The post Announcing the general availability of IntelliCode plus a sneak peek appeared first on The Visual Studio Blog.


Visual Studio 2019 version 16.1 Preview 3

$
0
0

The third Preview version of Visual Studio 2019 version 16.1 is now available. You can download it from VisualStudio.com. Or, if you’re already on the Preview channel, just click the notification bell from inside your Visual Studio 2019 Preview installation to update. This latest preview contains a range of additions, including IntelliCode support by default, various C++ productivity enhancements, and .NET tooling updates. We’ve highlighted some notable features below, and you can see a list of all the changes in the Preview release notes.

IntelliCode

Today, at Build 2019, we announced the general availability of IntelliCode, which gives you contextual IntelliSense recommendations powered by a machine learning model trained on thousands of open source repositories. IntelliCode now comes installed by default with any workloads that support C#, C++, TypeScript/JavaScript, or XAML.

AI-assisted IntelliSense recommendations in Visual Studio

C# and XAML base models are enabled by default while preview features such as C++, TypeScript/JavaScript, and C# custom model support must be enabled using Tools > Options > IntelliCode. Check out our restructured docs to learn more.

C++

In Preview 3, you are now able to use your local Windows Subsystem for Linux (WSL) installation with C++ natively in Visual Studio without additional configuration or any SSH connections. In addition, AddressSanitizer is integrated directly into Visual Studio for WSL and Linux projects.

This release also provides the ability to separate your remote build machine from your remote debug machine in both MSBuild and CMake projects. Learn more about the new Linux features in the Visual Studio 2019 version 16.1 Preview 3 Linux roll-up post.

AddressSanitizer integration into Visual Studio

Quick Info tooltips, which appear when hovering over a method name, now offer you a link that will search for online docs to learn more about the relevant code construct. For red-squiggled code, the link provided by Quick Info will search for the error online. You will now also see colorized code in these tooltips to reflect their colorization in the editor. Learn more about quick info tooltip improvements in Preview 3 in the quick info improvements post on the C++ Team Blog.

Colorized code and Search Online functionality in Quick Info tooltips

Two new C++ Code Analysis quick fixes are available: C6001: using uninitialized memory <variable> and C26494 VAR_USE_BEFORE_INIT. These quick fixes are available via the lightbulb menu on relevant lines and enabled by default in the Microsoft Native Minimum ruleset and C++ Core Check Type rulesets, respectively.

New Code Analysis quick fixes
 

.NET Tooling

You can now experience experimental IntelliSense completion for unimported types. IntelliSense suggestions for types in dependencies will be provided in your project even if you have not yet added the import statement to your file. You can toggle this option on/off by navigating to Tools > Options > Text Editor > C# > IntelliSense.

IntelliSense completion for unimported types

You can now use a new EditorConfig code style rule to require or prevent using directives inside a namespace. This setting will also be exported when you use the “Generate .editorconfig” button located in Tools > Options > Text Editor > C# > Code Style.

New Editorconfig rule for requiring or preventing usings inside namespaces
 

Tools option to prefer usings inside or outside of namespaces
 

Use the latest features; give us feedback

To try out this preview of the latest features, update to Visual Studio 2019 version 16.1 Preview 3 online, via the notification bell inside Visual Studio, or by using the Visual Studio Installer.

We continue to value your feedback. As always, let us know of any issues you run into by using the Report a Problem tool in Visual Studio. You can also head over to Visual Studio Developer Community to track your issues, suggest a feature, ask questions, and find answers from others. We use your feedback to continue to improve Visual Studio 2019, so thank you again on behalf of our entire team.

The post Visual Studio 2019 version 16.1 Preview 3 appeared first on The Visual Studio Blog.

Build Visual Studio extensions using Visual Studio extensions

$
0
0

What if the community of extension authors banded together to add powerful features to Visual Studio that made it easier to create extensions? What if those features could be delivered in individually released extensions, but joined by a single installation experience that allows the user to choose which of the features to install? That’s the idea behind Extensibility Essentials – an extension pack that ships community-recommended extensions for extension authors.

Extension authors are usually interested in improving their own tooling in Visual Studio – either by installing extensions created by others or by building some themselves. By banding together, we can create the best and most comprehensive tooling experience for extension authoring. So, let’s test that theory by creating a range of extensions published to the Marketplace under our own accounts, and reference them in Extensibility Essentials to provide a unified and simple installation experience.

The individual extensions can and probably should be single purpose in nature. This prevents feature-creep where additional features are added that may or may not be useful for extension authors. If additional features are not closely related to the extension, then simply create a new extension for them. That way it is up to the individual extension author to decide if they wish to install it. It is also crucial that the extensions follow all the best practices.

Once the individual extension is stable, it can be added to Extensibility Essentials.

The extension pack Extensibility Essentials doesn’t do anything by itself. It is a barebone extension pack that just references the individual extensions. When installing the extension pack, the user can choose which of the referenced extensions to install. At the time of this writing, there are 9 individual extensions.

How the individual extensions are listed before installing

Ideas for new extensions can be centralized to the GitHub issue tracker. By collecting ideas in a central location, it provides a single location to comment on and potentially design features ahead of implementation.

The issue tracker is for both bugs and suggested features

It would be cool if…

So next time you’re sitting in Visual Studio working on an extension, think about what feature you’d like that would make you more productive. If you can’t think of a feature, but feel there is a scenario that is particularly problematic, then open a bug on the GitHub issue tracker and let other people try to figure out how an extension could perhaps solve the issue.

Thinking “it would be cool if…” is the first step to make it possible and with the Extensibility Essentials, it might be closer to becoming reality than imagined.

Does this idea resonate with you? Let me know in the comments.

Mads Kristensen, Senior Program Manager
@mkristensen

Mads Kristensen is a senior program manager on the Visual Studio Extensibility team. He is passionate about extension authoring, and over the years, he’s written some of the most popular ones with millions of downloads.

Q# – a Wish List for the New Year

$
0
0

In previous blog posts you have read about some of the ideas behind Q#, how it came into existence, and its development over the past year. You have read about quantum computing, quantum algorithms and what you can do with Q# today. With the end of the year approaching, there is only one more thing to cover: What is next?

This blog post is about our aspirations for the future and how you can help to accomplish them. It contains some of our visions going forward, and we would love to hear your thoughts in the comment section below.

Community

One of the most exciting things about Q# for us is the growing community around it. Being rooted in the principles of quantum mechanics, quantum computing tends to have this air of unapproachability to the “uninitiated”. However, quantum computing builds on the notion of an idealized quantum system that behaves according to a handful of fairly easy to learn principles. With a little bit of acquired background in linear algebra, some persistence, and patience when wrapping your head around how measurements work it is possible to get knee-deep into quantum algorithms reasonably quickly!

Of course, a couple of good blog posts on some of these principles can help. We strive to actively support you in the adventure of exploring quantum algorithms by providing materials that help you get started, like our growing set of quantum katas. Our arsenal of open source libraries provides a large variety of building blocks to use in your quest of harnessing the power of quantum. One of the main benefits of open source projects is being able to share your work with all the people brave enough to explore the possibilities that quantum has to offer. Share your progress and help others build on your achievements! Whether in kata or library form, we welcome contributions of any size to our repositories. Let us know how we can help to make contributing easier.

Exchange among developers is one of the most important aspects of software development. It is omnipresent and vital to building a sustainable environment around a particular toolchain and topic. Thankfully, modern technology has made that exchange a lot easier than when the first computer programmers started their careers. We intend to make full use of the power of the internet and give a voice and a platform for discussions on topics related to Q# and quantum computing to developers around the world. The Q# dev blog is part of this effort. Contact us or comment below if you have an idea for a blog post or would like to hear more about a specific topic related to Q#. Establishing good feedback channels is always a challenging endeavor and in particular for a small team like ours. We would like this place to become a source of knowledge and exchange, a place where you can find the latest news and voice your take on them.

Growth

This brings us back to our plans for Q#. We have built Q# to make quantum development easier and more accessible. Of course, there were also a couple of other considerations that have played into that decision. For instance, we are anticipating the need to automate what is largely done in manual labor today, e.g. qubit layout and gate synthesis that are often still done on a case-by-case basis for each program and targeted hardware. When is the last time you worried about how error correction works on the hardware your code gets executed on? With qubits being an extremely scarce resource, and the long-term ambition to use quantum computing to address the most computationally intensive tasks that cannot be tackled with current hardware, the optimization of large-scale quantum programs needs to be a priority. We chose to develop our own language in order to have full control and flexibility over what information is represented how, and when it is used during compilation in order to be able to support a modular and scalable software architecture for executing quantum programs. But that’s a tale for another time. What is important is that these considerations are key factors in how we design and develop the language going forward.

A programming language is more than just a convenient set of tools for expressing an algorithm. It shapes the way that we think and reason about a problem, how we structure it and break it down into tasks when building a solution. A programming language can have a tremendous impact on our understanding of existing approaches, as well as how to adapt and combine them for our purposes. Particularly so when venturing into new territory.

Our goal is therefore to build a shared understanding of what it is we strive to accomplish, and to evolve Q# into the powerful language needed to drive progress in quantum programming. Our goal is to leverage the expertise of a community of language designers, compiler veterans, quantum physicists, algorithms and hardware experts, and a variety of software developers to shape a new kind of computing architecture. And we want you to be part of it.

Transparency

Since our 0.3 release at the beginning of November we have been eagerly working on not just the next release, but on defining and preparing the next steps in 2019. While we are in the middle of formulating our plans for the future, I want to give you a brief insight into some of our considerations.

As I am sure you have noticed, the support for data structures in Q# is minimal. While we do provide quite a few high-level language features for abstracting classical and quantum control flow, we intentionally omit some of the more object-oriented mechanisms such as classes. We anticipate remaining heavily focused on transformations that modify the quantum state, expressed as operations in Q#, as well as their characteristics and relations in the future. However, basic bundling of data and manipulations of such is of course an important aspect of many programs and we want to provide suitable mechanisms to express these in a way that allows to make abstractions, is convenient, and is resistant to coding errors. User defined types in the current setting have limited power besides an increased type safety. The “black box approach” to type parameterization currently restricts their usefulness; we do not provide a mechanism for dynamic reflection and it is not possible to apply operators or other type specific functionalities to argument items whose type is resolved for each call individually. In that sense, these items are “black boxes” that can merely be passed around. We want to do as much of the heavy lifting as possible statically in particular since debuggability of quantum devices is a huge challenge. There are several mechanisms one might consider alleviating the consequences of these decisions. On one hand, type constraints are a common mechanism used in several popular languages. In a sense, they can be seen as “specializations based on the properties of a type”. One could also pursue the stricter path of specializing based on the concrete type itself, de-facto adding a form of overloading that we currently explicitly prevent from being used. Either way, by clearly separating user defined types from tuples in the type system we have made a first step towards extending their power.

If you are curious to hear more about possible ideas for Q#, their benefits and caveats, or want to share some thoughts of your own, comment below! Contribute to the discussion and post your speculations to the question: What makes a quantum programming language “quantum”, i.e. what makes it particularly suited for quantum computing?

Join us

I hope you join us into a new year of pushing the boundaries of computation by participating in our coding competitions, contributing to our open source repositories, commenting on or writing blog posts and sharing your ideas and experiences!

How about a new year’s resolution of your own? Let us know what you expect to accomplish and how we can help you achieve your new year’s resolution around quantum programming in Q#!

Bettina Heim, Senior SDE, Quantum Software and Application
@beheim
Bettina Heim is a quantum physicist and software engineer working in the Quantum Architectures and Computation Group at Microsoft Research. She is responsible for the Q# compiler and part of the Q# language design team. Prior to joining Microsoft she worked on quantum algorithms, adiabatic quantum computing, discrete optimization problems, and the simulation and benchmarking of quantum computing devices.

Build an Azure IoT application with Cloud Explorer for Visual Studio

$
0
0

What we’ve heard and experienced ourselves is that when building applications, you have a frictionless experience when your code editor and tools are integrated and seamless. Yet when developing IoT apps, you often need to manage connected devices and send test messages between the device and IoT Hub at the same time that you’re debugging and working on your code. You’ll likely spend time switching between windows or even screens to monitor the messaging and many components of your development.

To ensure that the tools you need are close at hand, we’ve updated the Cloud Explorer for Visual Studio extension for IoT developers to enable you to view your Azure IoT Hubs, inspect their properties, and perform other actions from within Visual Studio. Cloud Explorer is installed by default if you selected the Azure Workload when installing Visual Studio. To access the latest features, you need to upgrade to Microsoft Visual Studio 2017 Update 9 or later, then download and install the latest extension from Visual Studio marketplace.

Here are some of the new features to help IoT developers easily interact with Azure IoT Hub, and the devices connected to it:

  • Interact with Azure IoT Hub
    • Send D2C messages to IoT Hub
    • Monitor D2C messages sent to IoT Hub
    • Send C2D messages to device
    • Monitor C2D messages sent to device
    • Invoke Direct Method
    • View and update device twin
  • Device management
    • List devices
    • Get device info
    • Create and delete devices
  • IoT Edge development support
    • Create IoT Edge deployment for device
    • List modules
    • View and update module twin

To learn more about what the IoT Hub enables and how to use the latest, check out the IoT Hub documentation.

Easy to Set Up

After you’ve installed Cloud Explorer, you can open Cloud Explorer view from Visual Studio menu View → Cloud Explorer. Sign in to your Azure account by clicking the Account Management icon if you haven’t done this before.

Expand Your subscription → IoT Hubs → Your IoT Hub, the device list will be shown under your IoT Hub node. Select one IoT Hub or device to inspect its properties or perform actions against the resource.

Now you have learned how to access your Azure IoT Hub resources.

Try the Tutorials

If you want to discover the Cloud Explorer features further, we offer the following walkthroughs where you will perform common IoT Hub management actions. To explore advanced or specific IoT scenarios, head over to check out our IoT Hub documentation, where we’re always adding new projects and tutorials.

Your feedback is also very important for us to keep improving and making it even easier to develop your IoT applications. Please share your thoughts with us by suggesting a feature or reporting an issue in our Developer Community

Chaoyi Yuan, Software Engineer

Chaoyi is a software engineer working on IoT tools. He’s currently focus on providing great tools for Visual Studio and Visual Studio Code users.

Visual Studio 2019 Preview 2 is now available

$
0
0

The second preview of Visual Studio 2019 is now available for download. This release contains a number of improvements and additions to the core experience and different development areas, many of which are a result of your direct feedback. As always, you can check out the release notes for more details or read on for the highlights.

Core IDE experience

Visual Studio 2019 will automatically download updates in the background while your computer is idle. This means you can continue using Visual Studio 2019 until it’s time to install. And, you will only need to wait for the actual installation of the update. The default will be set to “Download all, then install”, and you can modify this by going to Tools > Options > Environment > Product Updates.

In Preview 1, we introduced a new Per-Monitor Awareness (PMA) preview feature that is now enabled by default for users that meet the system requirements of .NET Framework 4.8 and Windows 10 April 2018 Update. Alongside the core IDE, multiple tool windows such as Toolbox, Breakpoints, Watch, Locals, Autos, and Call Stack should now render sharply across monitors with different display and scale configurations.

Search capabilities have improved in two places: the start window and inside the IDE. In the start window, you can now search for project templates by language, platform, and tags via the search box. Preview 2 introduces filters for menus, components, and templates during search in the IDE, as well as the capability to create and add new projects and items directly from the search box.

Based on your feedback, the new blue theme in Visual Studio 2019 has been updated by dialing down luminosity and increasing contrast. The draggable region has been improved as well by making the toolbar region also draggable. As a result, dragging the Visual Studio 2019 window should now be more natural.

The document health feature that was introduced with Preview 1 has been given a visual upgrade in Preview 2. Now, at a glance, you can see how many errors or warnings your document has, and clicking the control will bring up the error list. Code cleanup, which was introduced in Preview 1, has also been given its own control to quickly access the code cleanup features.

C++ development

C++ developers will notice quite a few improvements in this release. Check out the release notes for the full list, but here are some of the highlights:

  • You now have access to a fresh version of the MSVC compiler and to libraries that:
    • Bring you guaranteed binary compatibility with Visual Studio 2017 MSVC toolset and runtime
    • Add initial support for C++ 20 standards (specifically the “spaceship” operator i.e. <=> under /std:latest),
    • Enable OpenMP 4 SIMD vectorization as well as many codegen improvements for better runtime performance and build throughput, including a new compiler switch -Ob3 that provides more aggressive inlining
    • Provide new Code Analysis checks including the new Lifetime profile checker.

Plus, you can try out the latest C++ productivity improvements, including the newly-enhanced C++ Template IntelliSense, NULL->nullptr refactoring, quick fixes for missing #include and using namespace declaration, missing semicolons, and more.

C# development

Visual Studio 2019 Preview 2 adds a couple more new C# 8.0 language features on top of the ones that shipped in Preview 1 (Take C# 8.0 for a spin). Most notably, C# 8.0 pattern matching now allows recursive patterns, which can dig into the structure of an object, and switch expressions, which are a lightweight expression version of switch statements. To learn more, check out Do more with patterns in C# 8.0 on the .NET Blog.

F# development

A preview of the F# 4.6 language is now available in Visual Studio 2019 Preview 2. You can learn more about the language changes in the F# 4.6 Preview blog post. Additionally, we’ve revamped how the F# language service is initialized by Roslyn, which should result in a consistently faster solution load time for larger solutions.

.NET development

Visual Studio 2019 Preview 2 brings a range of new refactoring and codefix capabilities, such as sync namespace and folder name, pull members up, invert conditional expressions/logical operations, and many more. We’re also gradually rolling out new classification colors which are similar to Visual Studio Code. You can control these via Tools > Options > Environment > Preview Features.

Starting with this release, we are making project files for .NET SDK-style projects a first-class file type in Visual Studio and are supporting things like double-clicking a project node to open the project file and finding a project by name with Go To All (Ctrl + T). Additionally, .NET SDK-style projects will now use the new Integrated Console experience for F5 and Ctrl + F5 on console apps.

Code cleanup also now enables you to save collections of fixers as a profile. Now, if you wanted to apply a small set of targeted fixers frequently while you code and have another more comprehensive set of fixers to apply before preparing for a code review, you can configure profiles to address these different tasks.

Python development

You can now switch between different Python interpreters using the new Python Environments toolbar when editing Python files or working with projects or Open Folder workspaces.   Miniconda is available as an optional component during installation so you don’t have to separately install it to create conda environments. Additionally, you can now create Visual Studio Live Share sessions for collaboration on Python code. Check out the Python in Visual Studio 2019 Preview 2 blog post for more details.

Web and container development

If you’re developing with Node.js, you will find JavaScript debugging support for unit tests in this release. If ASP.NET is more your style, you will find that when publishing your application to Azure App Service, you can associate Azure Store and Azure SQL resources with your app as dependencies.

If you’re using containers, Visual Studio 2019 Preview 2 now supports debugging ASP.NET Core applications that use Alpine as a base image. There’s also support for the latest ASP.NET and .NET Core images.

Visual Studio Kubernetes Tools are now integrated in the Azure development workload for easy installation. This will add the Container Application for the Kubernetes project template to Visual Studio, which will automatically create a Dockerfile and Helm chart that you can use. This also enables you to add support for Kubernetes to an existing ASP.NET Core application by right-clicking the project and selecting Add > Container Orchestrator Support. After adding Kubernetes support, you can build, run, and debug your application in a live Azure Kubernetes Service (AKS) cluster with Azure Dev Spaces.

Mobile .NET development

For .NET developers using Xamarin to build mobile apps, Visual Studio 2019 Preview 2 has improved build performance if you use Xamarin.Android 9.1.1 or higher. Xamarin.Android now also supports the latest Android dex compiler (d8) and code shrinker (r8). The Android designer now natively supports Android Pie (9.0) and will show you improved status when loading. You can also use Go-To-Definition (Ctrl + Click) on resource URLs to navigate to the file or line where they are defined.

A new property panel has been added for Xamarin.Forms developers, enabling you to edit common attributes for controls. The Xamarin.Forms templates now use the latest Xamarin.Forms 4.0 release and include a new Xamarin.Forms Shell app that aims to reduce the complexity of a multi-platform app solution.

Last, but not least, load performance for new projects has been improved dramatically, showing performance gains of up to 50% in certain cases. When building apps, you can now also see more detailed build progress information by clicking the background tasks icon in the bottom left of the IDE.

Get started; share feedback

You can download Visual Studio 2019 Preview 2 here or update using the Visual Studio Installer. If you want to give it a spin without installing it, check out the Visual Studio images on Azure. Let us know of any issues you run into by using the Report a Problem tool in Visual Studio. You can also head over to the Visual Studio Developer Community to track your issues, suggest a feature, ask questions, and find answers from others. We use your feedback to continue to improve Visual Studio 2019, so thank you again on behalf of our entire team.

Angel Zhou Program Manager, Visual Studio

Angel Zhou is a program manager on the Visual Studio release engineering team, which is responsible for making Visual Studio releases available to our customers around the world.

Viewing all 1039 articles
Browse latest View live


<script src="https://jsc.adskeeper.com/r/s/rssing.com.1596347.js" async> </script>