Quantcast
Channel: Visual Studio Blog
Viewing all 1039 articles
Browse latest View live

Going all in on ‘Suggest a Feature’ in Visual Studio Developer Community

$
0
0

In October 2018, we announced that the Developer Community site we have used for reporting issues will work for feature requests in one convenient place. We also shared the plan to migrate from UserVoice forum to Developer Community. Since then, we have received and responded to over 2500 new feature suggestions on Developer Community with hundreds of those shipped in Visual Studio. Thank you for making the move and continuing to help us improve the functionality in Visual Studio! Now that feature suggestions are fully up and running on Developer Community, we have taken the final step of the move by turning off the UserVoice forum. If you have an idea or a request for a feature, you can now use the Suggest a Feature in Developer Community site or Visual Studio (as shown below) and make your suggestions.

Developer Community

Visual Studio

You can also browse suggestions from other developers and Vote for your favorite features to help us understand the impact to the community.

Thank you! We are looking forward to hearing your suggestions.  We also encourage you to learn more about suggestions to get the best out of it.  Thank you for the valuable feedback you provide in Visual Studio and your participation in Developer Community!

The post Going all in on ‘Suggest a Feature’ in Visual Studio Developer Community appeared first on The Visual Studio Blog.


Customize object displays in the Visual Studio debugger YOUR way

$
0
0

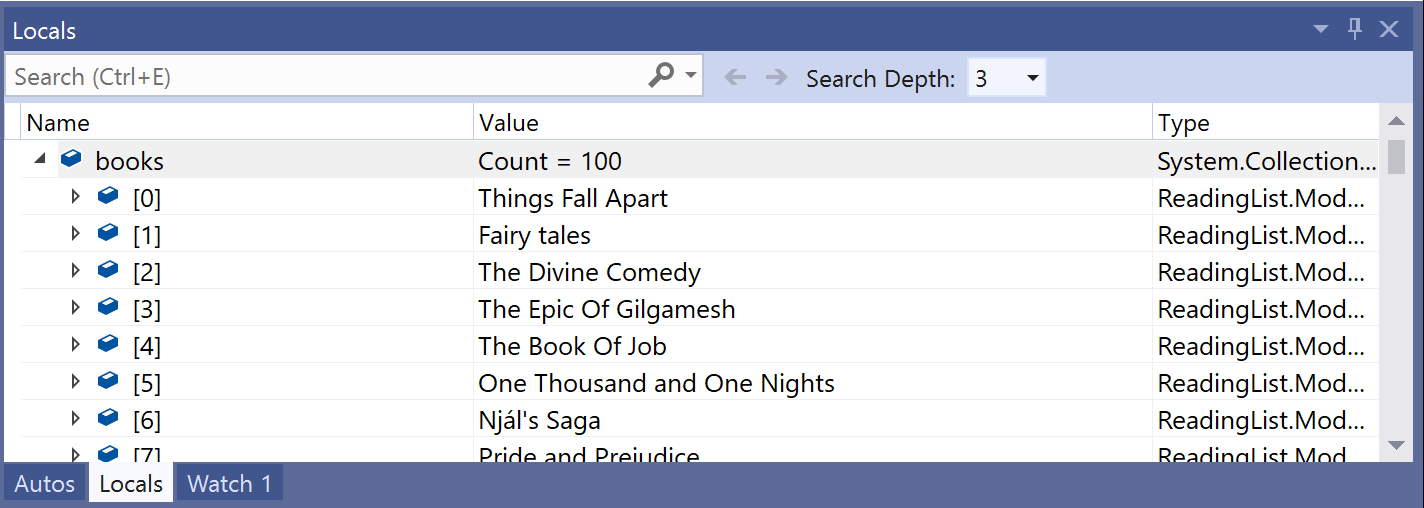
Have you ever stared at objects in a debugger window and wished that you could view those objects by something other than their type?  I certainly have!  Expanding items to determine each one’s identity can become tiresome very fast. Ideally, it would be great to quickly locate them by a particular property value.  Luckily for us, Visual Studio has two not-so-well-known attributes known as DebuggerDisplay for managed users, and Natvis for native C++ users. These attributes let you customize how you view objects in debugger windows such as the Watch, Autos, Locals, and datatips!

Locals and DataTips windows with and without DebuggerDisplay attribute appended to code
Figure 1 – Locals and DataTips windows with and without DebuggerDisplay attribute appended to code

What is the DebuggerDisplay attribute?

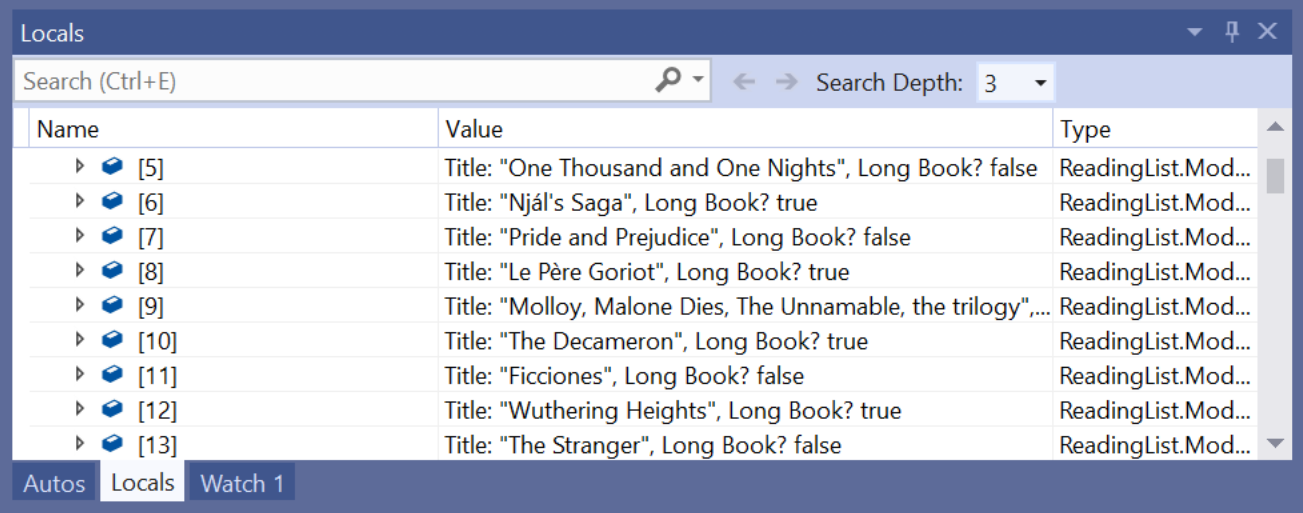
By writing DebuggerDisplay syntax at the top of a class, you can choose what strings and properties you want at the top of each object node in debugger windows.  Besides displaying strings in debugger windows, adding curly brackets ({}) to the DebuggerDisplay attribute allows Visual Studio to display the value of a property or method that you specify. You can also add format specifiers to DebuggerDisplay in order to further change how values are displayed and formatted in the debugger windows. In Figure 2, DebuggerDisplay appends the format specifier “nq” (no quotes).  The resulting display shows the string property Title without the surrounding quotation marks.

Basic DebuggerDisplay syntax added to top of Book class
Figure 2 – Basic DebuggerDisplay syntax added to top of Book class


Locals window with above DebuggerDisplay syntax added to code
Figure 3 – Locals window with above DebuggerDisplay syntax added to code


One previous workaround for performing this task is overriding a class’s ToString() method.  In contrast, DebuggerDisplay controls how an item is displayed without overriding that method.  So, if you don’t want debugging-related content in your ToString() method (especially when that method is called in your actual program), DebuggerDisplay is the way to go!


Can I display expressions for each object in debugger windows?

There may be times when you want to display expressions in debugger windows.  Good news: you can display expressions using the DebuggerDisplay attribute!


Example of DebuggerDisplay attribute containing an expression
Figure 4 – Example of DebuggerDisplay attribute containing an expression


Locals window with above DebuggerDisplay syntax and added expression evaluation
Figure 5 – Locals window with above DebuggerDisplay syntax and added expression evaluation


Bad news: DebuggerDisplay expressions can cause additional issues when debugging your code. Potential issues include performance hits for large or complex expressions, compilation and runtime errors when the expression’s language differs from the language being debugged, and application state changes when expressions mutate properties.


Figure 6 - DebuggerDisplay attribute with Visual Basic-style ternary expression syntax added
Figure 6 – DebuggerDisplay attribute with Visual Basic-style ternary expression syntax added


Figure 7 - Runtime error received after using above Visual Basic-style syntax while debugging in C#
Figure 7 – Runtime error received after using above Visual Basic-style syntax while debugging in C#


But fear not! One way to reduce these potential issues with expressions is by creating a private property or method that returns the string of an executed expression and telling DebuggerDisplay to display that property.


Figure 8 - Creating a private property containing more complex expressions and formatting referenced by DebuggerDisplay
Figure 8 – Creating a private property containing more complex expressions and formatting referenced by DebuggerDisplay


Figure 9 - Creating a method containing more complex expressions and formatting referenced by DebuggerDisplay
Figure 9 – Creating a method containing more complex expressions and formatting referenced by DebuggerDisplay


What is the feature equivalent  to DebuggerDisplay for C++ users?

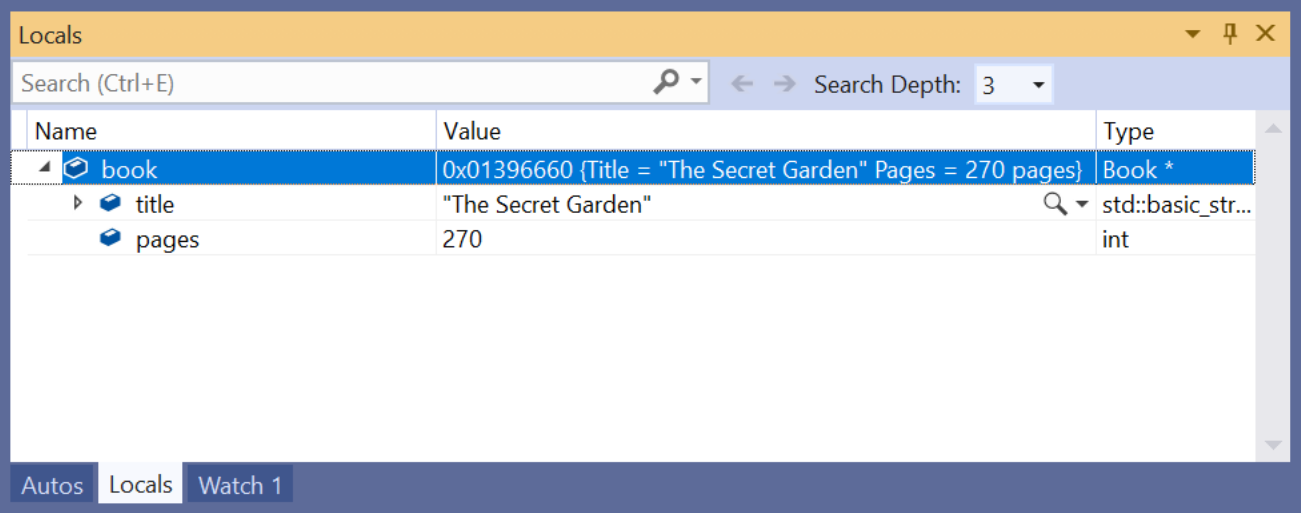
DebuggerDisplay is compatible with C#, F#, and Visual Basic, but if you’re debugging in C++, Natvis is a great alternative!  Though not as simple as adding syntax to the top of a class like DebuggerDisplay, adding a .natvis file to a project lets you customize how objects are displayed.


Figure 10 - Example of Natvis being used in Locals window
Figure 10 – Example of Natvis being used in Locals window


Right-click the C++ project node in Solution Explorer, select Add > New Item, and select Visual C++ > Utility > Debugger visualization file (.natvis).  The result is an XML file where you can control which properties are displayed while debugging.


Figure 11 - Example Natvis file corresponding to display shown above
Figure 11 – Example Natvis file corresponding to display shown above


To learn more about using Natvis while debugging C++ projects, check out the documentation.


These features are awesome and will save me lots of time!  How can I help share DebuggerDisplay and Natvis with others?

Fun fact: both DebuggerDisplay and Natvis attributes have been in Visual Studio for years!  These attributes are extremely useful to most developers but are still not as discoverable and well-known as they could be.  As a result, we are currently working to provide an easier method to discover these attributes better, and your feedback will help make this happen!  Please complete this survey which will give us insight in providing an improved experience when using these attributes.

The post Customize object displays in the Visual Studio debugger YOUR way appeared first on The Visual Studio Blog.

Create a private gallery for self-hosted Visual Studio extensions

$
0
0

Most Visual Studio extension authors publish their extensions to the public Marketplace to allow everyone to install them and benefit from the large and open ecosystem. However, some companies create extensions for internal use only. A private gallery allows them to distribute the extensions easily with the same auto-update capabilities enjoyed by any public Marketplace extension. And now, we’ve streamlined the process even more so that you can easily create a private gallery for your team or organization.

Visual Studio 2010 introduced support for private galleries, but few used them due to lacking samples and tooling. A lot has changed since then and the private gallery support has seen several updates to support extension packs and other more recent features.

The anatomy of a private gallery

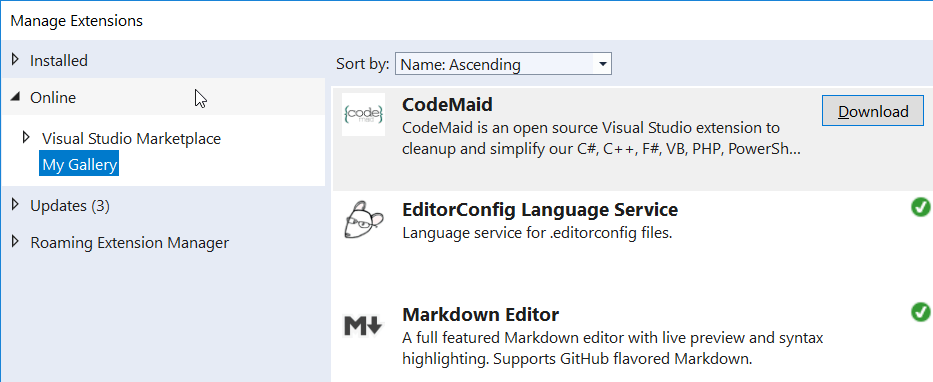
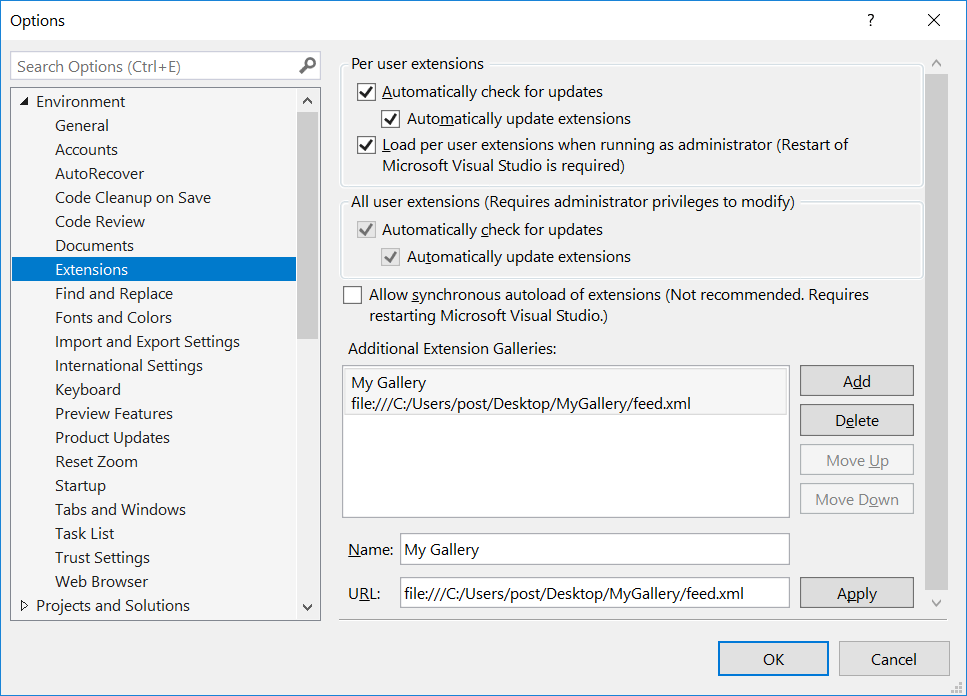
A private gallery is an ATOM feed XML File that contains meta data about the extensions. Registering the gallery with Visual Studio can be done either by the user manually under Tools -> Options or by an extension using a custom .pkgdef file (example).

The ATOM feed can be located on a web server, file system or file share. After registering the gallery, a new category appears under the Online tab in the Extension Manager dialog as shown in the first screenshot above.

Create the ATOM feed

The open source tool Private Gallery Creator makes it straightforward to create the ATOM feed. Download the executable and run it in a folder containing the VSIX files you wish to include in the feed. The tool analyzes the VSIX files and extracts the metadata needed to produce a file called feed.xml in the same folder.

You could also set up a CI/CD pipeline that automatically executes the tool to update the feed. In addition, the tool has a “watch” feature to automatically produce a new feed any time a VSIX file is added or modified in the same folder.

Set it up in only four steps

Here’s a recap of how to set up a private gallery:

  1. Put your .vsix files into an empty folder accessible to all consumers of the gallery
  2. Download PrivateGalleryCreator.exe executable into the same folder
  3. Double-click PrivateGalleryCreator.exe to produce the feed.xml file
  4. Register the feed in Visual Studio manually or from an extension’s .pkgdef file

In summary

You can learn more about private galleries from the documentation and by checking the Private Gallery Creator project on GitHub. There are a few public offerings for hosted private galleries such as MyGet and Open VSIX Gallery that may be worth looking into as well.

We’d love to hear about how you use private galleries today or why you don’t use them, so please sound off in the comments below.

The post Create a private gallery for self-hosted Visual Studio extensions appeared first on The Visual Studio Blog.

Visual Studio 2019 version 16.2 Preview 2

$
0
0

We are announcing the release of the second preview of Visual Studio 2019 version 16.2. The latest version is available for you to download from VisualStudio.com, or, if you already have the Preview installed, just click the notification bell from inside Visual Studio to update. This latest preview adds the ability debug JavaScript code using the new Microsoft Edge Insider, an improved installation experience, and updates to the application installer command-line packaging. We’ve highlighted some of the notable features below. You can see a list of all the changes in the release notes. 

Microsoft Edge Insider support 

The latest preview release of Visual Studio enables debugging JavaScript in the new Microsoft Edge Insider browser for ASP.NET and ASP.NET Core projects. To do this, simply install the browser, set a breakpoint in the application’s JavaScript and start a debug session. Visual Studio will launch a new browser window with debugging enabled allowing you to step through your JavaScript code within Visual Studio.

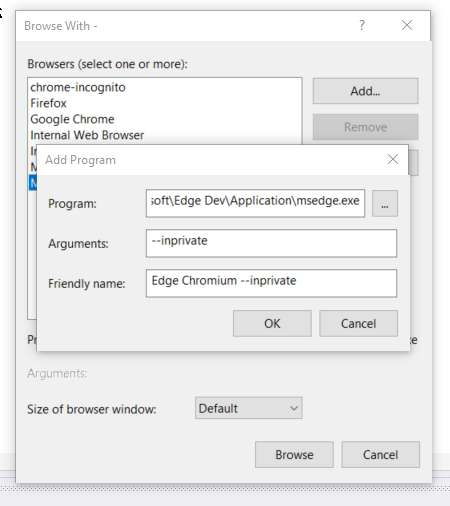
But it doesn’t stop there since Visual Studio also supports debugging custom browser configurations using the “Browse with” option to launch the browser with custom CLI parameters (e.g. inprivate).

Visual Studio Installer support 

The Visual Studio Installer will now better handle size space detection based on what you already have installed on your machine. The improved installer experience means that if the required amount of space is larger than what is available, the installation does not attempt. 

.NET Productivity Improvements 

The latest preview release continues to focus on developer productivity and we bring even more refactoring capabilities to enable you to write better code faster. We’ve heard the request to bring back the Sort Usings command and that it should be separate from the Remove Usings command. We appreciate everyone who shared their feedback with usYou can find the Sort Usings command under Edit > IntelliSense.

We’ve also added the ability to convert a switch statements to switch expressionsSince switch expressions  are a new C# 8.0 featureyou need to ensure that you’re utilizing the latest language version, i.e. C# 8.0. Under project file, verify the language version is set to preview. Place your cursor in the switch keyword, type (Ctrl+.) to open the Quick Actions and Refactorings menu, and then select Convert switch statement to expression. 

Finally, we’ve added the ability to generate a parameter as code fix. Place the cursor in the variable name and type (Ctrl+.) to open the Quick Actions and Refactorings menu. Select the option to Generate a variable to create a new parameter. 

App Installer Command Line Packaging Improvements 

In Visual Studio 2019 version 16.2 Preview 2, we improved the sideloaded command line packaging experience for Windows Desktop projects and, in particular, those that are configured to receive automatic updates using an .appinstaller file.   

In previous versions of Visual Studio, you were required to use one of three different methods to properly set the HoursBetweenUpdateChecks update setting in the .appinstaller file. You could use the Packaging Wizard to package the application, add the AppInstallerUpdateFrequency and AppInstallerCheckForUpdateFrequency build properties to the project file, or pass these parameters as command line arguments. 

In Preview 2, we have eliminated the need to use the Package Wizard or define these build properties.  Instead, you are able to simply define and pass HoursBetweenUpdateChecks as a parameter during the command line build, simplifying and making it easy to adjust that setting. 

Take it for a spin today 

Give the latest Preview release a try by downloading it online, or updating via the notification bell inside Visual Studio. You can also launch and use the Visual Studio Installer to install the update. 

Our PM team is always reviewing feedback and we look forward to hearing what you have to say about our latest release. If you come across any issues, make sure to let us know by using the Report a Problem tool in Visual Studio. If you have any feature ideas or want to ask questions, you should head over to Visual Studio Developer Community. We use your feedback to decide what to work on as we pursue our goal to make Visual Studio 2019 the best developer tool, so thank you again on behalf of our entire team. 

The post Visual Studio 2019 version 16.2 Preview 2 appeared first on The Visual Studio Blog.

Azure IoT Tools help you connect to Azure IoT Hub in 1 minute in Visual Studio Code

$
0
0

When doing development for Azure IoT solutions, developers may want to test and debug their cloud solution with a real device. However, not every developer has a real device in their hand.  With the Azure IoT Tools for Visual Studio Code, you can easily use Visual Studio Code as a device simulator to quickly interact with Azure IoT Hub. Let’s see how easy it is to send a D2C (device-to-cloud) message in Visual Studio Code! Say Hello to IoT Hub in Visual Studio Code in 1 minute!

Prerequisites

  1. If you don’t have an Azure subscription, create a free account before you begin.
  2. Install Visual Studio Code
  3. Install the Azure IoT Tools extension for Visual Studio Code

Create an IoT Hub

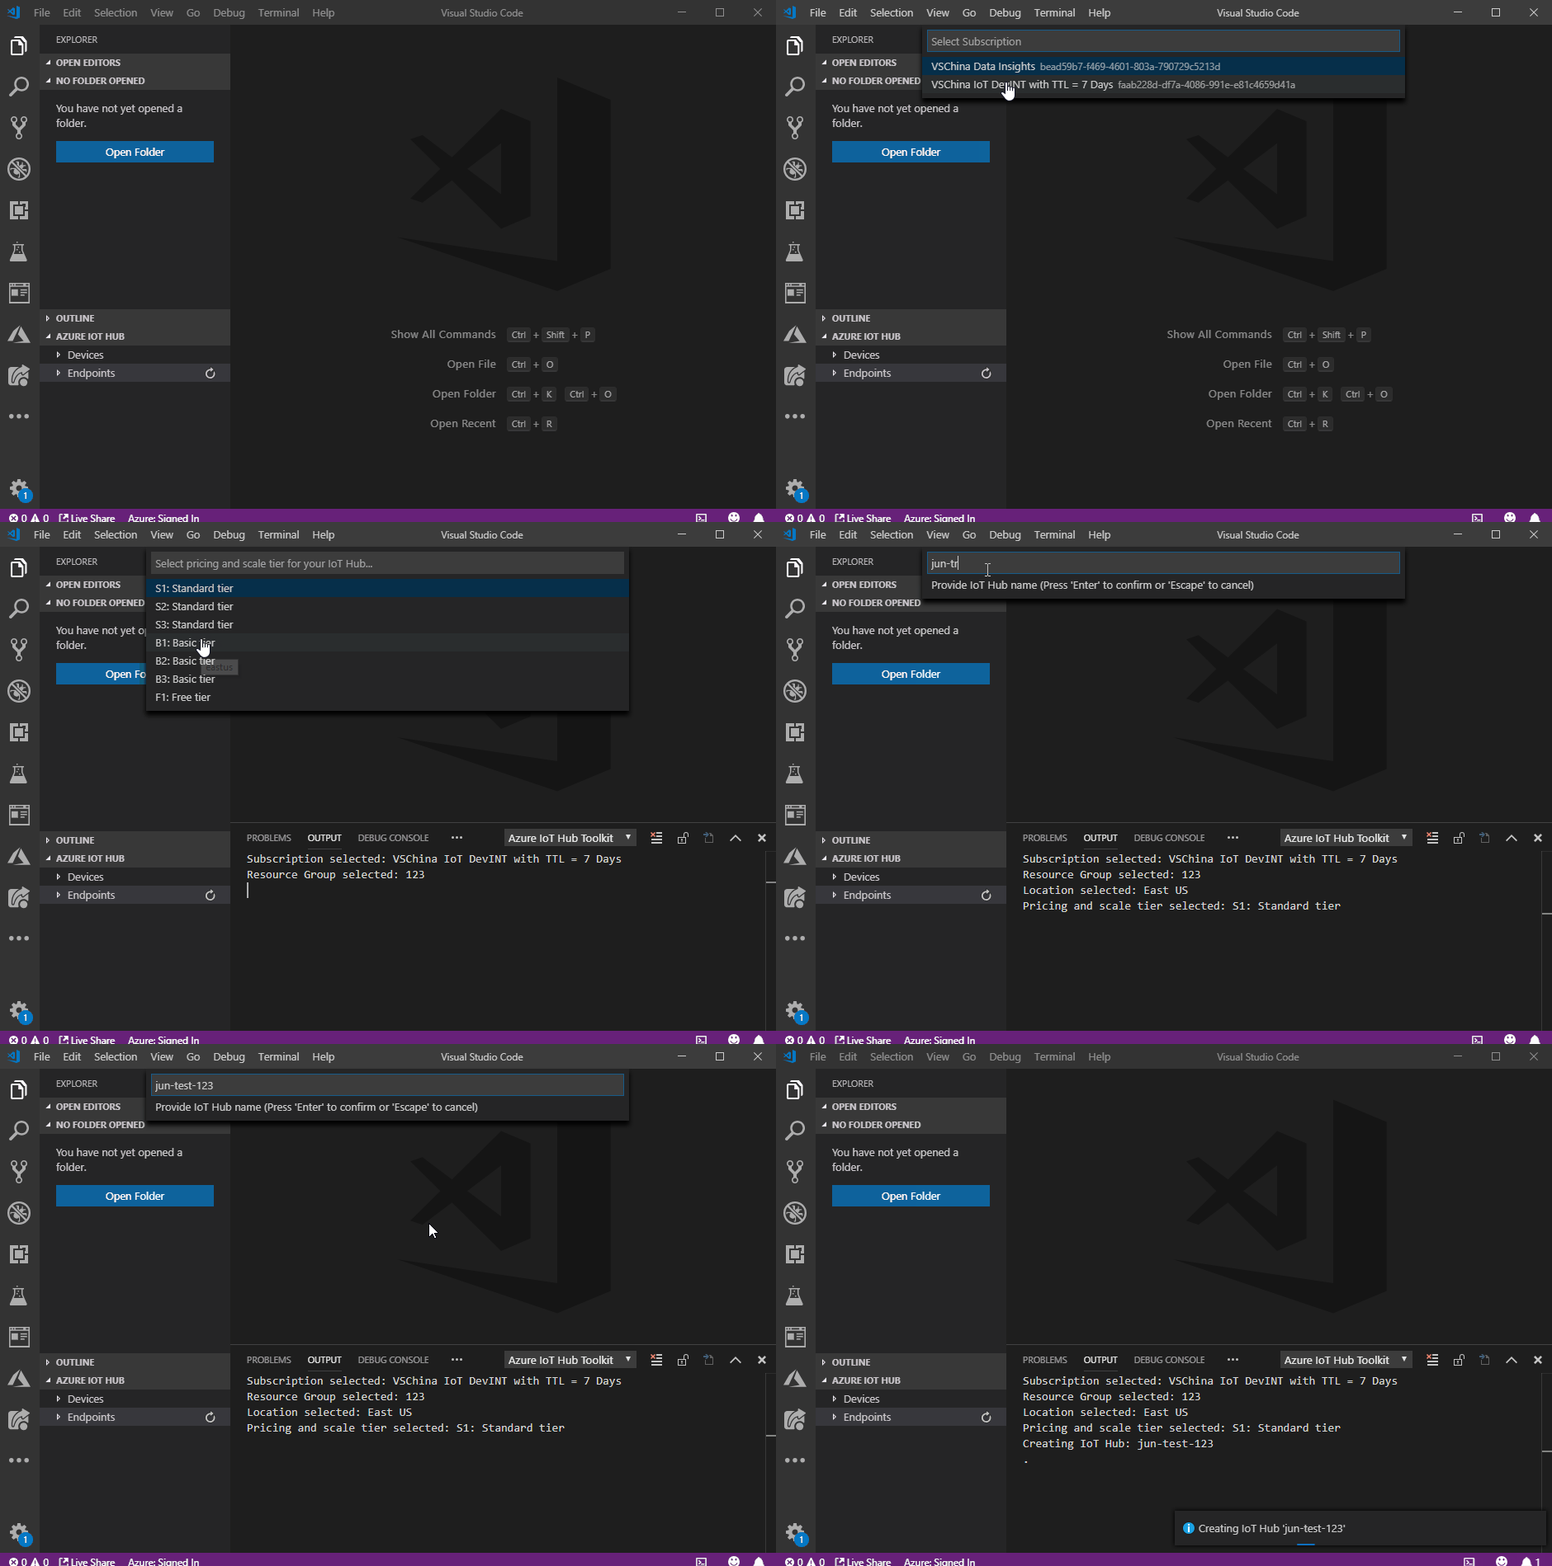
The first step is to create an IoT Hub in your subscription from Visual Studio Code.

  1. Click … > Create IoT Hub at AZURE IOT HUB tab, or type Azure IoT Hub: Create IoT Hub in Command Palette. (If you want to use an existing IoT Hub, click … > Select IoT Hub at AZURE IOT HUB tab)
  2. Choose your subscription, resource group, and the closest deploy location to you.
  3. For Pricing and scale tier, select the F1 – Free tier if it’s still available on your subscription.
  4. Enter the name of your IoT Hub.
  5. Wait a few minutes until the IoT Hub is created. you can see that your devices status become No device in ….

Register a device

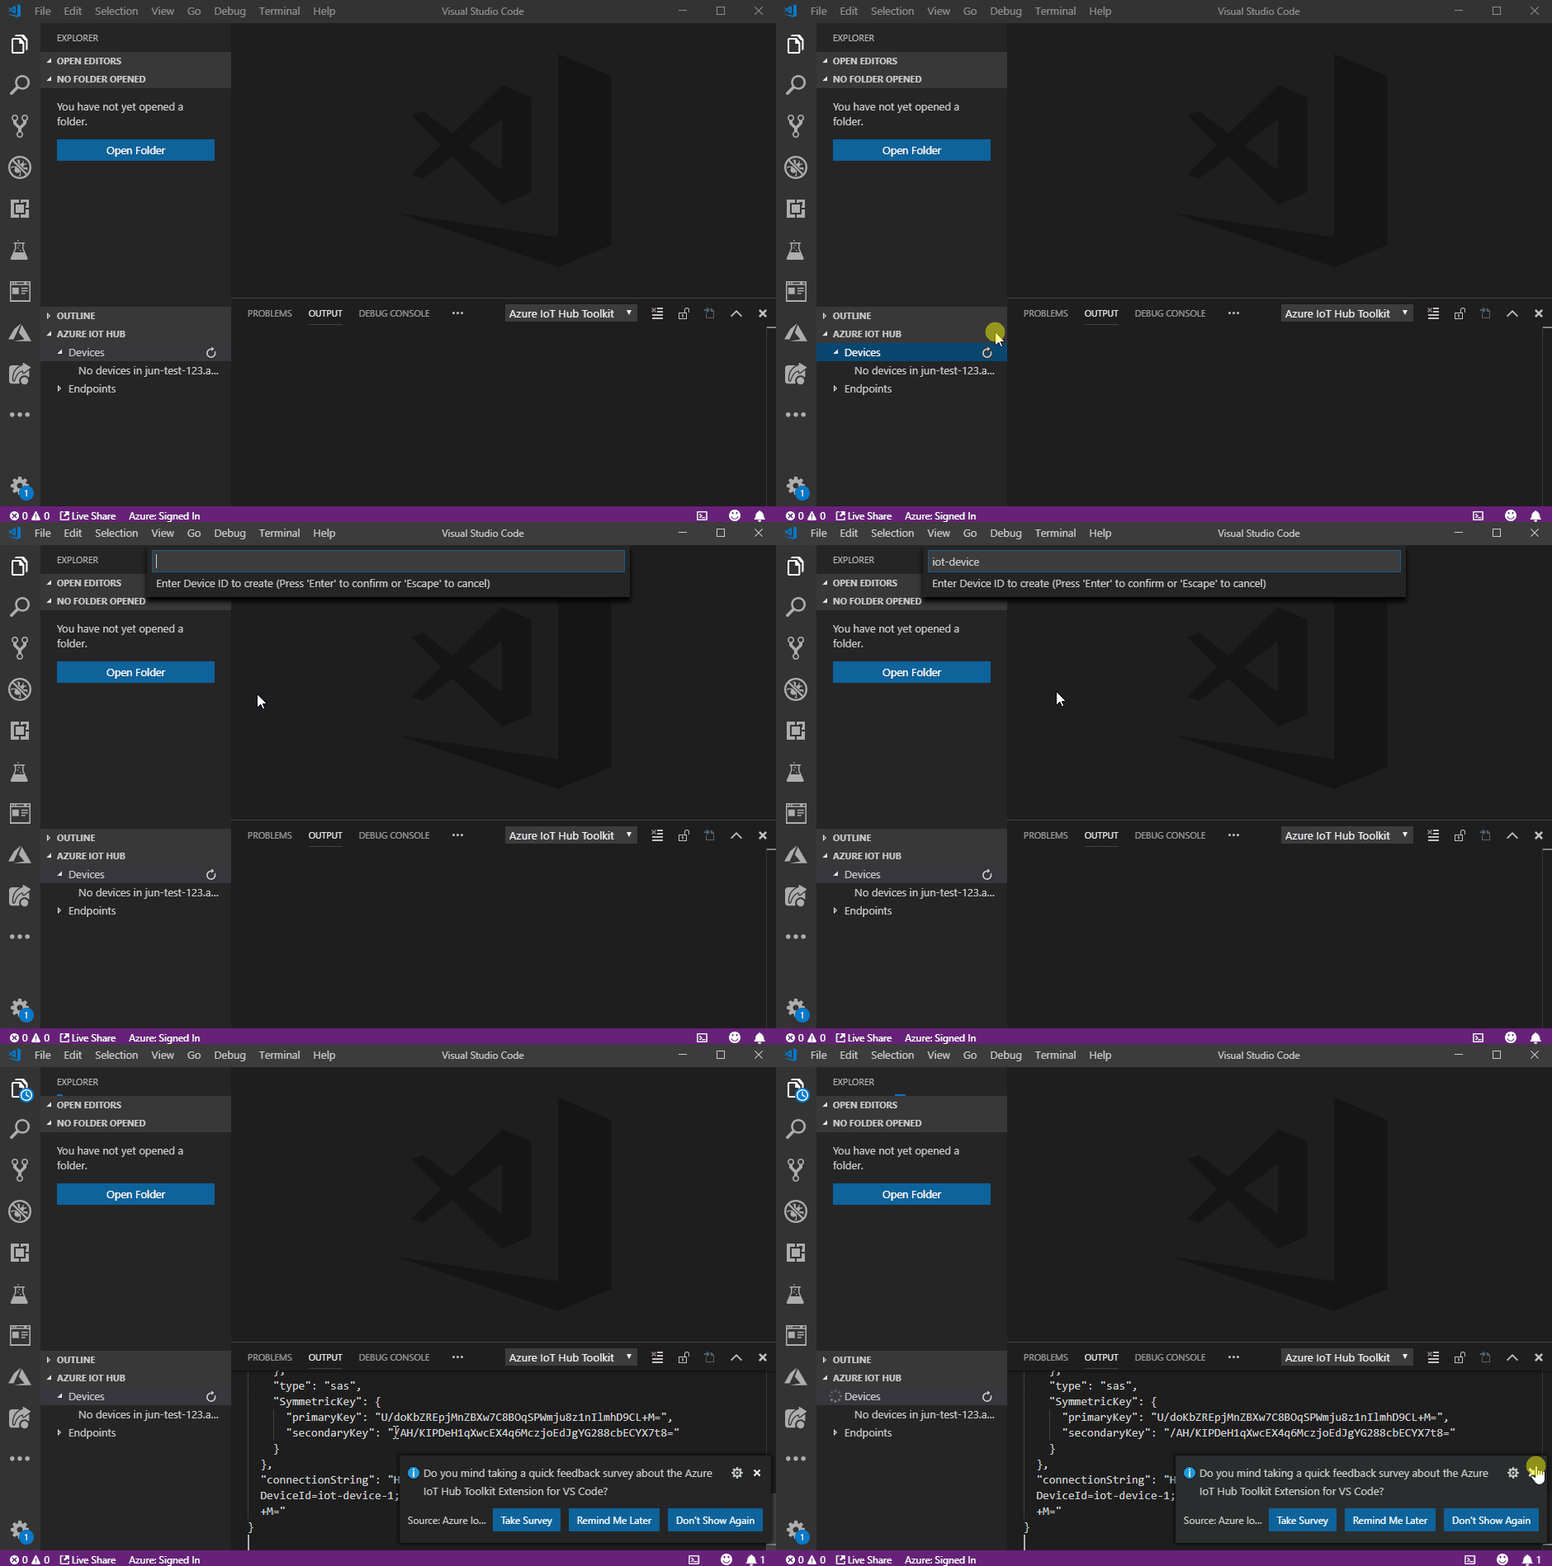
A device must be registered with your IoT Hub before it can connect.

  1. Click … > Create Device at AZURE IOT HUB tab, or type Azure IoT Hub: Create Device in Command Palette.
  2. Enter device ID and press Enter.
  3. Wait a few seconds until the new device is created.

Say Hello to IoT Hub (Send D2C message)

Right-click your device and select Send D2C message to IoT Hub, then enter the message, results will be shown in OUTPUT > Azure IoT Hub Toolkit view. Your ‘Hello World’ is sent to Azure IoT Hub!

Monitor IoT Hub D2C message in Visual Studio Code

While you could send message to your IoT Hub, it is also possible to monitor those messages in Visual Studio Code.

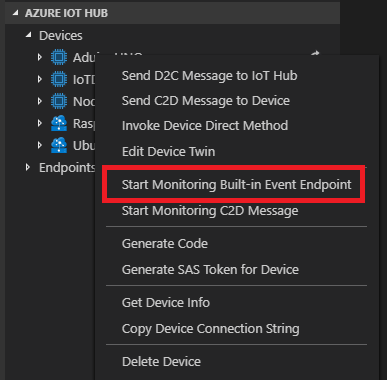
  • Right-click your device and select Start Monitoring Built-in Event Endpoint.

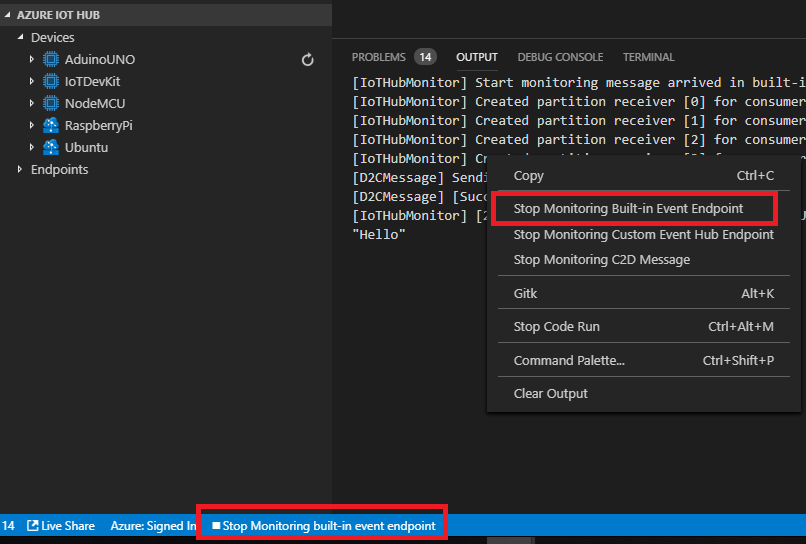
  • The monitored messages will be shown in OUTPUT > Azure IoT Hub Toolkit view.
  • To stop monitoring, right-click the OUTPUT view and select Stop Monitoring Built-in Event Endpoint.

Is that cool? You could send and receive messages for Azure IoT Hub very easily in Visual Studio Code. Is that all? Not yet! Actually, you could use Azure IoT Tools extension to do lots of things when you develop with Azure IoT Hub! Checkout our Wiki Page to see the full list of features and tutorials. You could also use Azure IoT Tools to easily call Azure IoT Hub REST APIs or generate Azure IoT application with different languages such as C#, Java, Node.js, PHP, Python. For more IoT tooling announcements and tutorials, please check out our IoT Developer Blog. Azure IoT Tools make your Azure IoT development easier.

Useful Resources:

The post Azure IoT Tools help you connect to Azure IoT Hub in 1 minute in Visual Studio Code appeared first on The Visual Studio Blog.

Visual Studio 2019 for Mac version 8.1 is now available (and a Preview for 8.2)

$
0
0

Todaywe are excited to announce the release of Visual Studio 2019 for Mac version 8.1 along with the first preview of Visual Studio 2019 for Mac version 8.2. Both releases contain exciting new features as well as improvements to performance and stability across the IDE. You can download the latest update on the Visual Studio download page or update an existing installation via the Updater within Visual Studio for MacYou can find release notes for both the stable and preview releases on our Release Notes page. We’ve also updated our Roadmap to give you a look at whatcoming over the next 3 months in versions 8.2 and beyond – including updated web editors, support for projects using multiple target frameworks, and solution-level NuGet package management! 

Visual Studio 2019 for Mac version 8.1 

Version 8.1 continues to expand on the improvements we’ve brought to Visual Studio for Mac with new features added to the C# code editor as well as new ASP.NET Core templates.  

The new editor, which was initially announced as a preview feature in Visual Studio 2019 for Mac version 8.0is now the default editing experience for C# filesThe new editor features an updatedfully native UI built on top of the reliable Visual Studio foundation. You’ll find several additional features that close the gap between the old and new editor in addition to some that were explicitly requested by the Visual Studio for Mac user community. These features include: 

  • Faster code generation through code snippets 
  • Improved analyzer functionality with inline lightbulbs 
  • Improved multicaret functionality 
  • Quick navigation via Document Outline and an improved Go to Line implementation  
  • Faster editing with drag and drop across views 

One of the most requested features from our users was the ability to utilize code snippets within a C# file. They’re a great way to quickly add blocks of common code to your project, such as properties and constructors, by leveraging the power of IntelliSense. Visual Studio for Mac now contains dozens of built-in snippets and allows you to easily expand the default library with custom ones using the Code Snippets editor within Preferences.  

Another feature we’ve added to help increase your coding efficiency is inline lightbulbs for C# projects.  For cases where you’re looking for alternative code suggestions or trying to find that code error that stops your code from building, inline lightbulbs help you refine your code and quickly detect errors in real-timeAll it takes to apply a suggested fix is a few clicks of the mouseallowing you to quickly get back to codingAnd because the logic powering these suggestions is shared with Visual Studio on Windows, you’ll always be up to date and have support for the latest analyzers.  

The latest version also brings improved navigation and editing shortcuts, such as the Document Outline and a brand-new Go to Line implementation. The new editor also supports the ability to drag and drop code across files within your project. All these improvements have been implemented with your improved productivity as our primary focus, empowering you to write better code, faster. 

In addition to the new C# editor features, you can now edit Android layout files side-by-side with a real-time designer view. This experience allows you to see changes you make to an Android layout file on the fly as you are editing, greatly improving the efficiency while editing these files. 

Finallywe’ve introduced a handful of improvements to performance and stability, updated ASP.NET Core project templates, and refined the component selection process at install based on your feedback. 

Visual Studio 2019 for Mac version 8.2 Preview 

As we mentioned earlier in this post, today we’re also releasing the first preview of Visual Studio 2019 for Mac version 8.2. In order to use the 8.2 Preview, you can easily switch to the Preview channel within Visual Studio for Mac. 

Improved XAML Editing Experience 

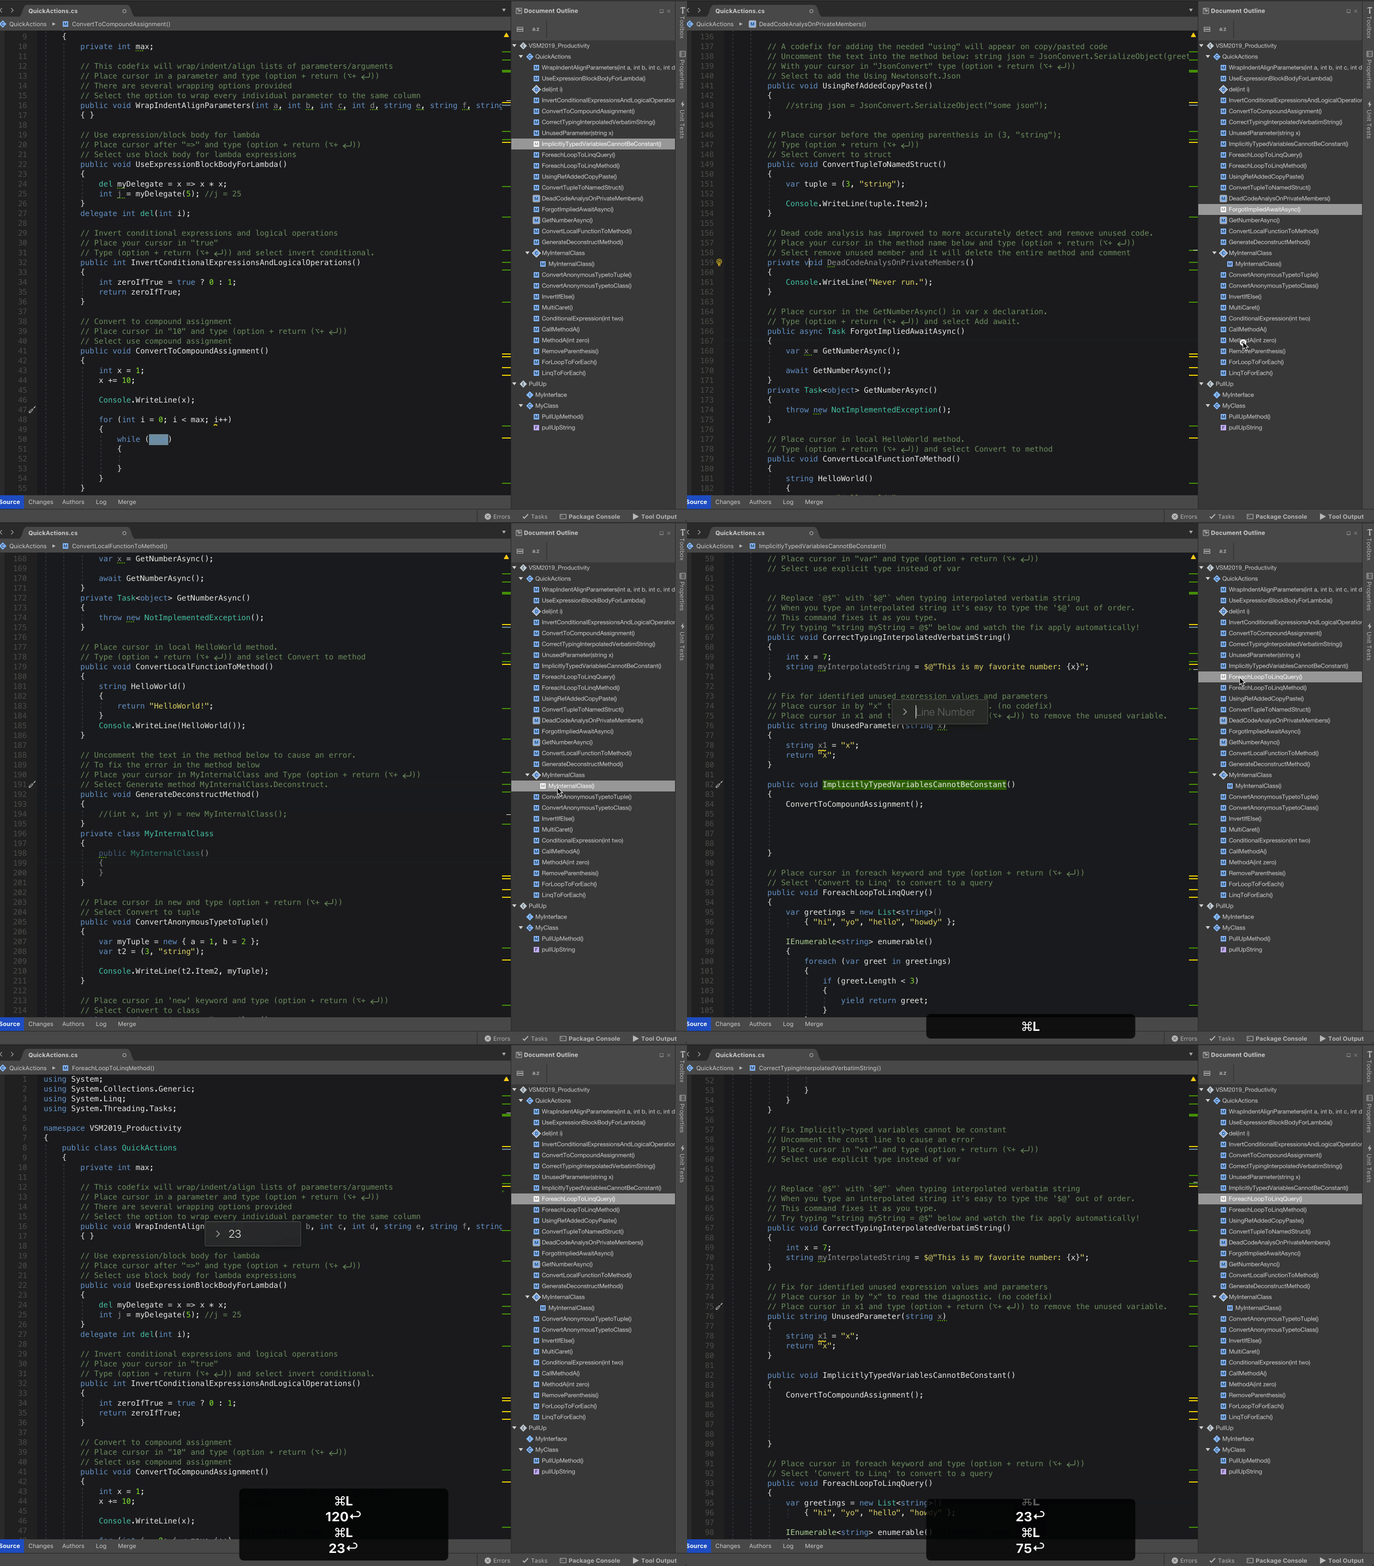
The 8.2 Preview release introduces new XAML and AXML editing experiences based on the same core as the new C# editor as well as the XAML language service from Visual Studio on Windows. These components provide improved XAML and AXML editing experiences, including more accurate and powerful IntelliSense, faster performance, better matching, improved linting, and an overall increase in the reliability of the editing experience. You can enable the new XAML editor via Visual Studio > Preferences > Text Editor > Behavior > XAML and selecting “Enable new XAML language service”.

One of the advantages of the new XAML Language Service with Visual Studio for Mac is that you now have access to much improved matching capabilities. For example, completions now support fuzzy matching, substring matching, and CamelCase matching, reducing the time it takes to find keywords without the need to perfectly match casing. Examples of the new matching patterns supported in the XAML editor include: 

  • Substring Matching: Matches will be listed when you type a part of a string, even if it is in the middle of the string. This is a great feature if you recall a section of a command, but not the entire command. Typing “Lay” will match “StackLayout” along with any other string which contains “lay”. 
  • Case Insensitive Matching: If you can’t recall the exact casing of a string you’re trying to find, case insensitive matching will ensure you can still find what you’re looking for. With support for this kind of matching, typing “stack” will match to “StackLayout. 
  • Fuzzy Matching: Typing any portion of a string will provide a list of matching and like matches. If you type “stck”, StackLayout will still appear as an option. 

You’ll also see improvements to suggested completions in a wide variety of scenarios for XAML, including light bulb suggestions and binding, resource, XMLNS, and markup extension completion, allowing you to write code faster and more accurately. 

.NET Core 3 and C# 8 Preview 

At Build 2019, we highlighted the next evolution in the .NET Core ecosystem.NET Core 3With it comes improved performance, streamlined project files, and an updated deployment experience. You can learn more about the new features and fixes offered in .NET Core 3 through the What’s New documentation. 

In addition to .NET Core 3, Visual Studio for Mac 8.2 also offers a preview of support for C# 8. This next generation update of C# continues to improve upon the solid foundation of C# through the integration of language features to help you write powerful code in less time. You can learn more about some of the new features in C# 8 through our documentation. 

Improved Android XML editing experience 

Android layout and resource file editing is now powered by Visual Studio for Mac’s new editorThis means that you will be able to experience all of the rich editing experiences and performance that you see in the C# editor in your Android layout files. These enhancements include improved IntelliSense, go-to-definition, and semantic editing of your files, all within Visual Studio for Mac. 

Download and try today 

We encourage you to download and try out the version 8.1 release todayWe hope this release brings us one step closer to our goal of providing you with the right tools to make .NET development on macOS a breeze.  

We also invite you to try the 8.2 Preview 1 release of Visual Studio 2019 for Mac if you’re interested in benefiting from the new XAML editor and in helping us build a better product by providing feedback and suggestions. As always, if you come across any bugs or issues, please use thReport a Problem feature to help us to improve this new experience and make each release as powerful and reliable as possible. 

The post Visual Studio 2019 for Mac version 8.1 is now available (and a Preview for 8.2) appeared first on The Visual Studio Blog.

Announcing the Visual Studio Code Installer for Java

$
0
0

It’s been almost 3 years since the first Java language server was developed during a hackathon in a small conference room at Microsoft’s Zurich office with people from Red Hat, IBM, Codenvy and Microsoft, which later became one of the most popular extensions for Visual Studio Code with more than 2.7 million installations. Since then, Visual Studio Code has gone through a thrilling journey and become to the most popular development environments according to Stack Overflow. More and more Java extensions are now available in Visual Studio Code to serve a growing Java community using Visual Studio Code along with their favorite tools and frameworks.

During this journey, we’ve heard many developers ask how to start with Java in Visual Studio Code. As the vibrant Java community expands to include more students and developers from other languages, many new comers struggle with setting up their environment to be able to start coding. To help people get started, we created the Java extension pack to give you the relevant extensions, and also included tutorials with detailed steps in our documentation.

Back in 2018, Microsoft Azure became a Platinum Sponsor of the AdoptOpenJDK project – that just got renewed until June 2020 – and provides a truly vendor neutral, completely free and open source distribution of the JDK (Java Development Kit) based on the OpenJDK project. This was a turning point for us so much we’ve also added a functionality to detect and help developers install a JDK binary in their environments, having AdoptOpenJDK as the recommended distribution. These efforts were encouraging, but got us thinking about more ways we could make it easier to starting coding in Java.

Introducing the Visual Studio Code Java Pack Installer

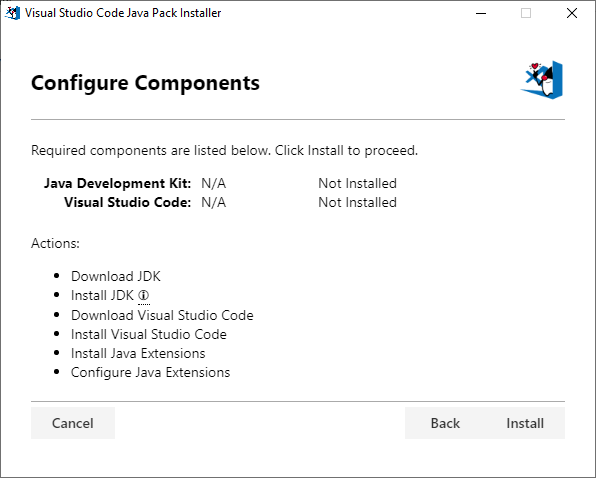
So today, we’re releasing a special Installer of Visual Studio Code for Java developers. The package can be used as a clean install or an update for existing environment to add Java or Visual Studio Code to your development environment. Once downloaded and opened, it automatically detects if you have the fundamental components in your local development environment, including the JDK, Visual Studio Code and essential Java extensions.

After clicking Install, it will pull the stable versions of those tools from trusted online sources and install them on your system. Once it’s done, you can open Visual Studio Code and start writing and running Java code directly! Below is a short video showing you how to write and run a Hello World program with Java in Visual Studio Code in less than 1 minute. See more detailed functionality in our tutorial.


The installer is available for download for Windows now while we’re still working on the macOS version. Please have a try and let us know your feedback!

If you’d like to follow the latest of Java on Visual Studio Code, please provide your email with us using the form below. We will send out updates and tips every couple weeks.

Thank you and happy coding.

The post Announcing the Visual Studio Code Installer for Java appeared first on The Visual Studio Blog.

Java on Visual Studio Code June Update

$
0
0

Welcome to the June update of Java on Visual Studio Code!

Earlier this month, we shared our new Java Installer for Visual Studio Code, which aims to help new Java developers to get their environment ready and start coding in just a few clicks. In this update, we’d like to share a couple new features and enhancements delivered during last few weeks.

More code actions

Developers need refactoring and code actions to achieve high productivity, so we’re bringing more of those features to you.

Enhanced “Generate getters and setters”

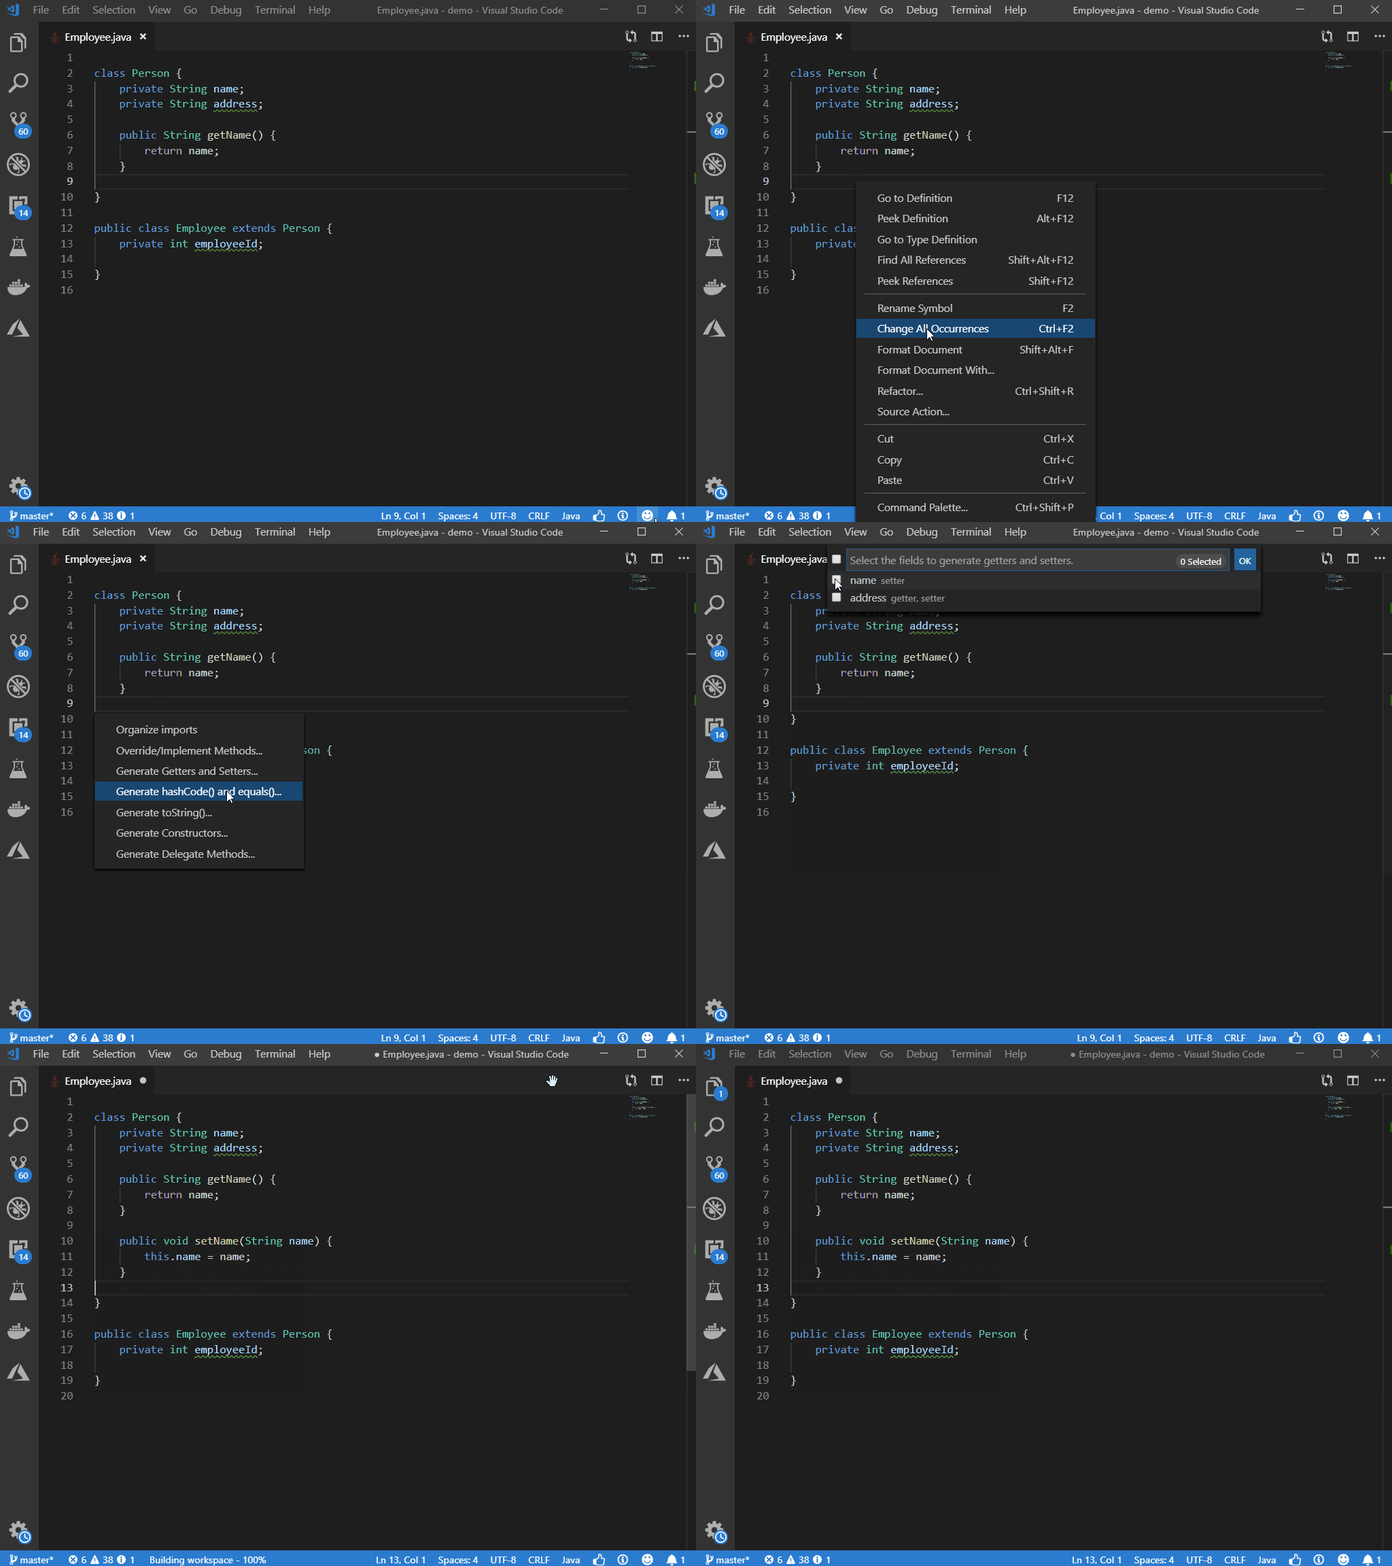
In addition to bulk generate getters and setters for all member variables, if the class has more than one field, the source action will also prompt a quick pick box which allows you to select the target fields to generate the accessor methods.

The source action is also aware of the java.codeGeneration.generateComments preference and will use it to decide whether to generate comments for getter and setter methods.

Generate Delegate Methods

This new code action enables generating delegate methods.

Generate Constructor

This source action helps adding constructor from super class.

Assign parameter to new field

This source action assigns parameter to new field for unused constructor parameter(s).

Performance improvements

A set of changes have been made to further improve performance of Java in Visual Studio Code, including a fix for I/O issue on Windows platform, reducing memory footprint for large projects with deep modules and batch project imports. VS Code is a lightweight editor and we’d like to make sure it still feels just like an editor when despite more and more features being added to it.

Debugger updates

Debugging is the most frequent used feature second only to code editing. We’d like you to enjoy debugging Java in Visual Studio Code.

Show more meaningful value in variable window and hover tool-tip

We’re now providing additional detailed information for variables during debug

  • For the classes that override ‘toString‘ method, show toString() details.
  • For Collection and Map classes, show an additional size=x details.
  • For Entry, show key:value details

New HCR button

To better expose the hot code replace feature and let you control it more explicitly, we’ve added a new button to the toolbar and provided a new debug setting java.debug.settings.hotCodeReplace to allow you control how to trigger HCR. Default to manual.

  • manual – Click the toolbar to apply the change to running app

  • auto – Automatically apply the changes after compilation. This is the old behavior.
  • never – Never apply the changes

See HCR in action

Global setting for selecting debug console

While VS Code offers a powerful Debug Console with REPL (Read-Eval-Print Loop) functionality, one major restriction of it is it doesn’t accept input. For those programs which need to take console input, developers need to specify to use integratedTerminal instead of internalConsole in launch.json.

"console": "integratedTerminal"

However, this is not convenient if you need to do it repeatedly. Now we’re introducing a global setting, java.debug.settings.console. you can use this setting to configure the default debug console so you don’t need to change the launch.json every time.

"java.debug.settings.console": "integratedTerminal"

Other updates

Maven

2 new configs are now available for Maven extension

  1. pomfile.globPattern – specified how the extension search for POM file.
  2. pomfile.autoUpdateEffectivePOM – specifies whether to update Effective-POM automatically.
Test Runner

In recent releases, we’ve added support for a couple additional JUnit5 annotations, such as @Nested and @TestFactory. Test runner will also automatically show the test report after execution now.

Sign up

If you’d like to follow the latest of Java on VS Code, please provide your email with us using the form below. We will send out updates and tips every couple weeks and invite you to test our unreleased feature and provide feedback early on.

Try it out

Please don’t hesitate to give it a try! Your feedback and suggestions are very important to us and will help shape our product in future.

The post Java on Visual Studio Code June Update appeared first on The Visual Studio Blog.


Visual Studio tips and tricks

$
0
0

Whether you are new or have been using Visual Studio for years, there are a bunch of tips and tricks that can make you more productive. We’ve been sharing tips on Twitter using the #vstip hashtag for a while, and this is a collection of the best ones so far.

Debugger

Hitting F10 to build, run, and attach debugger instead of F5 will automatically break on the first time your own code is being executed. No breakpoints needed.

Supported from Visual Studio 2005


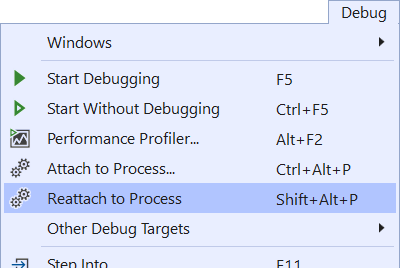
Reattach to process (Shift+Alt+P) is extremely helpful when you have to attach to the same process again and again.

Supported from Visual Studio 2017 v15.8


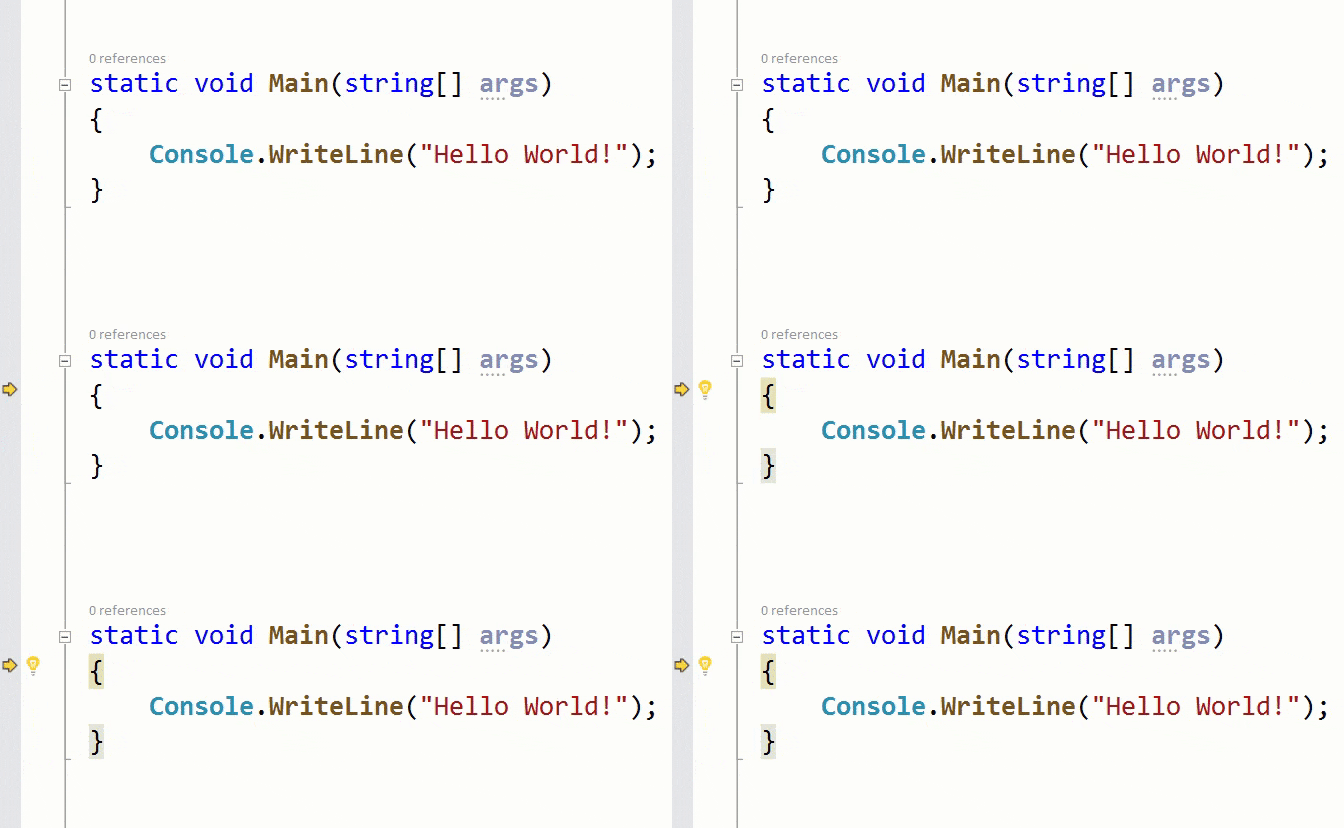
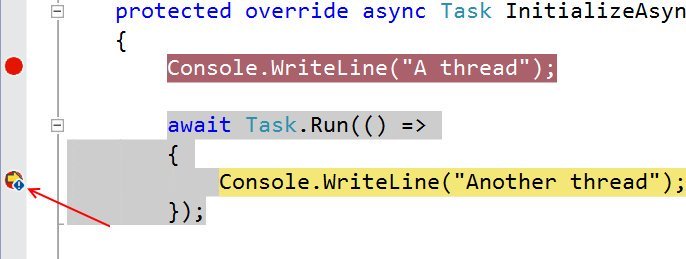
A blue dot in the margin indicates a switch of threads while stepping through debugging.

Supported from Visual Studio 2013

Solution

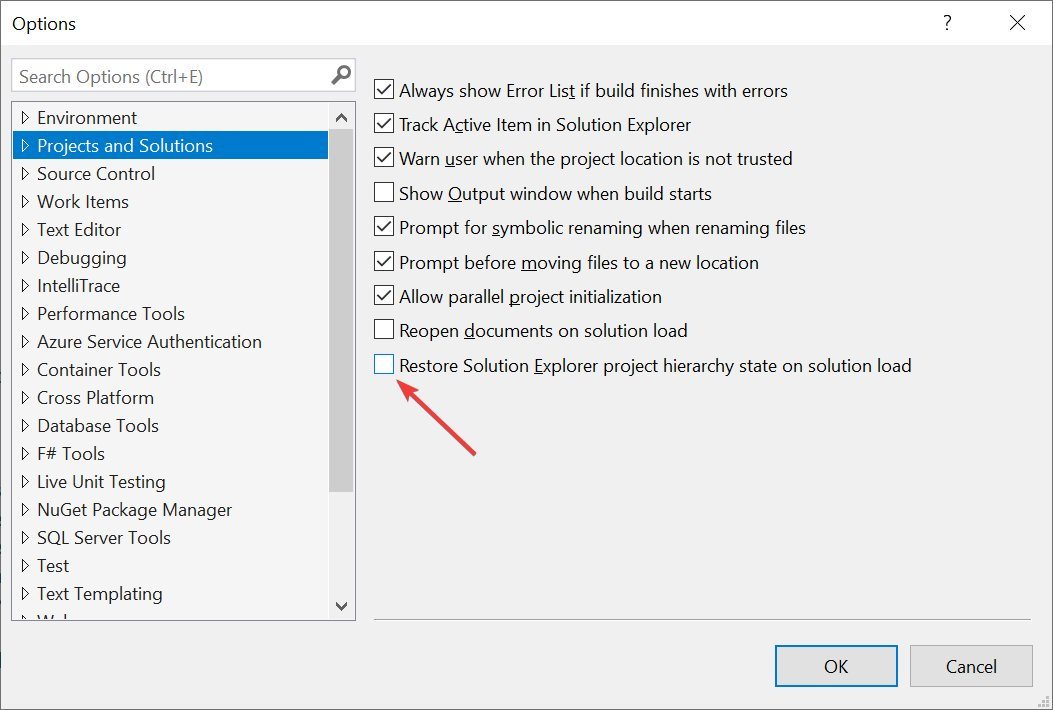
Improve performance of solution load and reduce visual noise by disabling restore of node expansions in Solution Explorer as well as Reopen documents on solution load.

Supported from Visual Studio 2019


For fast keyboard navigation, use Ctrl+T to find anything in your solution – files, classes etc.

Supported from Visual Studio 2017


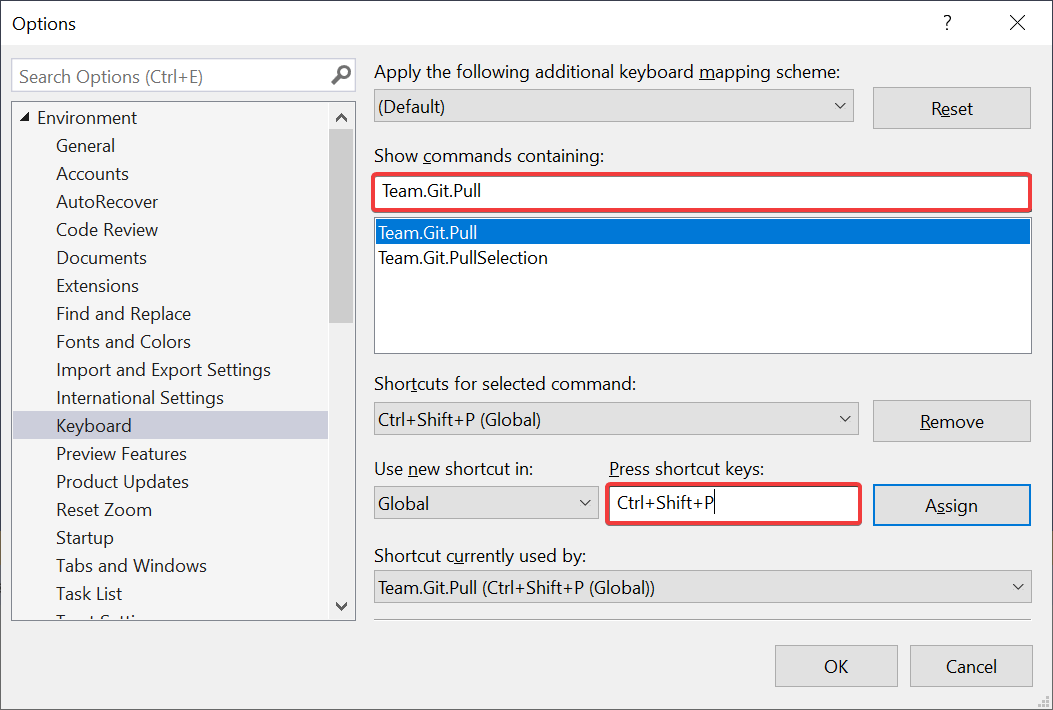
Assign a keyboard shortcut to perform a “git pull” so you don’t have to use CLI or Team Explorer to ensure your repo is up to date.

Supported in Visual Studio 2019


Make Solution Explorer automatically select the current active document, so you never lose track of its location in the project.

Supported from Visual Studio 2010

Editor

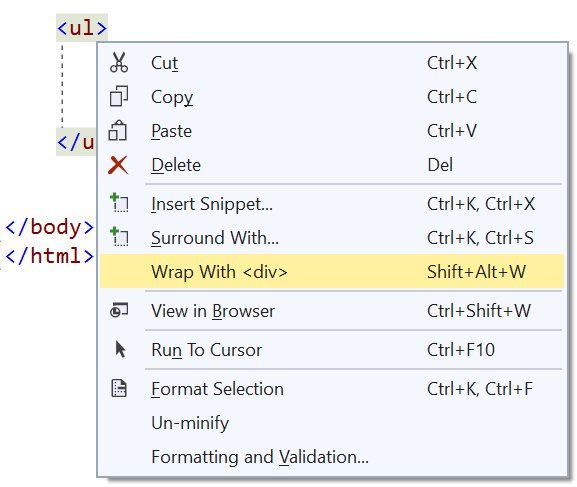
Easily surround HTML elements with a <div> using Shift+Alt+W. The inserted <div> is selected so you can easily edit it to be any tag you’d like, and the end-tag matches up automatically.

Supported from Visual Studio 2017


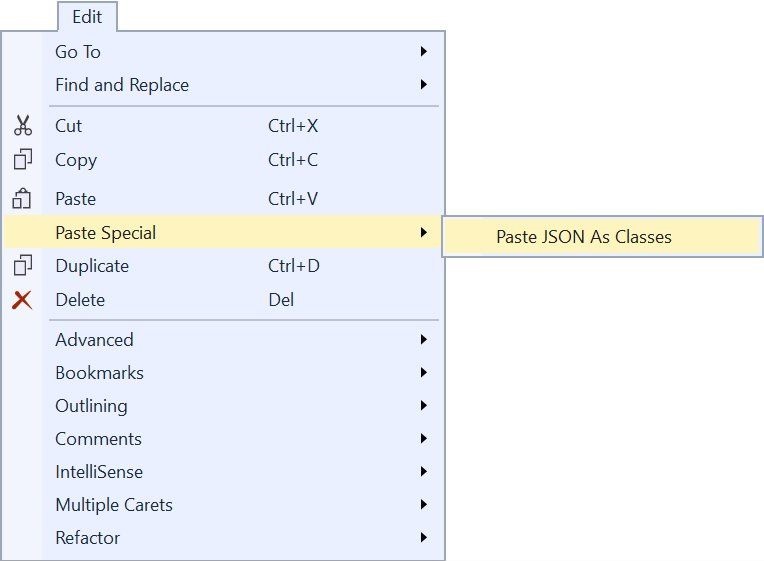
Copy any JSON fragment to the clipboard and paste it as strongly typed .NET classes into any C# or VB code file.

Supported from Visual Studio 2013


You don’t need to write quotation marks around JSON property names, simply type a colon and Visual Studio will insert the quotes automatically.

Supported in Visual Studio 2015


Make IntelliSense and tooltips semi-transparent for the duration you press and hold the Control key.

Supported from Visual Studio 2010


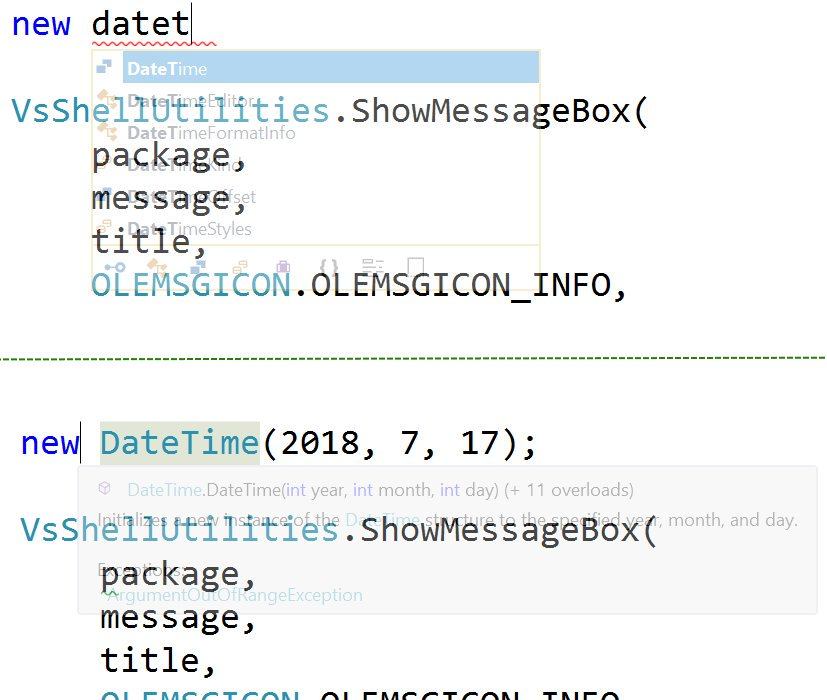
Instead of retyping ‘(‘ to show parameter info in method signatures, use Ctrl+Shift+Space to display the currently used overload.

Supported from Visual Studio 2010


Miscellaneous

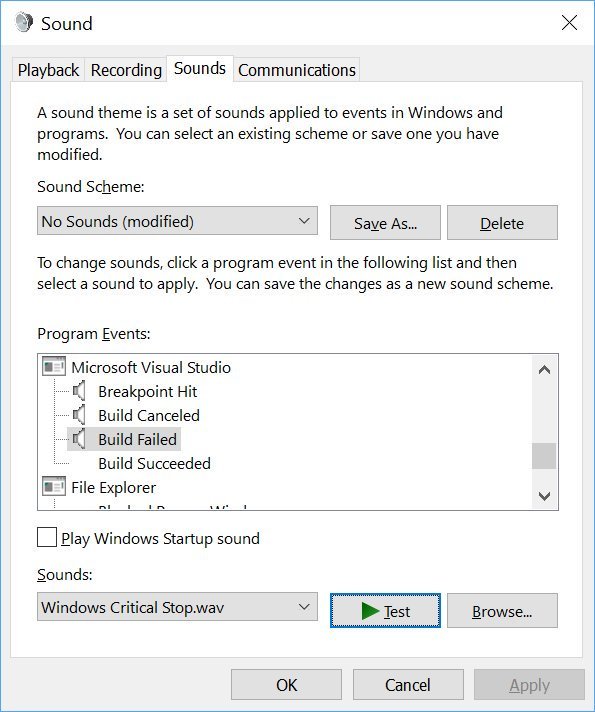
Play a sound when certain events occur within Visual Studio.

Supported from Visual Studio 2010


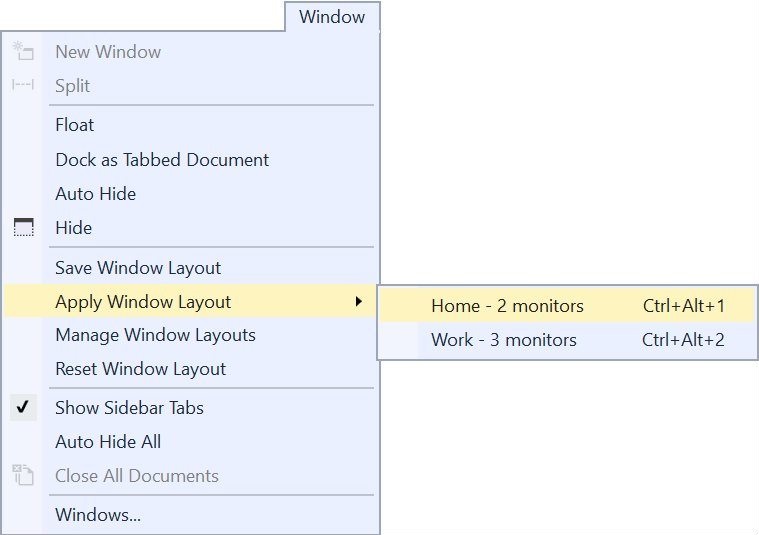
Create custom window layouts for specific development scenarios or monitor setups and switch between them easily.

Supported from Visual Studio 2017


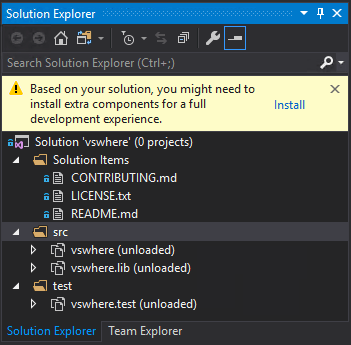
Specify which Visual Studio components are required for any solution, and Visual Studio will prompt the user to install them if missing. Read more in the blog post Configure Visual Studio across your organization with .vsconfig.

Supported from Visual Studio 2019

Extensions

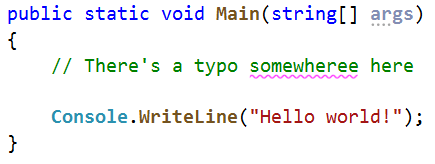
Visual Studio Spell Checker. An editor extension that checks the spelling of comments, strings, and plain text as you type or interactively with a tool window. It can also spell check an entire solution, project, or selected items. Options are available to define multiple languages to spell check against.

Supported from Visual Studio 2013


Add New File. A Visual Studio extension for easily adding new files to any project. Simply hit Shift+F2 to create an empty file in the selected folder or in the same folder as the selected file.

Supported from Visual Studio 2015


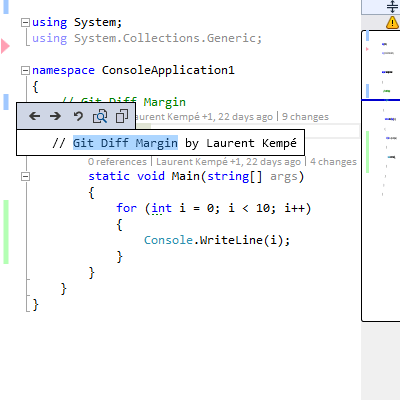
Git Diff Margin. Git Diff Margin displays live Git changes of the currently edited file on Visual Studio margin and scroll bar.

Supported from Visual Studio 2012

This was just a few of the thousands of available extensions. To see more extensions, go to the Visual Studio Marketplace.

In closing

These were just a few hand-picked tips from the #vstip hashtag on Twitter. There are plenty more to check out. If you have some great tips, please share them using the #vstip hashtag so we can all easily find them.

The post Visual Studio tips and tricks appeared first on The Visual Studio Blog.

Checklist for writing great Visual Studio extensions

$
0
0

Great Visual Studio extensions share a few key features that sets them apart from the rest. They look and feel well crafted, are performant and reliable, do what they advertise to perfection, and blend in naturally among Visual Studio’s own features.

To make it easier to write great extensions, we’ve worked with the extensibility community to come up with a simple checklist to follow. There’s even a GitHub issue template you can use so you remember to go through the checklist.

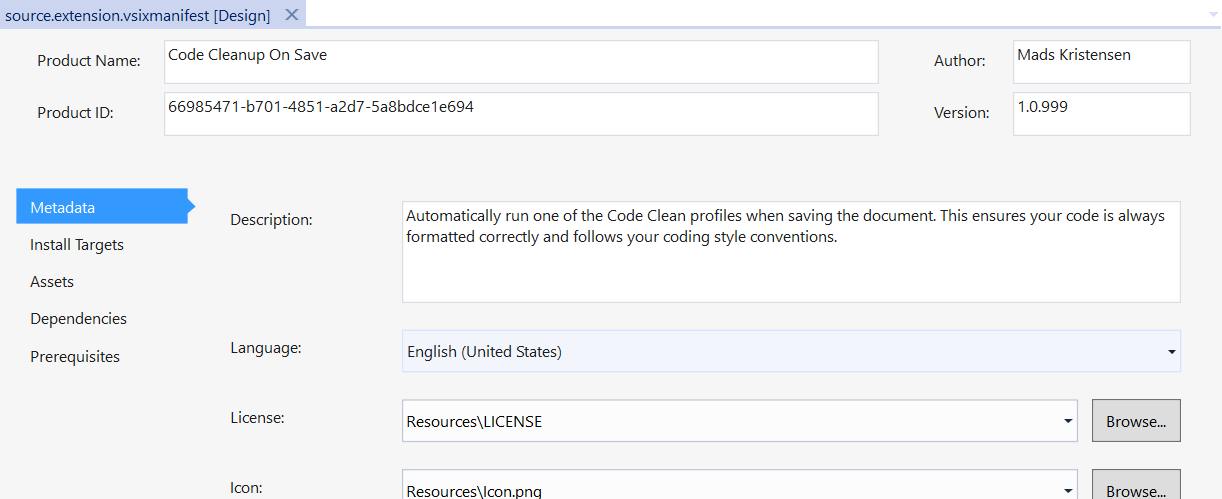
A .vsixmanifest file showing best practices

Rules

The following list is in no specific order. Remember to complete all items for best results.

Rule 1: Adhere to threading rules

Add the Microsoft.VisualStudio.SDK.Analyzers NuGet package to your VSIX project. This will help you discover and fix common violations of best practices regarding threading.

Rule 2: Add high-quality icon

All extensions should have an icon associated with it. Make sure the icon is a high-quality .png file with the size 128×128 pixels in 96 DPI or more. After adding the icon to your VSIX project, register it in the .vsixmanifest file as both the Icon and Preview image. The Visual Studio Marketplace makes use of the larger icon and it will get resized dynamically when shown inside Visual Studio.

Rule 3: Name and description

Studies show that users are more likely to install extensions with short and descriptive names and accurate descriptions. Make sure the name reflects the essence of what the extension does. The description in the .vsixmanifest file should set expectations as to what the extension does. So, a brief mention of what problems it solves and what main features it has are key.

Rule 4: Write good Marketplace description

This is one of the most important things you should do to make your extension successful. A good description consists of:

  • Screenshots/animated GIFs of the UI added by the extension
  • Detailed description of the individual features
  • Links to more details if applicable

Rule 5: Add license

The license is visible on the Marketplace, in the VSIX installer and in the Extensions Manager dialog. Always specify a license to set the expectations for the users. Consider using choosealicense.com to help find the right license for you. The reason for this rule is to remove any ambiguity, which is important for many Visual Studio users.

Rule 6: Add privacy notice

If the extension collects data such as telemetry or in any other way communicates with a remote endpoint, add a note about it in the description.

Rule 7: Use KnownMonikers when possible

Visual Studio ships with thousands of icons which are available in the KnownMonikers collection. When adding icons to command buttons, see if you can use the existing KnownMonikers icons since they are part of a design language familiar to the Visual Studio users. Here’s a full list of KnownMonikers and grab the KnownMonikers Explorer extension to find the right one for your scenarios.

Rule 8: Make it feel native to VS

Follow the same design patterns and principles that Visual Studio itself uses. This makes the extension feel natural to the users. It also reduces distractions caused by poorly designed UI. Make sure that all buttons, menus, toolbars and tool windows are only visible by default when the user is in the right context to use them. There are some rules of thumb to follow:

  • Don’t ever add a new top-level menu (next to File, Edit, etc.)
  • No buttons, menus and toolbars should be visible in contexts they don’t apply to
  • If auto load is necessary (it probably isn’t), do it as late as possible.
  • Use VisibilityConstraints to toggle visibility of commands instead of relying on auto load

Rule 9: Use proper version ranges

It can be tempting to support versions of Visual Studio all the way back to Visual Studio 2010 to ensure that everyone can use your new extension. The problem with that is that by doing so, it is no longer possible to use any APIs introduced later than that minimum version the extension supports. Often, those new APIs are important and help improve performance and reliability of both your extension as well as Visual Studio itself.

Here are our recommendations for deciding what versions of Visual Studio to support:

  • Support only the previous and current version of Visual Studio – don’t support older versions if possible
  • Don’t specify an open-ended version range. E.g. [16.0,). Learn more about version ranges.

Your thoughts

What do you think of this checklist? Do you agree with the rules? Please let us know your thoughts in the comments below or on the GitHub repo for the checklist. I hope this makes it a little easier to give your extensions that little extra something that sets it apart from the rest.

The post Checklist for writing great Visual Studio extensions appeared first on The Visual Studio Blog.

Resolve code issues in live apps running in Azure Kubernetes Services with the Snapshot Debugger

$
0
0

With ASP.NET core, my life as a Windows-first developer just broadened dramatically. I can now develop apps without being tied to a single platform. Having spent most of my career as a “Windows only” developer, I am now taking on the task of redesigning a twenty-year-old, IIS based service, so that it could be built on a Mac and hosted on Linux in Azure.

Given these new hosting possibilities one of my pressing concerns was how little I knew about the Linux world in general and, more specifically, what tools and techniques I could use when debugging complex issues in production. Thankfully for me, Visual Studio 2019 Enterprise has expanded support to include Azure Kubernetes Services (AKS) managing Linux containers.

Debug without interruption in AKS

Why Snapshot Debugger? Diagnosing production issues in the cloud can be difficult and time consuming because you may be dealing with issues that only occur at scale or in specific environments, and your favorite debugging tools are often unavailable. Remote debugging your production site is rarely an option because it is serving live traffic, and any action that stops the web process would immediately impact your customers.

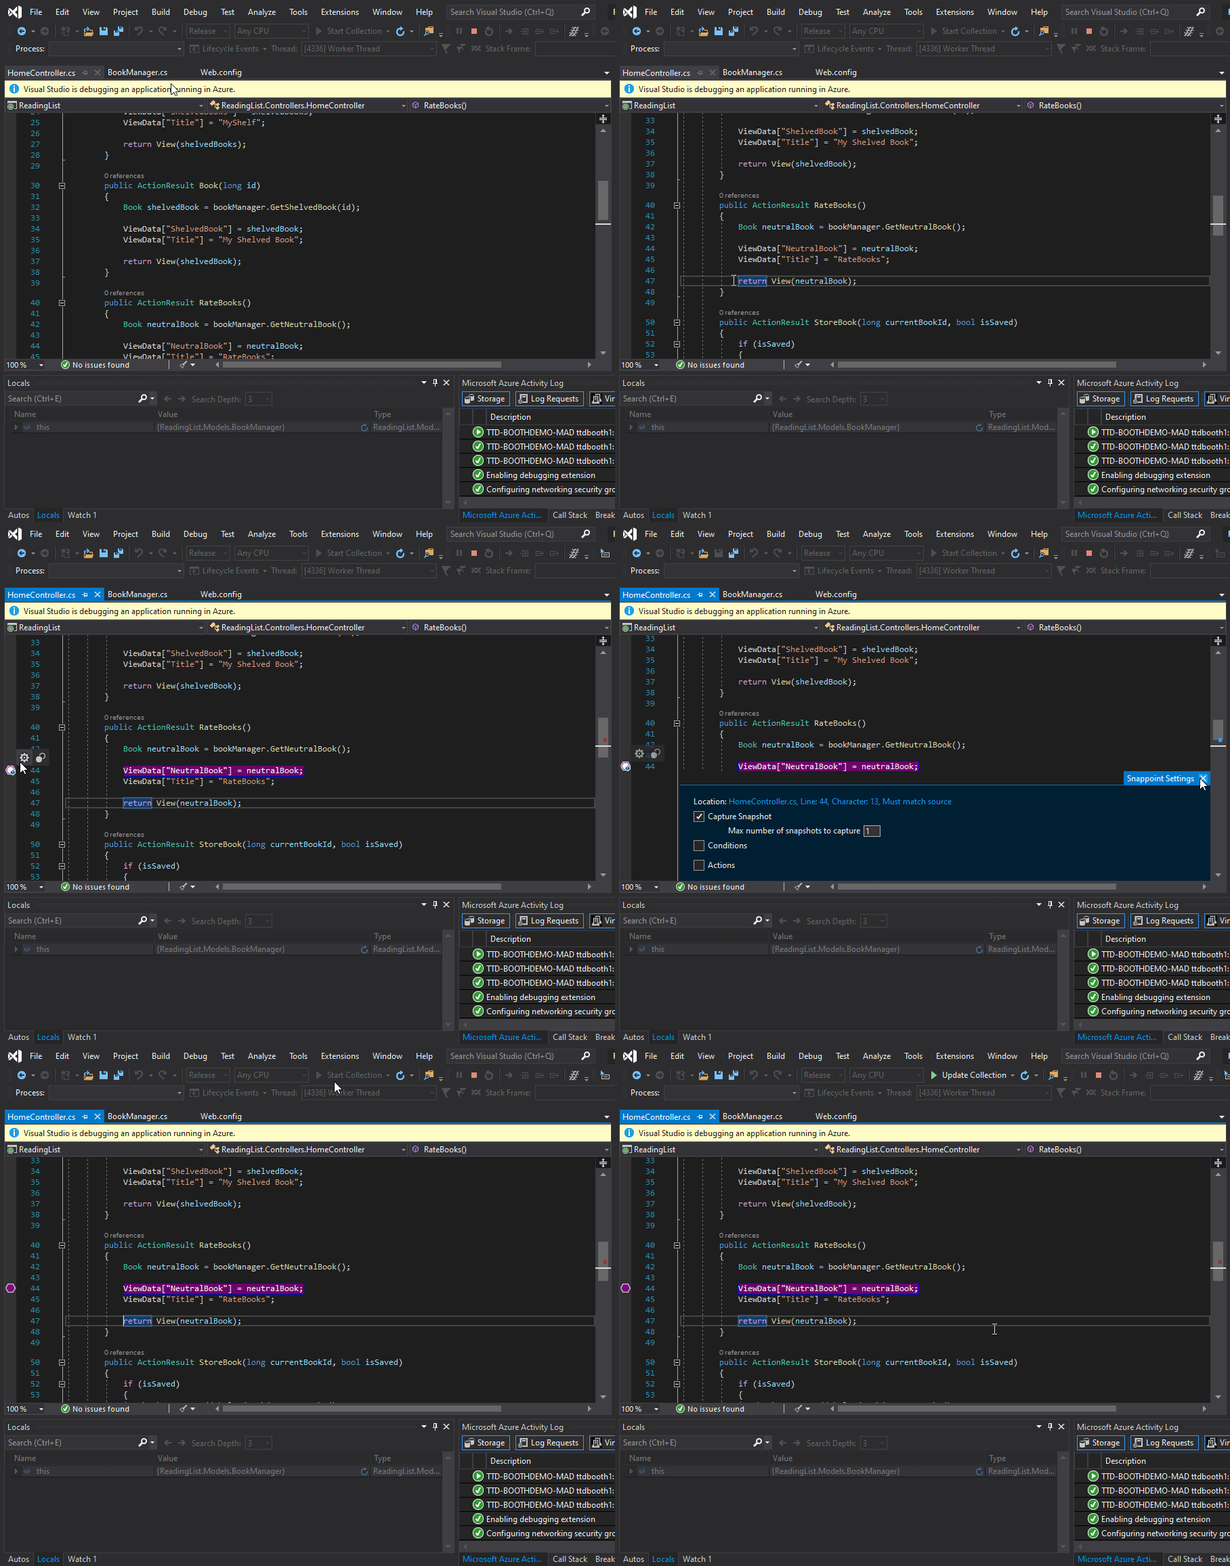
Snapshot Debugger is built for production and works at cloud scale. If you are familiar with breakpoints and tracepoints in VS for debugging local code, then Snappoints and Logpoints are similar but for debugging against apps running in production (without stopping execution). You are able to attach to these snapshots within the familiar and intuitive environment of Visual Studio and analyze specific lines of code using your Locals, Watches and Call Stack windows.

Prepping your Dockerfiles for Snapshot Debugger

Setting up Snapshot Debugger to work with AKS Linux Docker containers requires the following Dockerfile prerequisites:

  • Install Snapshot Debugger prerequisites (libxml2, libuuid, libunwind, bash, unzip).
  • Install Visual Studio Snapshot Debugger components.
  • Set environment variables to load Visual Studio Snapshot Debugger into your .NET Core applications.
  • Install Visual Studio Debugger components.

We have provided a repo containing a set of Dockerfiles that demonstrate the setup on Docker images for several Linux variants. Each file includes the latest supported Snapshot Debugger backend package and sets the environment variables to load the debugger into your .NET Core application.

Linux variant .NET Core
Debian 9 (Stretch) 2.2 Dockerfile (amd64)
Alpine 3.8 2.2 Dockerfile (amd64)
Ubuntu (Bionic) 2.2 Dockerfile (amd64)


Setup Snapshot Debugger for AKS in your ASP.NET Core project

You can use the following instructions to provide Snapshot Debugger support your ASP.NET Core web apps:

  • In Visual Studio 2019, configure your Web application to use Docker
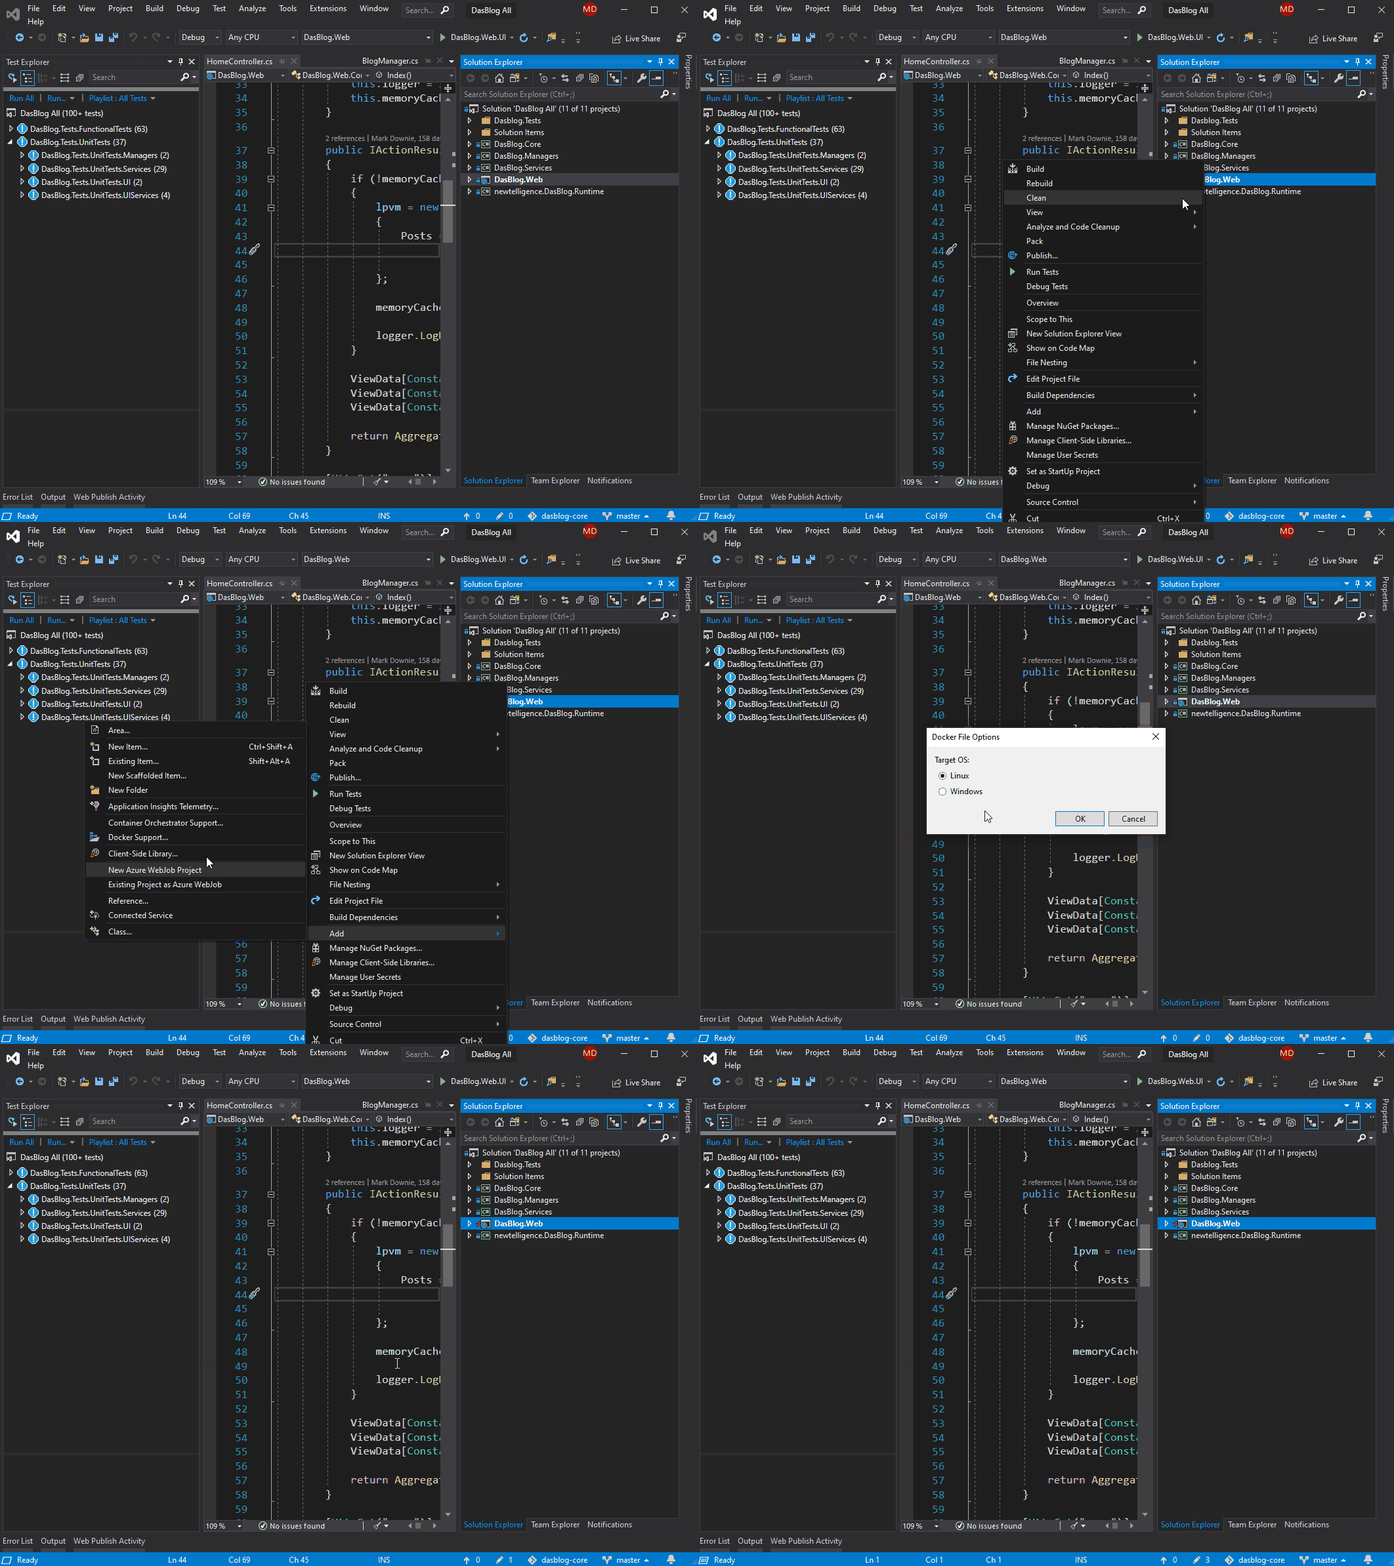
    1. Right-click on the web application Add->Docker Support
    2. Target OS: Linux

Add Docker Support to Visual Studio

  • Select a version of Linux to use from the Visual Studio Snapshot Debugger Docker image repository and merge it with the Dockerfile created for your web application. An example of a merged Dockerfile can be found here.
  • In Visual Studio, rebuild your web solution to create a new docker image.
  • Tag your local image. In the following example I rename “dasblog-core” to “poppastring/dasblog-core”:
    1. docker tag dasblog-core poppastring/dasblog-core
  • Push the newly tagged image to your image repository (using docker in this example).
    1. docker push poppastring/dasblog-core
  • Deploy your application to AKS. More details on deploying to AKS with Cloud Shell and Azure CLI  can be found here. Additionally this sample YAML file sets up a basic deployment and service scenario.
  • Choose Debug > Attach Snapshot Debugger and select the Azure Kubernetes Service your project is deployed to along with an Azure storage account and click Attach. You are now in snapshot debugger mode!
  • In the code editor, click the left gutter to create a Snappoint and click Start Collection to deploy your Snappoint to Azure.

Set a Snappoint

  • Navigate to your service to execute the code represented by the Snappoint.
  • Once your Snapshot has been collected, in Visual Studio click on View Snapshot to view your Locals, Watches and Call Stack windows at that moment in time.

Check out this video where I use Snapshot Debugger to uncover a flaw in my open source code hosted in Azure. You can also find additional details on Debugging live Azure Kubernetes Services here.

Try it out!

We are excited to be able to offer first class production diagnostics support with Visual Studio 2019 Enterprise and Snapshot Debugger. Snapshot Debugging is now supported in Azure Kubernetes Services as well as Azure App Services, Azure Virtual Machines and Azure Virtual Machine scale sets. We encourage you to try out the new capabilities in your solution and we look forward to hearing your feedback and how we can make this feature better.

We’re also working towards adding support for ASP.NET Core 3 and additional Linux versions in the near future, so be sure to follow our Dockerfile repo for updates.


The post Resolve code issues in live apps running in Azure Kubernetes Services with the Snapshot Debugger appeared first on The Visual Studio Blog.

Java on Visual Studio Code July Update

$
0
0

Welcome to the July update of Java on Visual Studio Code!

In this update, we’d like to share a couple new refactoring features, semantic selection as well as some other enhancements we delivered during last few weeks.

Refactoring

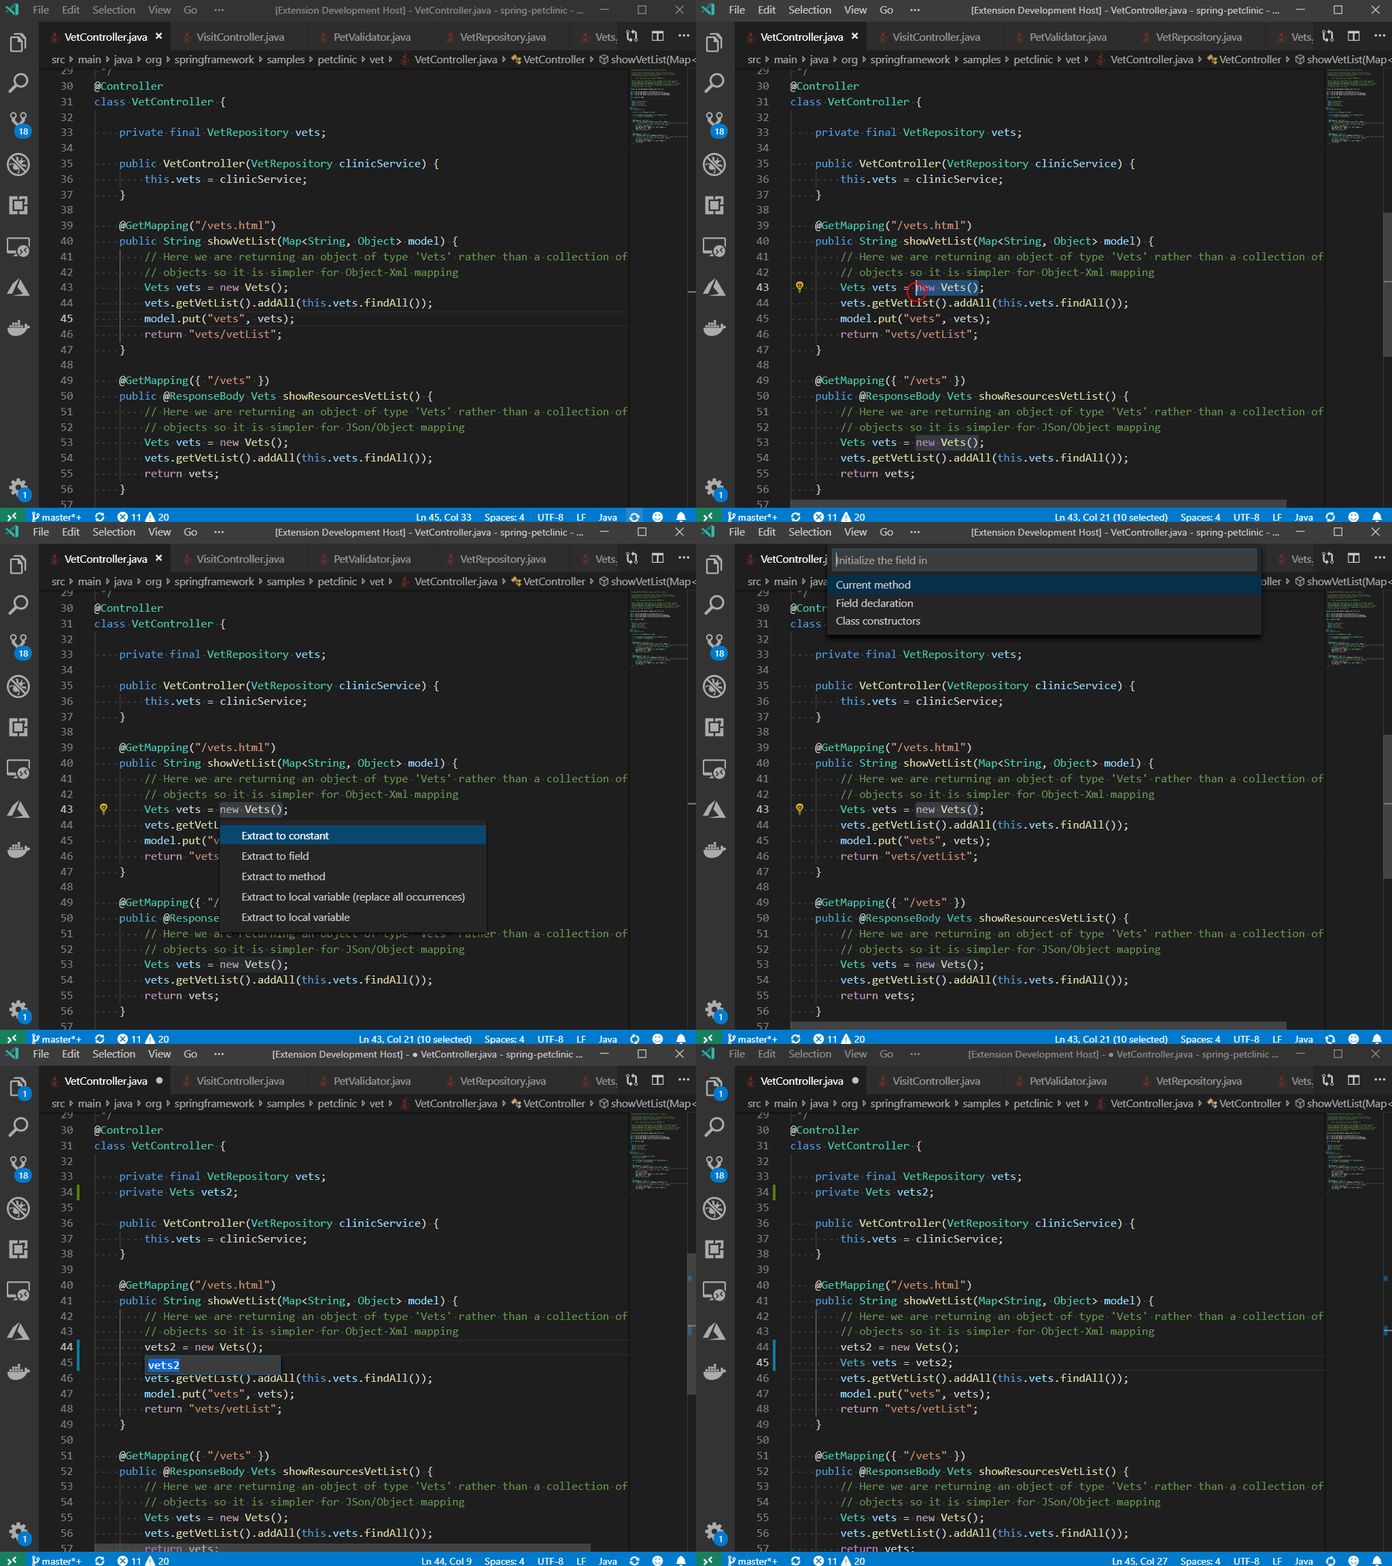
Trigger rename after extract to variable/constant/method

After performing extract to variable/constant/method refactoring, more often than not, we would like to assign the result with a meaningful name. With this feature, you won’t need to perform a separate rename action anymore, all are streamlined in the single refactoring step.

Convert a local variable to a field.

Extract to field is also a very popular refactor. When selecting an expression, you can now use extract to field.

When selecting a variable declaration, it willconvert the variable to field.

Support for semantic selection

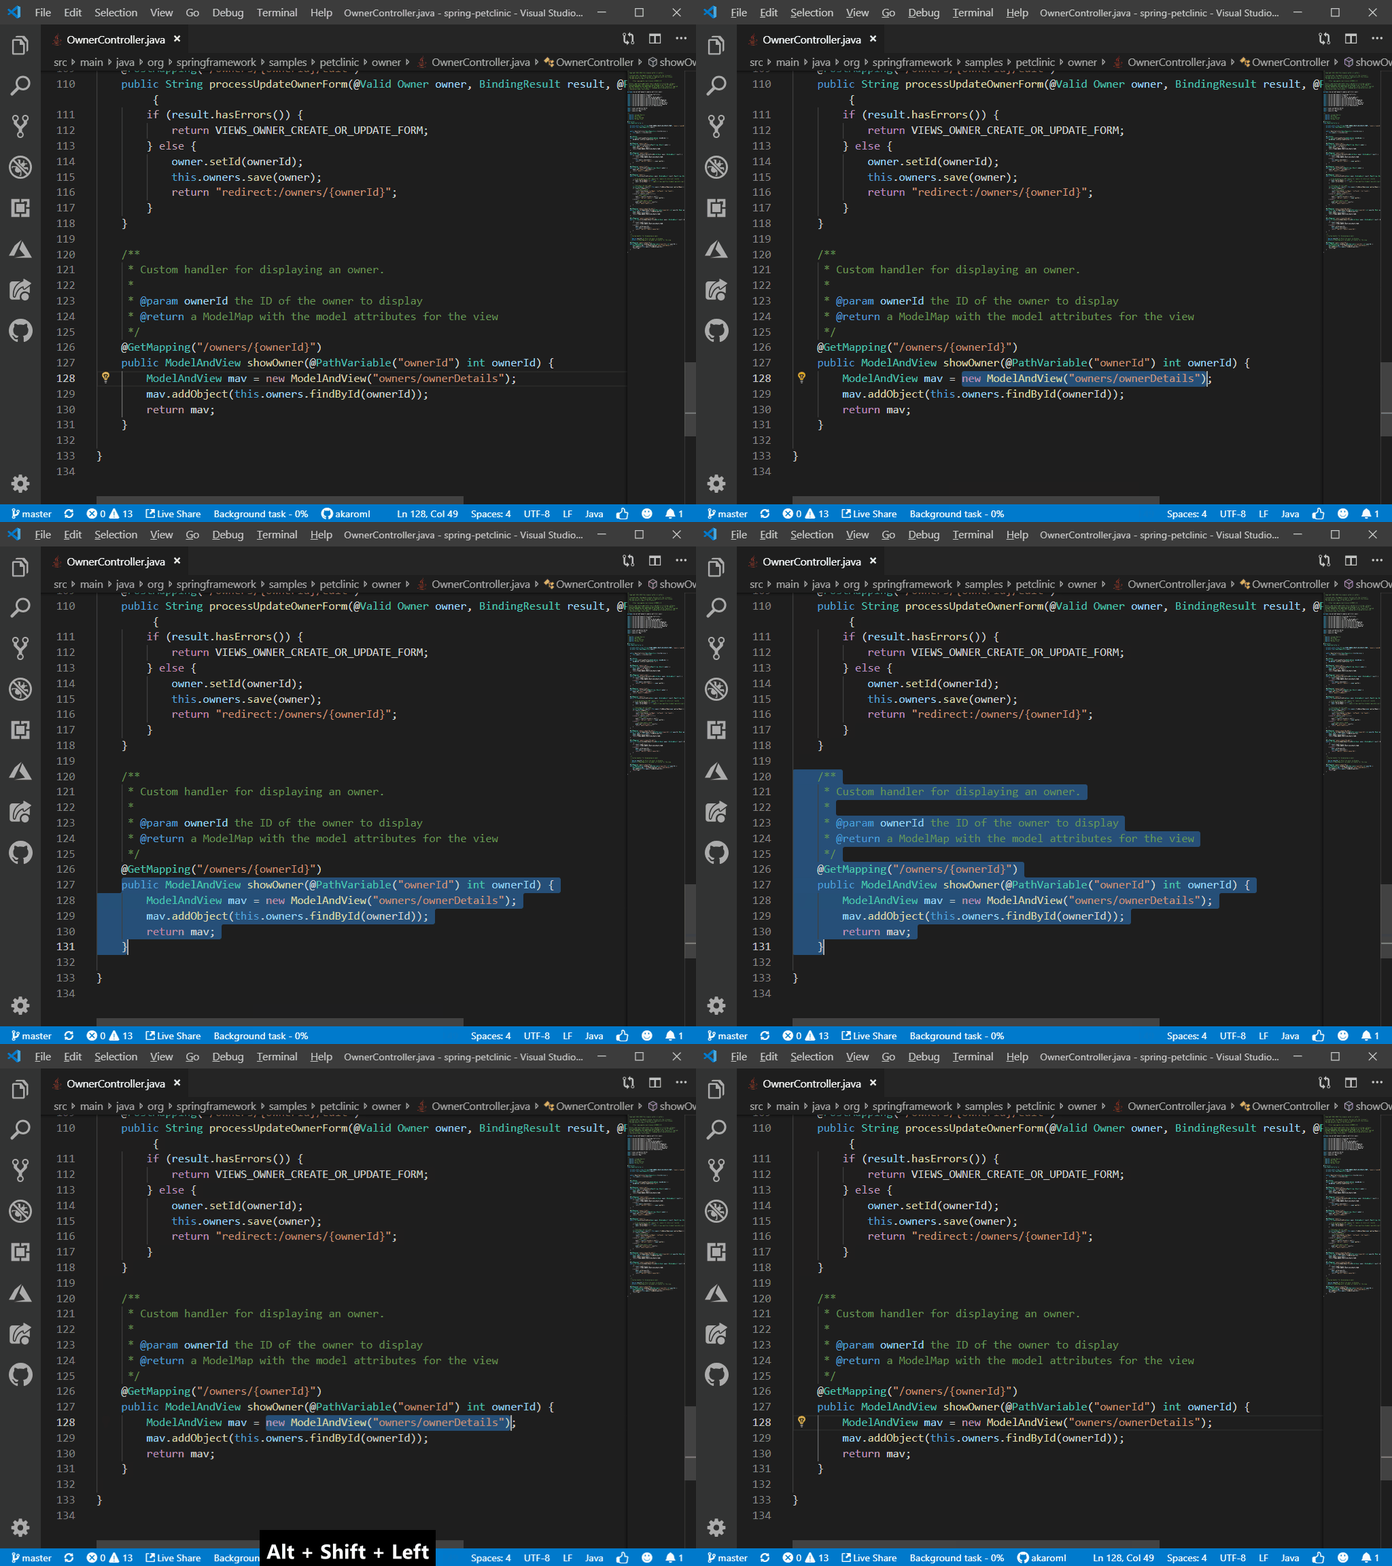
Smart Selection (a.k.a. Semantic Selection) is the new feature added by VS Code and now it understands Java code as well. With that, you are able to expand or shrink the selection range corresponding to the semantic info of the caret position in your code.

  • To expand the selection, use Shift + Alt + →  on Windows, and Ctrl + Shift + Command + → on Mac
  • To shrink the selection, use Shift + Alt + ← on Windows and Ctrl + Shift + Command + ← on Mac

Other enhancements

Maven
  • Maven projects use the latest Execution Environment when source/target is not yet supported.
  • For users who don’t have Maven installed locally, mvn can not be found to create a Maven project from archetypes. Maven extension now embeds a global maven wrapper in the extension, which serves as a fallback if no mvn or project-level mvnw found.
  • Support to select archetype version during Maven project creation.
  • Refresh explorer when config maven.pomfile.globPattern changes.
Gradle
  • Added additional Gradle preferences.
    • java.import.gradle.arguments: arguments to pass to Gradle
    • java.import.gradle.jvmArguments: JVM arguments to pass to Gradle
    • java.import.gradle.home: setting for GRADLE_HOME
Checkstyle
  • Support loading CheckStyle Configuration via Http URL.

Sign up

If you’d like to follow the latest of Java on VS Code, please provide your email with us using the form below. We will send out updates and tips every couple weeks and invite you to test our unreleased feature and provide feedback early on.

Try it out

Please don’t hesitate to give it a try! Your feedback and suggestions are very important to us and will help shape our product in future.

The post Java on Visual Studio Code July Update appeared first on The Visual Studio Blog.

Skill up on Visual Studio 2019 with Pluralsight

$
0
0

With the launch of Visual Studio 2019 in April, we announced having partnered with Pluralsight to provide new training content to help you build your skills with Visual Studio 2019. We’re thrilled to announce that all 10 courses, spanning over 14 hours of content in the Visual Studio 2019 Path on Pluralsight, are now available. You’ll also be able to benchmark your current skill level with a Pluralsight Skill IQ assessment, which will offer course recommendations.

You can find the 10 courses under the following categories to help you quickly find the right content – whether you’re a beginning developer or experienced professional:

Beginner

These courses are designed to help you master the most common activities in Visual Studio. If you have used prior versions of Visual Studio, check out the What’s New in Visual Studio 2019 course to quickly get up-to-speed on all the new features. If you are new to Visual Studio, you will want to check out the Getting Started with Visual Studio 2019 course. Then, take your debugging skills to the next level with a deep dive on debugging in the last course in this category.

Intermediate

Refine your skills with the courses in this section as you learn to manage your Git repositories using Visual Studio. You can look forward to learning about the testing features available in Visual Studio, the code analysis features, and how Visual Studio helps you migrate solutions to Azure.

Advanced

Set yourself apart with the knowledge you will gain in this section. In just over half an hour, you can learn how to use Visual Studio Live Share. Learn about the advanced debugging features and how to build cloud native solutions in Visual Studio.

Get started today using your Visual Studio Subscription

If you’re a Visual Studio subscriber, you’ll get up to 6 months of free access to Pluralsight included in your subscription. You can activate this benefit in the My Visual Studio portal, which will give you access to the Visual Studio 2019 path and many other courses on Pluralsight. Make sure to check the Pluralsight benefit documentation for more information on activation, eligibility, and frequently asked questions.

The post Skill up on Visual Studio 2019 with Pluralsight appeared first on The Visual Studio Blog.

Visual Studio 2019 for Mac version 8.2 is now available (and a Preview for 8.3)

$
0
0

Today we are announcing the release of Visual Studio 2019 for Mac version 8.2, as well as Preview 1 of version 8.3. We have a lot of new features and updates in both releases that we’d like to share with you!

If you already have Visual Studio for Mac 2019 installed, you can update to either of these versions using the integrated updater. You can view the release notes for each of these releases at the Release Notes page. You also may be interested in checking our Roadmap to get a sense of our future plans. We hope you have a great experience with these new features, but if you do run into any issues please use Report a Problem to make us aware of them.

Visual Studio 2019 for Mac version 8.2

The 8.2 release has a lot of great features that are now ready for you to use. One big area we continue to invest heavily on is the code editing experience. Let’s start with the improvements to the editors, and then go from there.

Over the past few weeks, we have been working hard to improve the different editor experience in Visual Studio for Mac. In this release, we are including a new editor in the IDE for XAML and AXML files. These editors are the same as those available in Visual Studio on Windows, but the implementation uses the Cocoa APIs to provide a native experience on macOS.

C# Editor

In version 8.1 of Visual Studio 2019 for Mac, we introduced the new C# editor and we continue to add features to further improve the code editing experience in Visual Studio for Mac. With the latest release, we are introducing IntelliSense Type Filtering as well as the ability to include import items in your IntelliSense completion list.

IntelliSense Type Filtering allows you to better organize your completion list to only include the types you are looking for. For example, if you only want to see classes, either clicking the class icon or hitting the hotkey for classes ( ⌥ + C) will limit the results to only classes. You can also include multiple filters.

We’ve also added the ability to add import items to the completion list for IntelliSense, which will populate your list with types from packages which are not yet imported into your project.

Adding a class or other type from the list will then automatically add the import statement to your project, allowing you to focus solely on writing code.

type filtering

XAML Editor

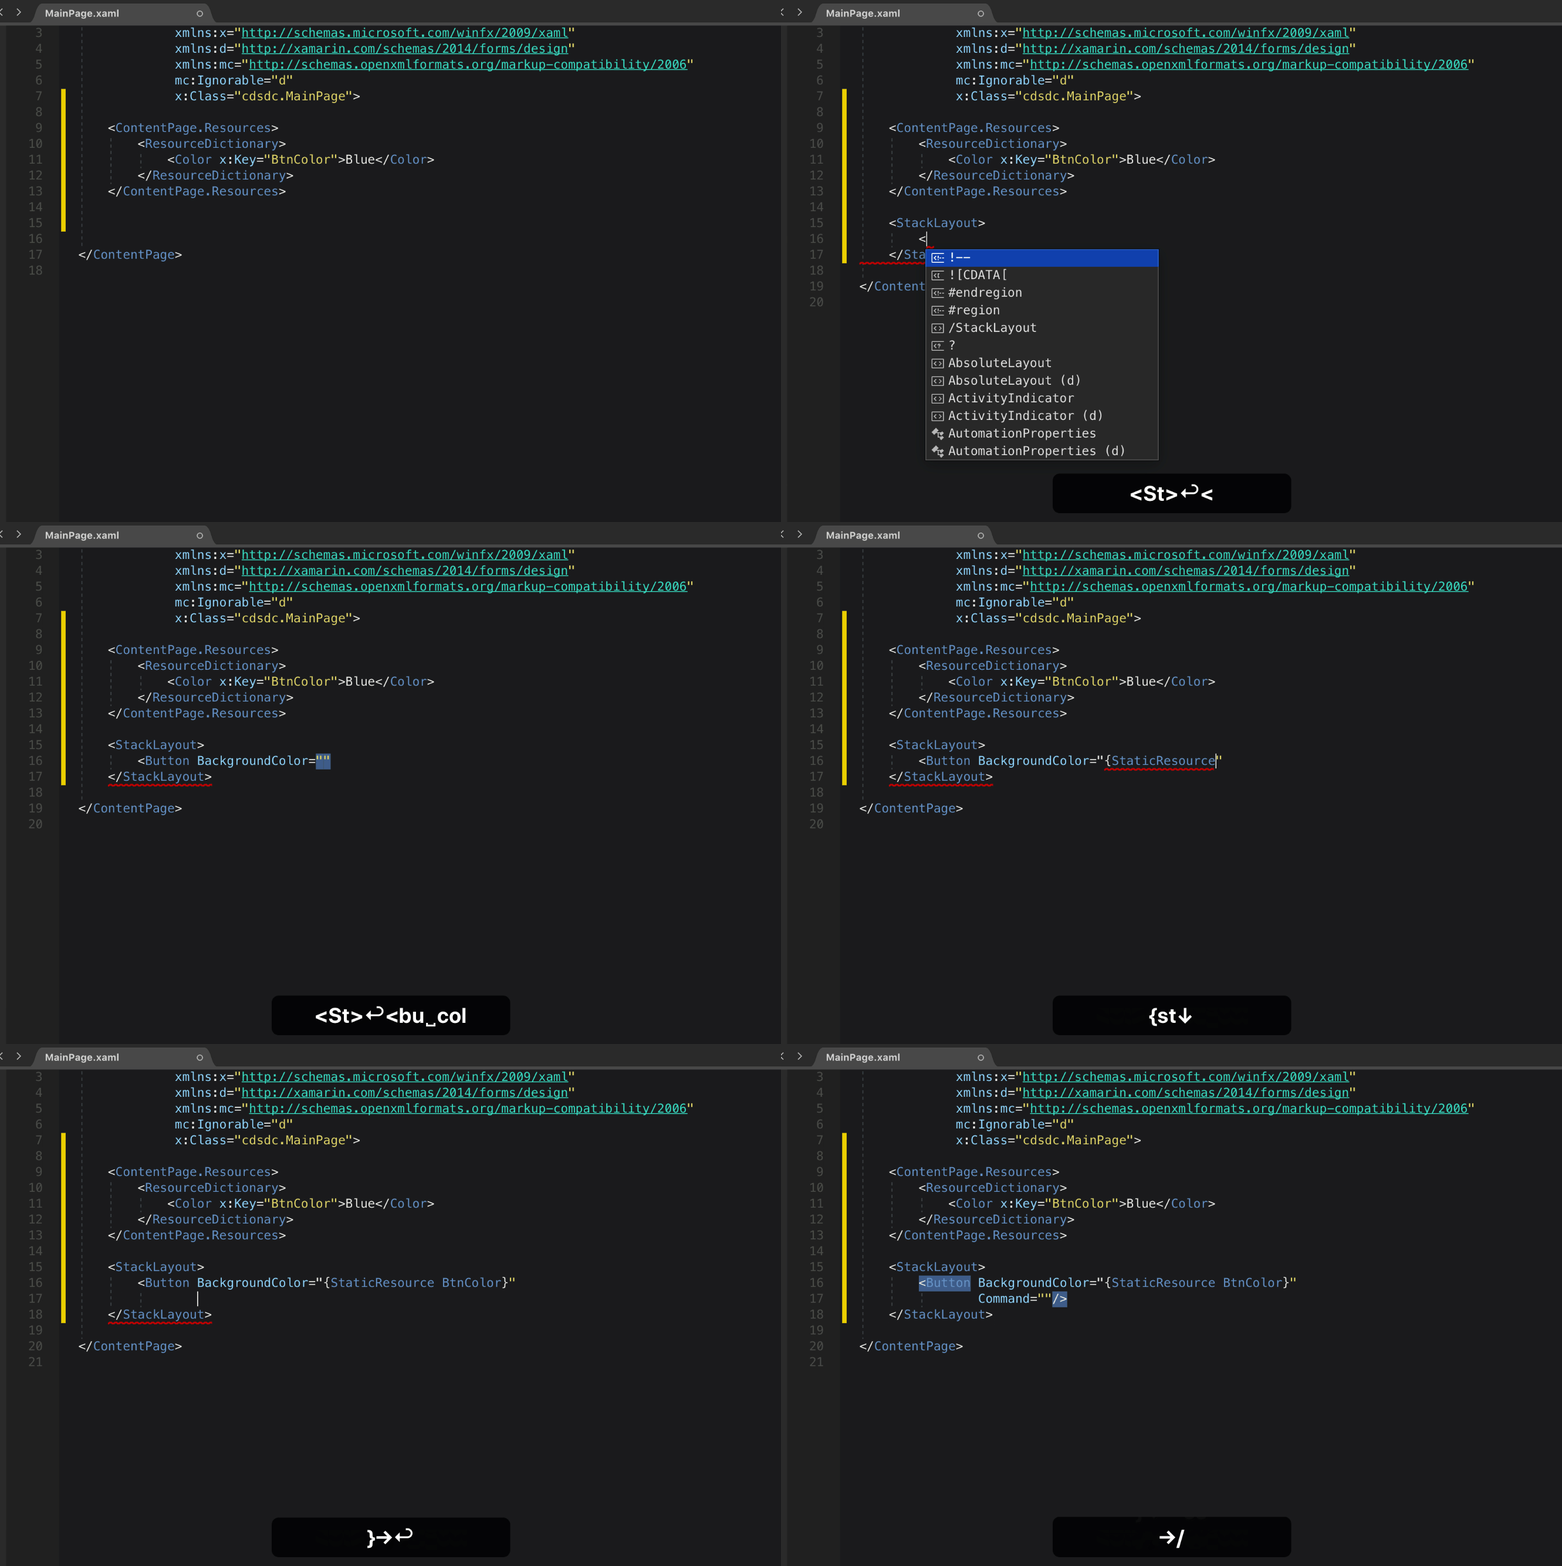
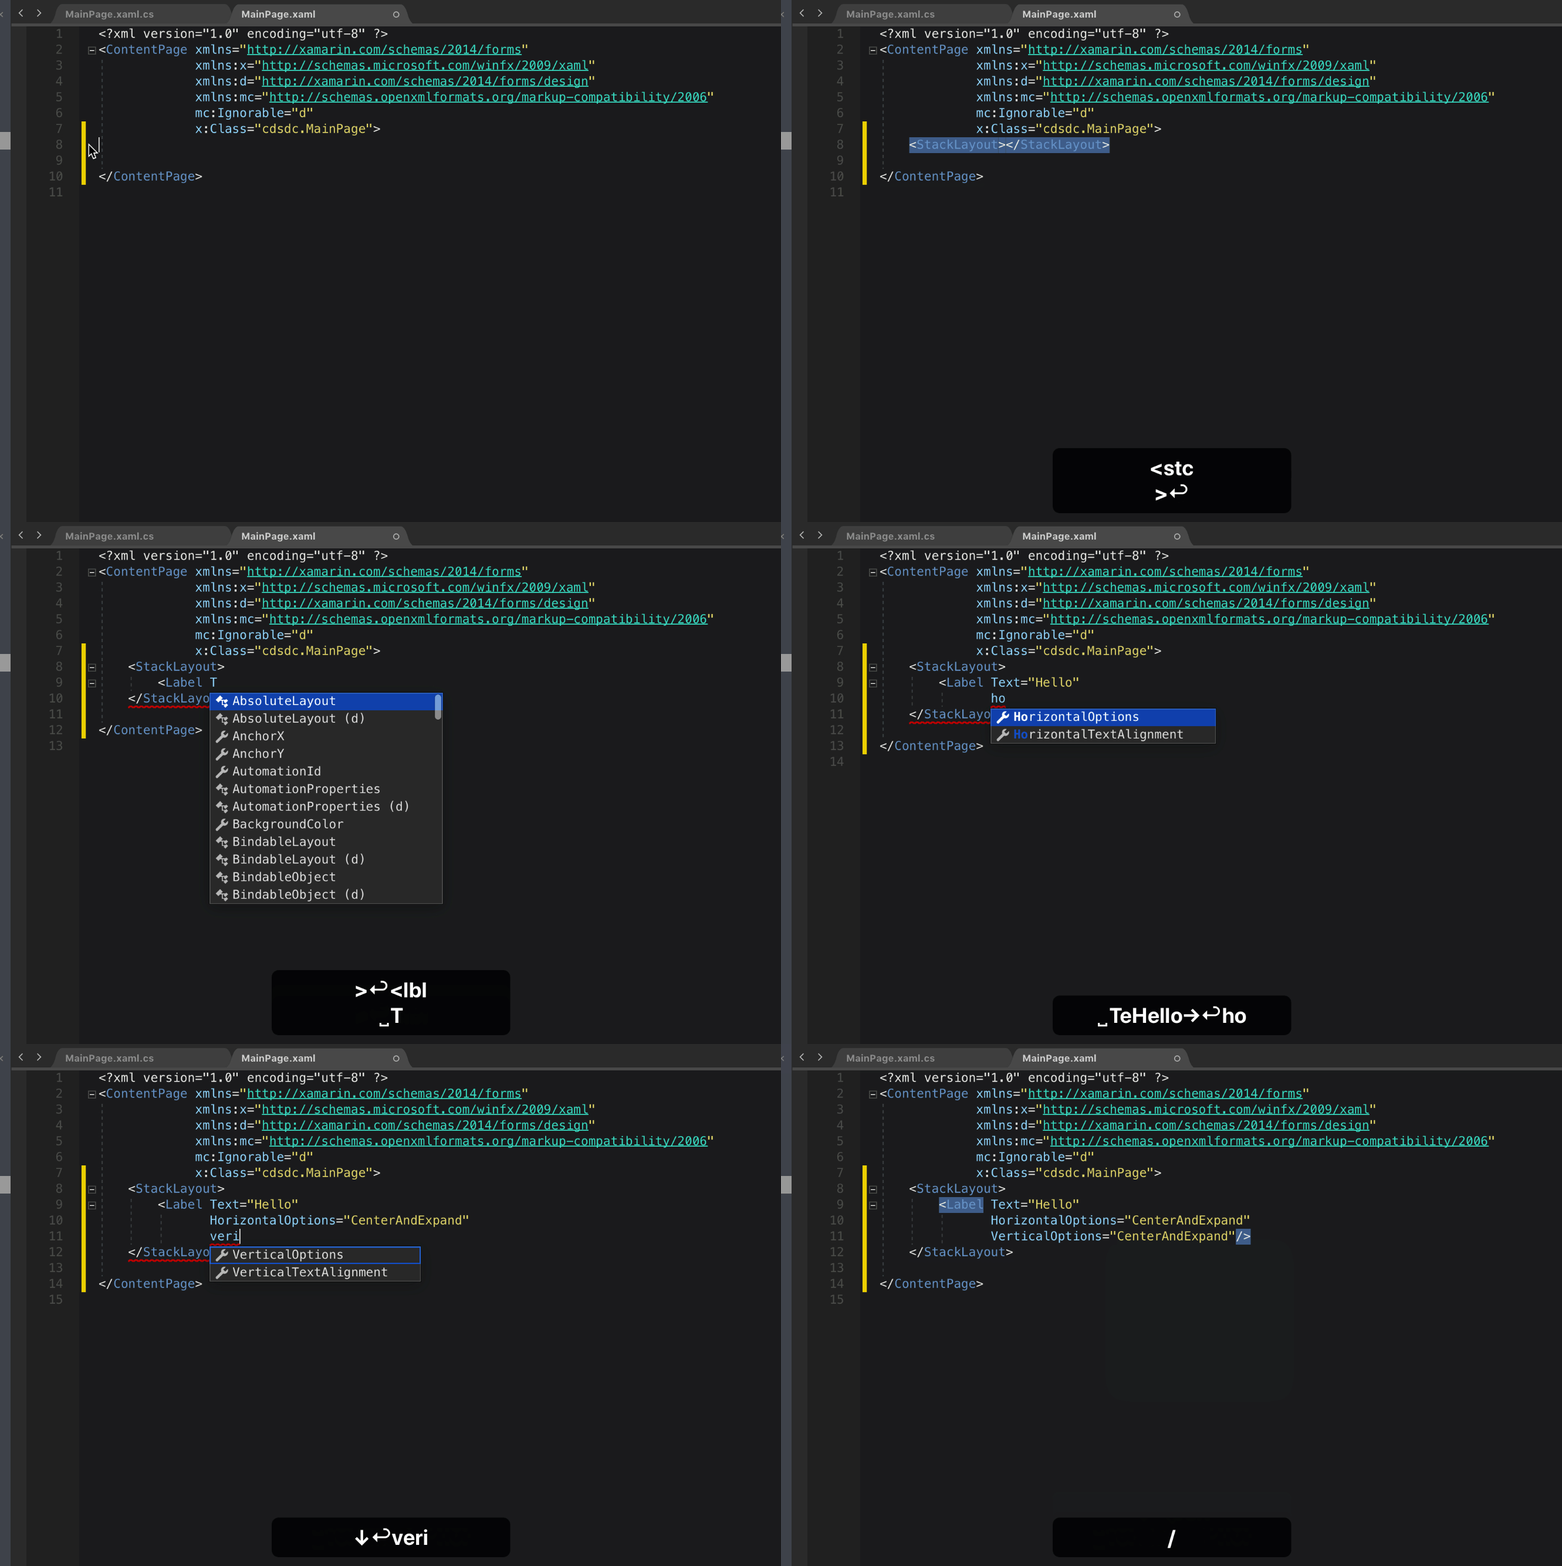
This update includes some notable XAML improvements in the following areas: IntelliSense, performance, reliability, and linting. In the animated gif below you can see the new experience for XAML files.

xaml editor

By adding the new XAML editor, we also included a new XAML Language Service. This is the same language service that is found in Visual Studio. One benefit of this new language service is an improved experience for matching capabilities. As an example, it now supports fuzzy, substring and CamelCase matching. This should help you author your XAML faster and more accurately.

  • Fuzzy Matching: Typing any portion of a string will provide a list of matching and like matches. If you type “stck”, StackLayout will still appear as an option.
  • Substring Matching: Matches will be listed when you type a part of a string, even if it is in the middle of the string. This is a great feature if you recall a section of a command, but not the entire command. Typing “Lay” will match “StackLayout” along with any other string which contains “lay”.
  • Case Insensitive Matching: If you can’t recall the exact casing of a string you’re trying to find, case insensitive matching will ensure you can still find what you’re looking for. With support for this kind of matching, typing “stack” will match to “StackLayout”.

In addition to these updates, you’ll also see a much-improved auto-complete experience for XAML files.

AXML Editor

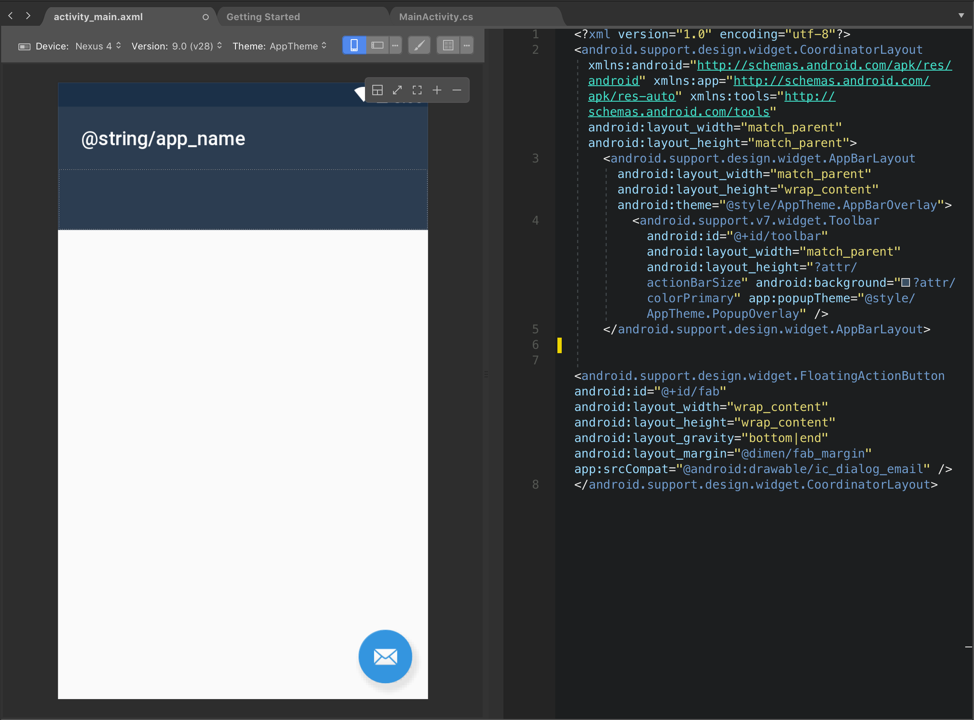
When developing Android applications, you often find yourself editing .axml files. These files are used to define the Android application’s UI and resources. In this release, we have also updated the editor for these files. The enhancements are similar to those in the XAML editor. Some specific improvements include: IntelliSense, semantic editing of these files, as well as support for go-to-definition. Here is a screenshot of this new editor:

vsmac-axml-editor

Support for .NET Core 3.0 and C# 8.0 Preview

The team has been hard at work to add support for .NET Core 3.0 Preview and C# 8 into Visual Studio for Mac. With this release you’ll find that we officially support .NET Core 3.0 Preview and C# 8. To get started, after installing Visual Studio for Mac, you will need to install a preview of the .NET Core 3.0 SDK. Please note that currently the .NET Core 3.0 SDK is not bundled with the IDE, but we will include it in a future release. After installing the SDK and restarting Visual Studio for Mac, you can create, build, run, debug and publish .NET Core 3.0 applications.

In addition, to enable C# 8 in .NET Core 3.0 SDK, you will need to use the Project Options in Visual Studio for Mac. In Project Options, go to Build > General > Language Options and set the C# language version to Version 8 as per the image below

vsmac-project-options-csharp8

When you’re editing C# 8.0 files in Visual Studio for Mac all the existing functionality will work including IntelliSense and Quick Fixes. For more info on what’s new in C# 8.0, head over to the docs What’s new in C# 8.0.

Visual Studio 2019 for Mac version 8.3 Preview 1

For the first preview release of 8.3, we are focusing on .NET Core improvements. We have several exciting features to share with you here. We would love it if you can try this out and give us some feedback regarding these new capabilities.

Publish support for .NET Core Console and .NET Standard Library Projects

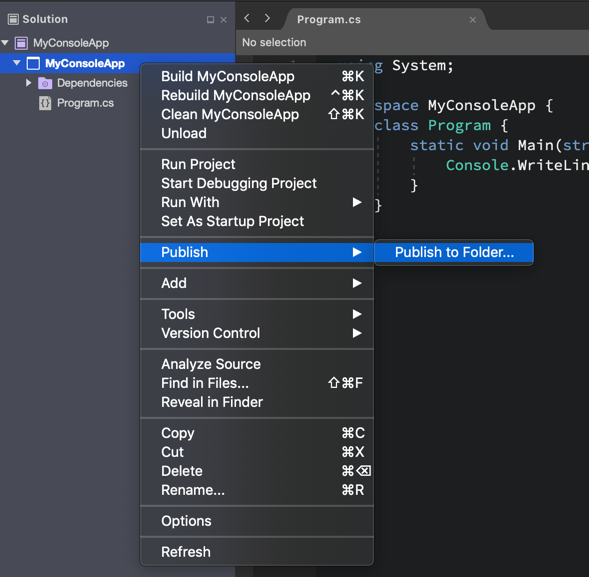
In a previous release we added the ability to publish an ASP.NET Core project to a folder. In this preview we added support to publish .NET Core Console and .NET Standard Library Projects. For more information on how to use this feature, head over to the docs. Here is a screenshot of this new option when working on a console application.

publish-console-app

After using the Publish to Folder feature, a publish profile is automatically created and becomes available in in the fly-out menu. You can create multiple different profiles, and each will be displayed in the fly-out menu for easy access.

ASP.NET Core: Support for launchSettings.json

When developing ASP.NET Core applications, you can configure how the application is launched for development purposes using the lauchSettings.json file. For more info on this file, see this section of the environments doc. In launchSettings.json, you can configure the URL for the app to listen on as well as environment variables that are applied on run or debug. With this update, we make it easier for you to collaborate on projects with others that may not be using Visual Studio for Mac. Visual Studio, Visual Studio Code and the dotnet CLI (Command Line Interface) already support this file.

ASP.NET Core: File Nesting support

In this preview, we are also adding automatic File Nesting for ASP.NET Core projects. The auto file nesting rules applied are the same as what you find in Visual Studio. With file nesting enabled, you can focus better on the files that you edit most frequently. Generated files, and less frequently edited files will be nested under other related files. Check out the screenshot of the Solution Pad showing the nesting behavior.

file nesting

In a future release we will add the ability to disable automatic file nesting, for those that prefer to view the files as a flat list.

Download and try today

If you haven’t already, please download and try out the 8.2 release today! We hope that this release will allow you to develop your applications more efficiently and that it will give you a better experience overall. We will continue our work on improving the other code editors in the IDE as well as the features we planned on our roadmap.

We would also love for you to download and try out the 8.3 Preview.

If you run into any issues with the 8.2, or the 8.3 Preview release, please use the Report a Problem feature in the IDE.

report a problem context menu

Finally, make sure to follow us on Twitter at @VisualStudioMac and reach out to the team. We look forward to hearing from you. Alternatively, you can head over to Visual Studio Developer Community to track your issues, suggest a feature, ask questions, and find answers from others. We use your feedback to continue to improve Visual Studio for Mac 2019, so thank you again on behalf of our entire team.

Download

The post Visual Studio 2019 for Mac version 8.2 is now available (and a Preview for 8.3) appeared first on The Visual Studio Blog.

Visual Studio 2019 version 16.2 Generally Available and 16.3 Preview 1

$
0
0

Today we are making Visual Studio 2019 version 16.2 generally available, as well as Preview 1 of version 16.3. You can download both versions from VisualStudio.com. If you already have Preview installed, you can alternatively click the notification bell from inside Visual Studio to update. We’ve highlighted some notable features below, but you can also see a list of all the changes in the current release notes or the Preview release notes.

What to expect in Visual Studio version 16.2

Test Explorer

Test Explorer provides better handling of large test sets, easier filtering, more discoverable commands, tabbed playlist views, and customizable columns to fine-tune test information displayed.


This image shows the expanded Test Explorer .
Improved Test Explorer


.NET Developer Productivity

Version 16.2 supports debugging JavaScript in the new Microsoft Edge Insider browser for ASP.NET and ASP.NET Core projects.  To do this, install the browser, set a breakpoint in the application’s JavaScript and start a debug session.

There are improvements in .NET developer productivity as version 16.2 brings back the Sort Usings refactoring option. Developers also have the ability to convert switch statements to switch expressions and also generate a parameter for a variable from the Quick Actions menu.

In addition, there is an enriched experience of creating and configuring Azure SignalR services when enabling real-time communication in web applications.

C++

In the C++ space, changes include Clang/LLVM support for MSBuild projects, incremental build for Windows Subsystem for Linux, and a new C++ quick action to install missing packages in CMake projects using vcpkg.

CMake projects using vcpkg
C++ quick action to install missing packages in CMake projects using vcpkg


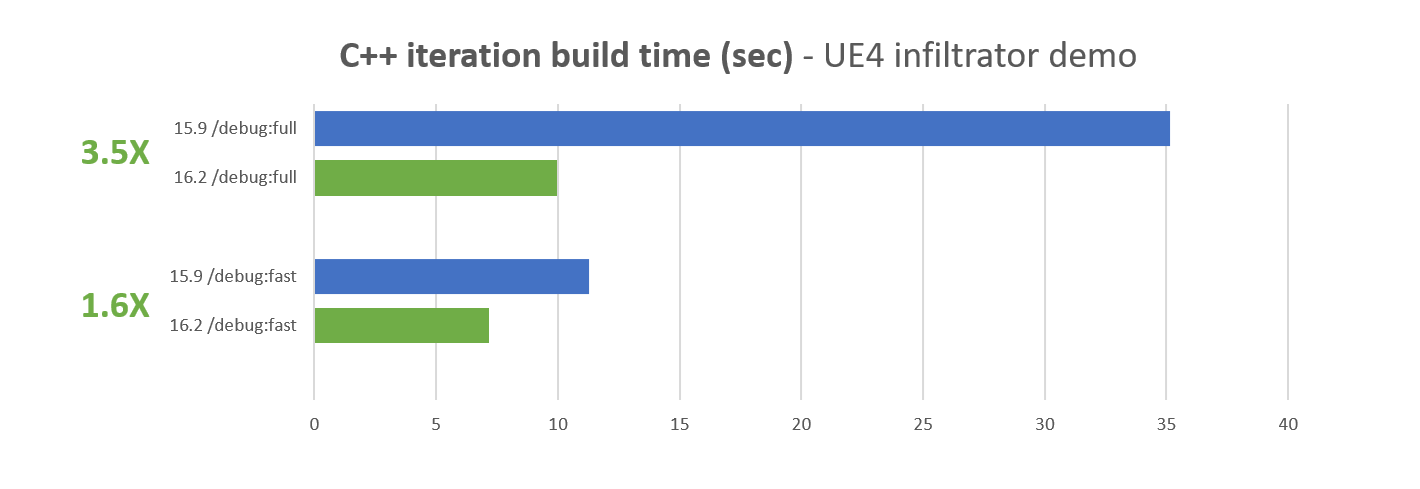
Changes in the throughput of the C++ linker significantly improve iteration build times for the largest of input.  This should result in an improvement to all codebases.  Internal measurements taken on the C++ team saw 2X ranges for /debug:fast and /incremental, while /debug:full typically ranged from 3X to 6X and up.  More information is available on the C++ Team Blog.

C++ Iteration Build Time Demo
Improvements to the C++ linker.


Usability

To enhance usability, users who opted to hide their toolbars in Visual Studio receive additional vertical space. Upon hiding all toolbars, the Live Share, Feedback and Badge icons are moved to the top.  The steps to restore the toolbar are View > Toolbars and select the desired toolbar.

Adding and removing toolbar selections
Increased usability of the toolbar


A list of preview features is findable under Tools > Options > Environment > Preview Features.  This page also allows users to learn about upcoming features as well as participate in surveys to provide additional perspectives on future changes.

Looking forward to 16.3 Preview 1: .NET Core 3.0 Preview and C++

.NET Core 3.0 Preview

Version 16.3 Preview 1 has added support for .NET Core 3.0 Preview.  Additional features include .NET Core project templates like Worker and gRPC for building microservices or Blazor for building client web apps using C#.

Improved Search

Because the ability to search in Visual Studio is a key driver for discoverability, there is an added search box in the start window for users to quickly locate recently used projects, solutions, and folders. The most recently used code containers also integrate with Visual Studio global search so they can be found there as well. This is a direct result of it being one of the highest voted feature requests.  Thanks for all of the feedback!

Improved search feature example

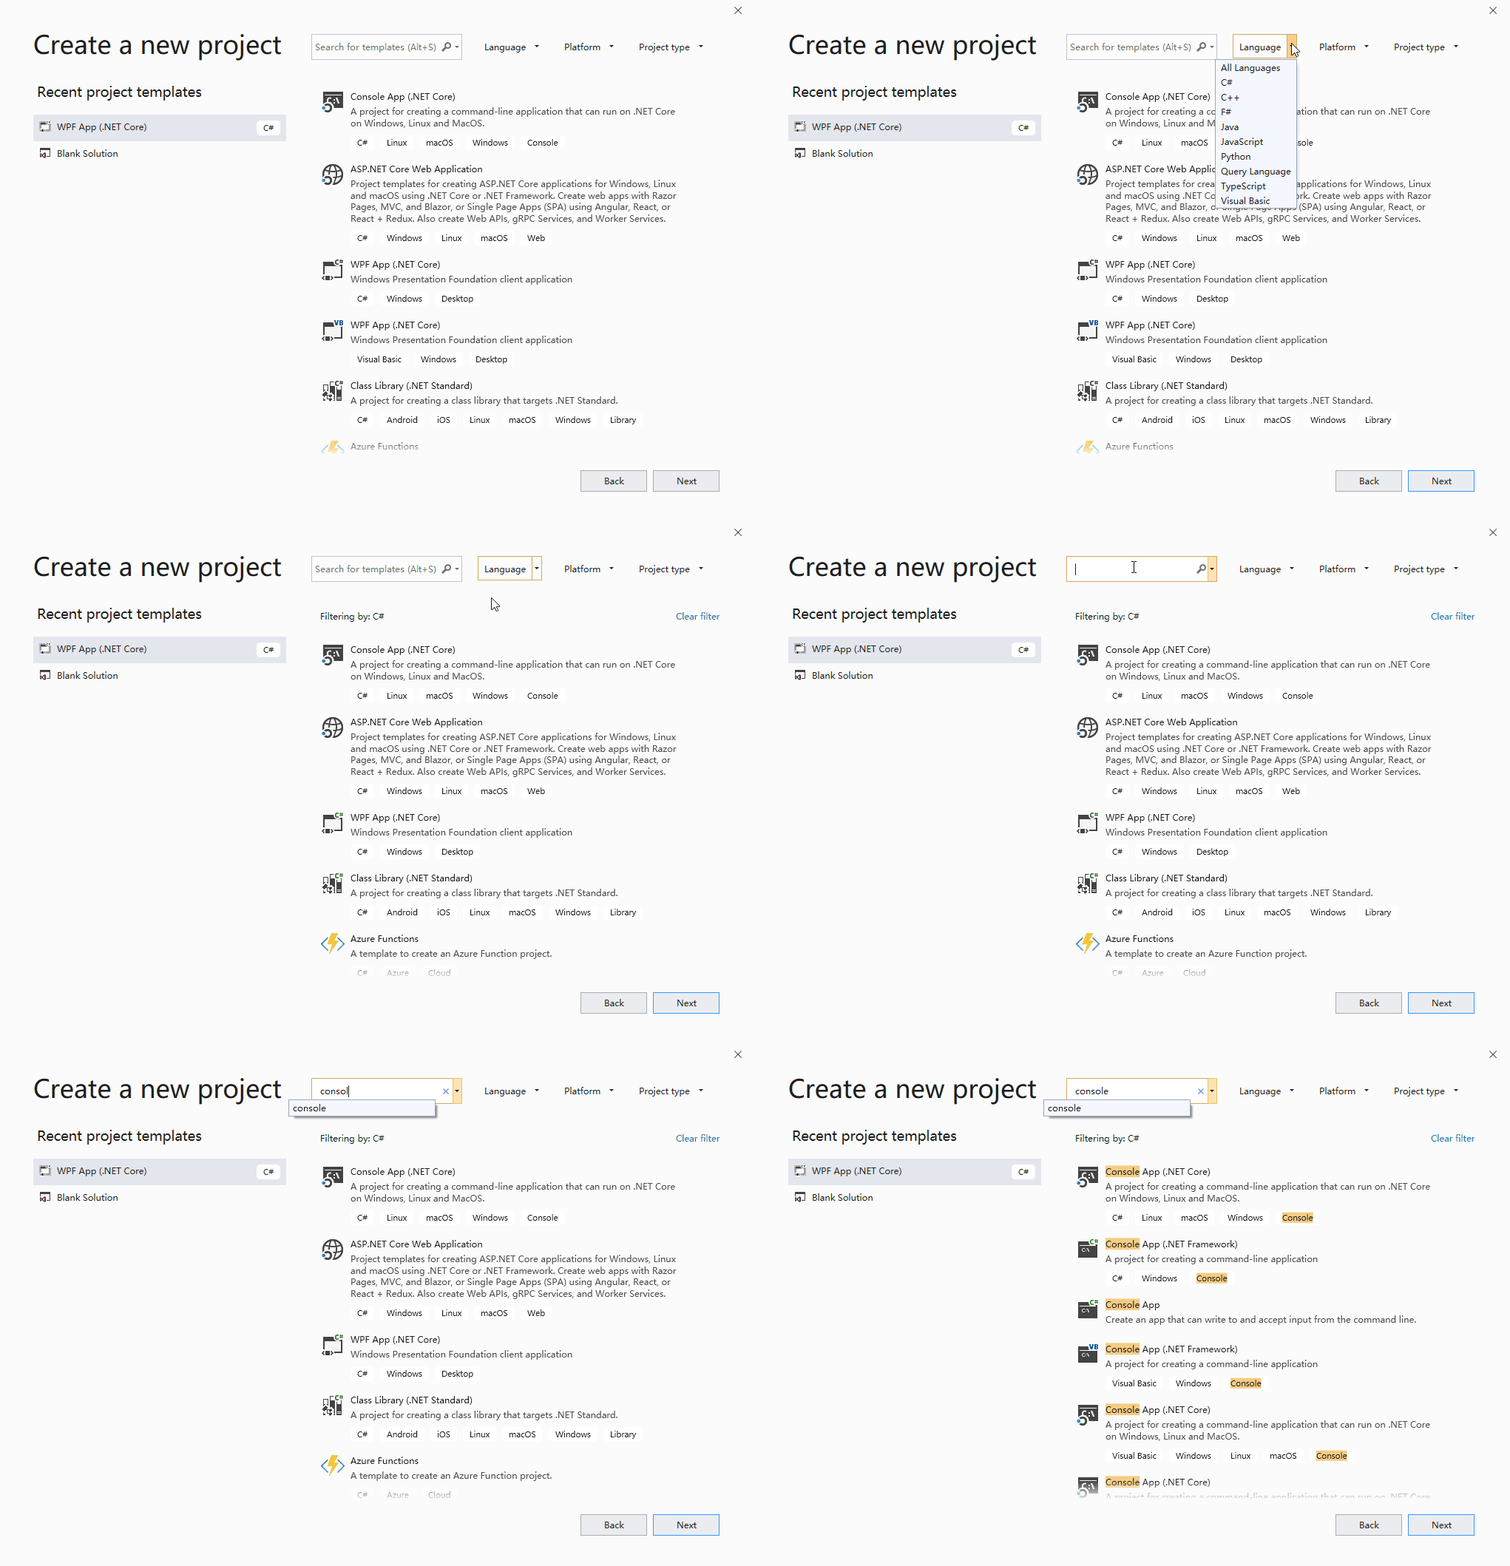
Finding the right project template should be easier than previous iterations.  Template search in the New Project Dialog now supports fuzzy search allowing for typos and plurals while also highlighting matching keywords and ranking results based on relevance.

Recent project search example

Visual Studio will now pick up any updates made to the templates via the .NET CLI and, as a result, the two are kept in sync. New tooling is included in support of the new templates.  Examples include publishing worker projects to container registries and managing Open API & gRPC service references.

This version of Visual Studio also includes many productivity improvements. C++ projects now have IntelliSense member lists filtered based on type qualifiers. Developers have the ability to toggle line comments with a quick command (Ctrl + K, Ctrl + /). .NET projects load more asynchronously and renaming classes in the editor can also rename the containing file. Furthermore, debugging and profiling includes better Edit and Continue support.  There is also auto-expanding of the hot path in the performance profiler and the ability to move both forwards and backward in the profiler during an investigation.

Give it a try today and let us know what you think!

Everyone is encouraged to update to Visual Studio 2019 version 16.2 by downloading directly from VisualStudio.com or updating via the notification bell inside Visual Studio. An alternative option includes the Visual Studio Installer for updates. Try out the 16.3 Preview 1 release by downloading it online or updating from within the IDE from a previous Preview Channel release.

Most noteworthy, Visual Studio teams are continuously driven by feedback, so we look forward to hearing what you have to say about our latest releases. If you discover any issues, make sure to let us know by using the Report a Problem tool in Visual Studio. Additionally, you can head over to Visual Studio Developer Community to track your issues, suggest a feature, ask questions, and find answers from others. We use your feedback to continue to improve Visual Studio 2019, so thank you again on behalf of our entire team.

The post Visual Studio 2019 version 16.2 Generally Available and 16.3 Preview 1 appeared first on The Visual Studio Blog.


Status on Visual Studio feature suggestions

$
0
0

Visual Studio receives over 500 feature suggestions from customers every month on the Developer Community website. Handling that amount is a huge effort and we’d like to share with you how we handle this volume and the steps that we take to respond to them all. What happens to suggestion tickets after they’re opened, how many make it into Visual Studio, and what happens to the rest? Let’s find out.

Let’s start with the breakdown of incoming suggestion tickets in the past 6 months and what state they are in today. We find that around 15% of the suggestions are challenging to act on, and they typically fall into the following buckets.

11% – Closed as duplicate
3% – Closed due to missing info from customer
1% – Closed because they were not suggestions for Visual Studio

We do our best to follow up with customers to get more information where we can and move them into the next stage. For example, when making a suggestion to add a command to a context menu, it is important for us to know which context menu you meant.

That leave us with 85% left which are currently moving their way through the system. Here is the status of those tickets currently in our system:

40% – Closed for a number of reasons (more info below)
20% – New, not yet processed or triaged
28% – Under review and gathering votes and comments
3% – Awaiting more info from customer
3% – On roadmap (under development)
6% – Completed and released

Now let’s dig in and see what’s behind those numbers.

From New to Under Review

We have a filtering system that automatically routes incoming suggestions to the appropriate team within the Visual Studio organization. Within my team, we have established a weekly process to triage these routed suggestions and review status. The process we follow looks like this:

  1. Does this bug belong to my team?
    • If not, move it to the right team
  2. Is the suggestion a duplicate of an existing suggestion?
    • If so, close it and transfers all votes to the original ticket (happens automatically)
  3. Does the suggestion contain all needed information?
    • If not, ask customer for more information
  4. Was this suggestion already completed or in active development?
    • If so, close it as either Completed or On Roadmap
  5. If it made it this far, mark it Under Review to gather votes and comments for 90 days

By following these steps, most suggestions end up Under Review as we gather more data, refine any repos or requirements. These make up over a quarter of all suggestions.

Every time someone adds a new comment to an existing ticket, we receive an email, so we know what’s going on with each ticket along the way, and can respond if needed.

Moving on from Under Review

Within 90 days, we attempt to address items that are still marked Under Review. Our options are:

  1. Mark it as Completed because we implemented the suggestion
  2. Mark it as On Roadmap because it’s in active development or will be very soon
  3. Close it because it didn’t get any votes and/or we’re not able to prioritize it

When we implement a suggestion, we mark it Completed or On Roadmap. Currently, approximately ~10% of the incoming suggestions go on to be implemented or added to the roadmap.

But what about the ones that don’t?

Reasons for closing suggestions

Most suggestions are good suggestions and it’s always painful to close them. Especially because a lot of them are some that we personally would like to see implemented. As developers, you know that time and resources are finite, which means we can’t implement all suggestions.

The reason we close suggestions is a mix of multiple factors, such as:

  1. It didn’t receive any votes after 90 days as Under Review
  2. It got a few votes, but an implementation will not fit within our available resources
  3. It involves areas in Visual Studio that see little usage by our customers
  4. It has negative side-effects such as degraded performance, accessibility etc.

Over a third of all suggestions end up closed due to one or more of the above reasons.

On the positive side, even for some suggestions that we close, we do move the capability into an experimental extension for Visual Studio. This allows us to lower the cost of delivering a quality product investment, and where we can draw more interest from the community.

Suggestion completed

6% of all actionable suggestion tickets end up marked as Completed. It may not sound like much, but it is about 1 suggestion per weekday. Let that sink in. Every single weekday, the Visual Studio engineering team implements a community submitted suggestion.

Before we implement a suggestion, we first write a spec for it if needed. Then we schedule the work item in a sprint for engineering to pick up. The implementation sometimes require work by multiple teams to coordinate, so they can each do their piece of the feature.

After automated test and compliance runs have finished, it’s time for code review before the code starts its journey toward the Visual Studio master branch. More automated testing runs and finally manually testing follows. After fixing all identified bugs, the completed suggestion makes its way to a Visual Studio Preview release for user testing and stabilization.

So, how do we decide to implement suggestions and how can you optimize the chances of your suggestion making it? We look at several things:

  1. Suggestions with many votes and continuous votes over time
  2. Suggestions in areas that see lots of usage by our customers
  3. Suggestions that are easier to implement
  4. Suggestions that would improve Visual Studio’s competitive advantage
  5. Well written suggestion with all relevant information in the description

A different way to think about it is to turn it around. Imagine someone wanted you to implement a feature in your product. It’s in the best interest of our product and customers to complete as many suggestions as possible, and we strive to do so.

The best times are when we get to make a lot of people happy with a feature implementation based on a suggestion.

We can must do better

We’ve gotten feedback that this process feels like a black box. Customers feel like they don’t get a response and they don’t know the status of their suggestions.

After submitting a suggestion, there is no transparency into the process, and it ends up closed without any good reason 6 months later. I end up feeling frustrated and angry. I don’t want to submit another suggestion just to be ignored. – Anonymous Visual Studio user

This is not acceptable. We must do better.

Some ideas that we are working on within the team are as follows. And, we welcome your feedback on what we might do more of to help you understand the process better.

First up, we want to be much more transparent about the process. That’s exactly what this blog post aims to achieve.

Secondly, we must be faster at responding to new suggestions. That means triaging them within the first week, so we can bring down the 20% of new untriaged suggestions to a minimum. It also means not leaving any suggestions to linger for months. This will add visibility into what is going on with the suggestions much earlier and throughout its various phases. We’ve made great progress with this in the past 6 months, but still have a bunch of open tickets to go.

Thirdly, we need to be better at giving reasons for closing tickets. Individually written by the program manager that closed them and not an automated response. As we’re getting better at handling the vast amount of incoming suggestions, this is where we’ll focus next.

Feedback

I hope this blog post helps shed light on the way we handle suggestion and how we plan to improve. Completing a suggestion every single weekday will hopefully encourage you to continue opening suggestion tickets.

In closing, we’d really like to hear your thoughts or questions. What could we do better and what do we do well? Let us know in the comments below.

The post Status on Visual Studio feature suggestions appeared first on The Visual Studio Blog.
Theming in Visual Studio just got a lot easier

$
0
0

Sometimes the default themes for Visual Studio just aren’t enough. Lucky for us, we’ve just redesigned the process of creating and importing custom themes.

One of the only ways to import themes was to download the older Color Theme Editor extension. If you were brave enough to create your own theme, you had to edit elements one by one from an unorganized list of 3,000+ vaguely named color tokens.

This summer, a group of interns has developed a newly released Color Theme Designer extension, and we’re hoping that making custom themes just got a whole lot simpler for beginner and advanced designers alike.

A new theming experience

Finding and using a new theme is now as easy as downloading any other extension. Just check out the new Themes category in the Visual Studio Marketplace to download themes that other users have published.

For theme designers, the new Color Theme Designer comes with a more familiar startup workflow and a simplified design.

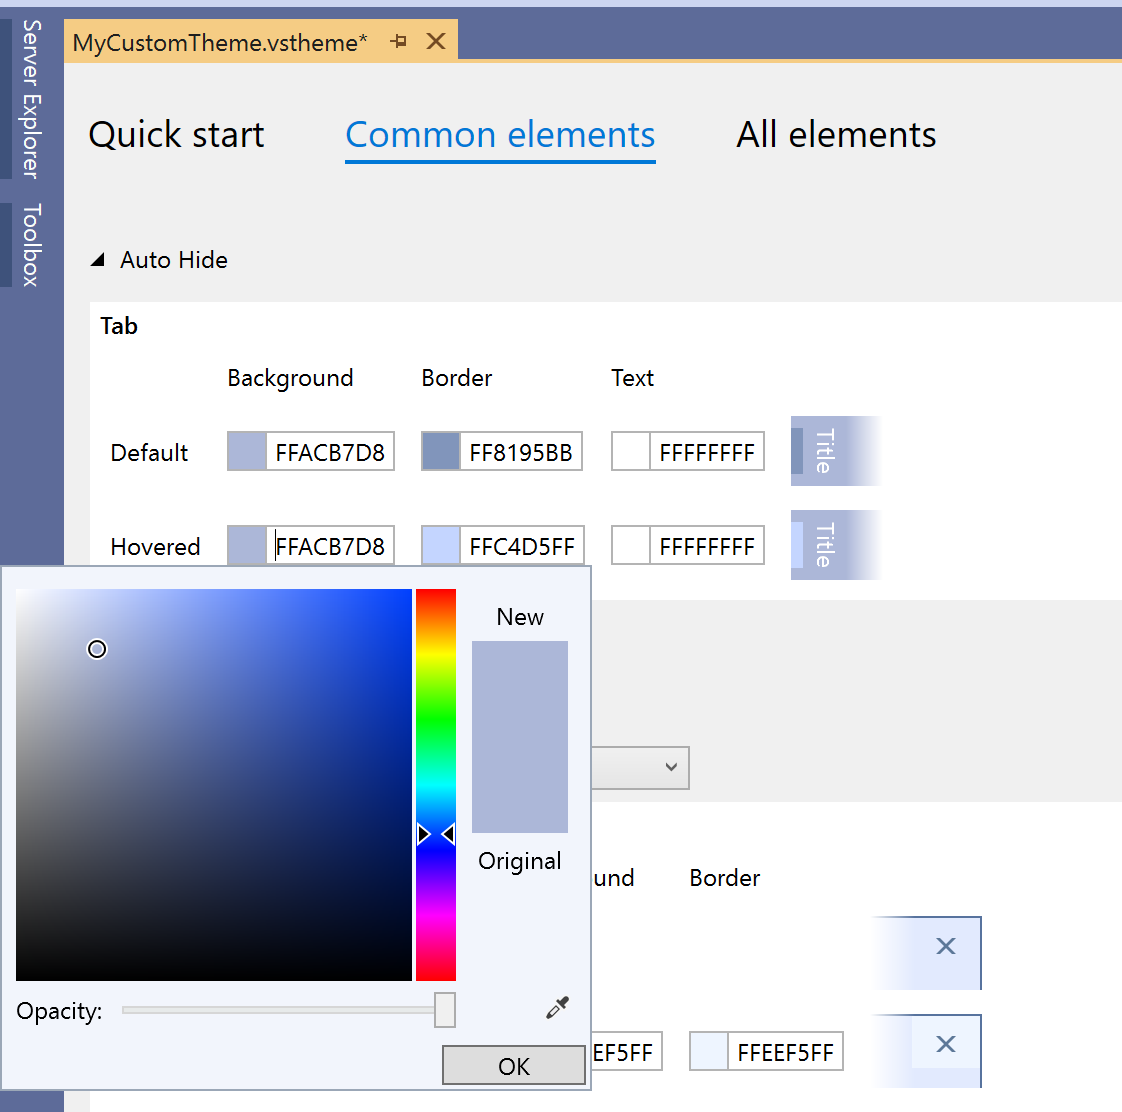
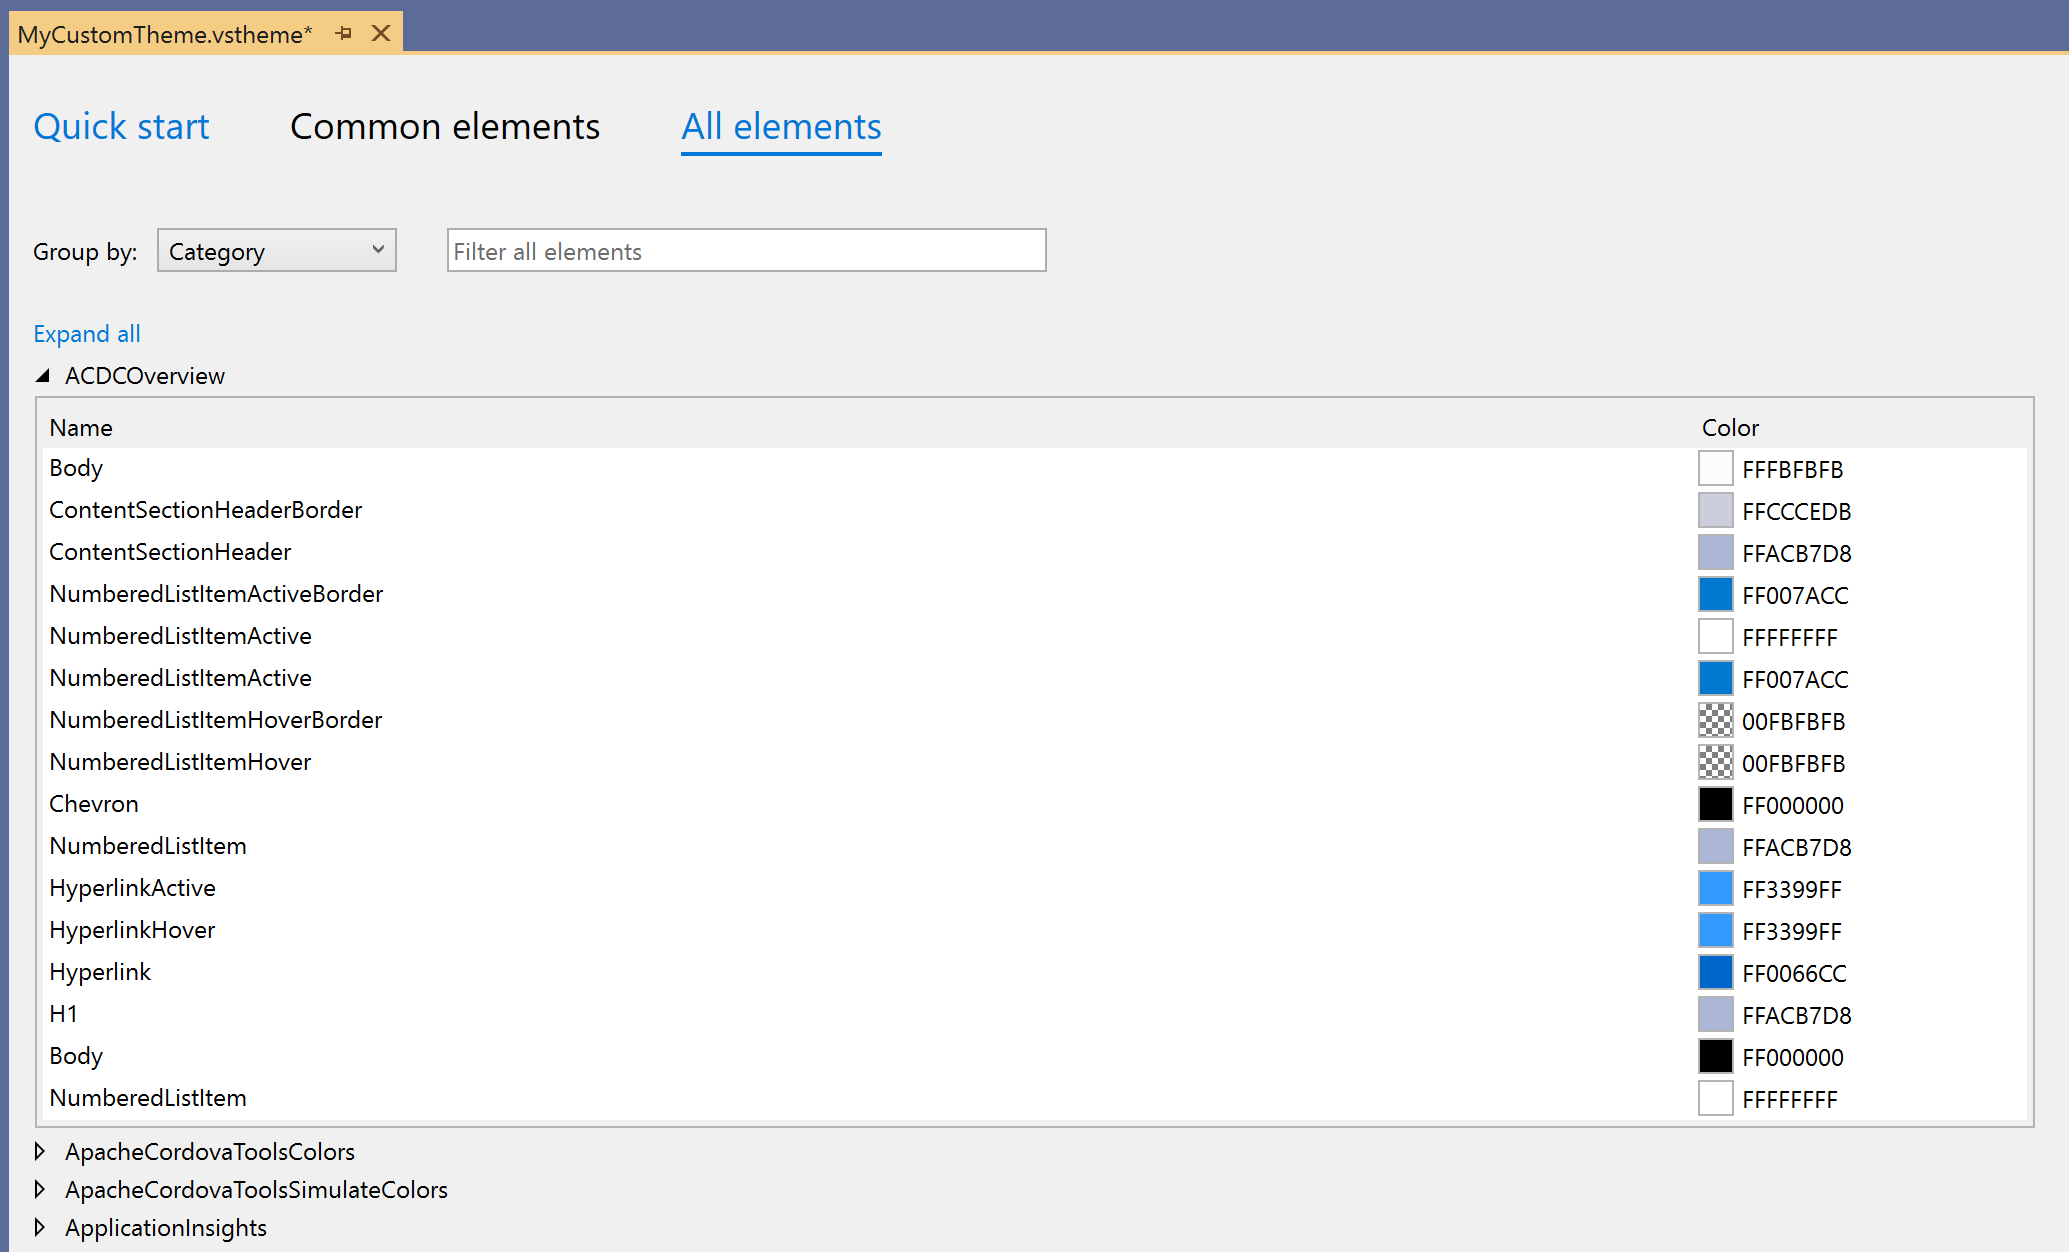
We’re introducing ‘Quick start,’ a feature that lets you create a custom theme in minutes by picking three base colors. For more specific customizations, the redesigned ‘Common elements’ and ‘All elements’ tabs allow you to edit all color tokens individually. The new ‘Preview’ mode lets you see edits real-time before fully saving and applying your theme. Your final product will be a Visual Studio extension that puts your theme alongside the default themes under Tools -> Options.

Let’s create a theme!

1. Set up your theme project

If you’re ready to get started making your first theme (or theme pack!), download the Color Theme Designer and create a new ‘VSTheme Project’ in Visual Studio.

The new project will contain an empty .vstheme file. Opening the file will prompt you to pick a base theme.

The base theme you select will fill the theme file with color tokens that you can later customize.

2. Start customizing

Only got 15 minutes?

In ‘Quick start,’ you select three colors which will generate a full palette of shades that set the majority of colors in the theme. A miniature preview displays how the colors will generally appear in Visual Studio.

Want to dive in deeper?:

‘Common elements’ has roughly 100 of the most commonly edited color tokens organized under five main categories. Next to each row of tokens, a snippet preview will update as you change the colors.

‘All elements’ shows every editable color token in a list that can be grouped by category or color value. Right-clicking tokens gives you the option to modify the hue, saturation, and lightness of the selection. If you can’t find a token that you are looking for, try filtering by a hex value or key words in the token name.

If you’d like to add additional theme files to your project, right-click to Add -> New Item -> VSTheme File.

Try clicking ‘Preview’ while customizing your theme to see your edits applied temporarily to the entire IDE!

3. Install your theme

When you’re finished customizing your theme, click ‘Apply’ if you’d like to start using it immediately. Your theme will appear under Tools -> Options -> General in the Color Themes dropdown alongside the default Visual Studio themes. To remove your theme, go to the Manage Extensions dialog and simply uninstall it like any other extension.

Otherwise, build your theme project and locate. the .vsix file in the project’s output directory (‘bin’ folder) to install the theme extension. Use the .vsix file to share your theme with friends or publish it to the Visual Studio Marketplace!

In closing

What do you think of the new Color Theme Designer? Are there any features you would like to see included in the future? Please let us know your thoughts in the comments below.

We hope you feel inspired to download the new extension and begin making your own color themes, but if not, check out the Visual Studio marketplace to download themes that other users have made!


This blog post was written by:

Prasiddhi Jain
University of North Carolina
Anna Owens
North Carolina State University
James Fuller
North Carolina A&T
Prasiddhi Jain

The post Theming in Visual Studio just got a lot easier appeared first on The Visual Studio Blog.

Azure IoT Dev Experience July Update: IoT Edge tooling GA and more!

$
0
0

Welcome to the June update of IoT Tooling!

In the release, we have made a lot of features and improvements for our IoT developers!

General Availability of IoT Edge tooling

Azure IoT Edge was released in the year of 2017. With near two years’ continuous working on the Azure IoT Edge Tooling, we are happy to announce that Azure IoT Edge Tooling is now general available. Azure IoT Edge Tooling includes:

ARM64 support in Azure IoT Edge extension for Visual Studio Code

With the release of IoT Edge 1.0.8, Azure IoT Edge is supported on ARM64 IoT Edge devices. In the meanwhile, I’m glad to share the steps of developing and debugging ARM64 IoT Edge custom modules in VS Code. For details, you could checkout this blog post for more information.

Containerized tool chain to simplify IoT device development

In early this month, we announced the preview of a new feature enabled in Azure IoT Tools extension in VS Code to simplify the device cross-compiling tool chain acquisition effort for device developers working on embedded Linux devices (e.g. Debian, Ubuntu, Yocto Linux…) with Azure IoT by encapsulating the compilers, device SDK and essential libraries in Containers. All you need is to install or upgrade the IoT Device Workbench and get started developing within the container, just like today you are using a local environment. For details, you could checkout this blog post for more information.

Try it out

Please don’t hesitate to give it a try! We will continuously improve our IoT developer experience to empower every IoT developers on the planet to achieve more!

The post Azure IoT Dev Experience July Update: IoT Edge tooling GA and more! appeared first on The Visual Studio Blog.

Java on Visual Studio Code June Update

$
0
0

Welcome to the June update of Java on Visual Studio Code!

Earlier this month, we shared our new Java Installer for Visual Studio Code, which aims to help new Java developers to get their environment ready and start coding in just a few clicks. In this update, we’d like to share a couple new features and enhancements delivered during last few weeks.

More code actions

Developers need refactoring and code actions to achieve high productivity, so we’re bringing more of those features to you.

Enhanced “Generate getters and setters”

In addition to bulk generate getters and setters for all member variables, if the class has more than one field, the source action will also prompt a quick pick box which allows you to select the target fields to generate the accessor methods.

The source action is also aware of the java.codeGeneration.generateComments preference and will use it to decide whether to generate comments for getter and setter methods.

Generate Delegate Methods

This new code action enables generating delegate methods.

Generate Constructor

This source action helps adding constructor from super class.

Assign parameter to new field

This source action assigns parameter to new field for unused constructor parameter(s).

Performance improvements

A set of changes have been made to further improve performance of Java in Visual Studio Code, including a fix for I/O issue on Windows platform, reducing memory footprint for large projects with deep modules and batch project imports. VS Code is a lightweight editor and we’d like to make sure it still feels just like an editor when despite more and more features being added to it.

Debugger updates

Debugging is the most frequent used feature second only to code editing. We’d like you to enjoy debugging Java in Visual Studio Code.

Show more meaningful value in variable window and hover tool-tip

We’re now providing additional detailed information for variables during debug

  • For the classes that override ‘toString‘ method, show toString() details.
  • For Collection and Map classes, show an additional size=x details.
  • For Entry, show key:value details

New HCR button

To better expose the hot code replace feature and let you control it more explicitly, we’ve added a new button to the toolbar and provided a new debug setting java.debug.settings.hotCodeReplace to allow you control how to trigger HCR. Default to manual.

  • manual – Click the toolbar to apply the change to running app

  • auto – Automatically apply the changes after compilation. This is the old behavior.
  • never – Never apply the changes

See HCR in action

Global setting for selecting debug console

While VS Code offers a powerful Debug Console with REPL (Read-Eval-Print Loop) functionality, one major restriction of it is it doesn’t accept input. For those programs which need to take console input, developers need to specify to use integratedTerminal instead of internalConsole in launch.json.

"console": "integratedTerminal"

However, this is not convenient if you need to do it repeatedly. Now we’re introducing a global setting, java.debug.settings.console. you can use this setting to configure the default debug console so you don’t need to change the launch.json every time.

"java.debug.settings.console": "integratedTerminal"

Other updates

Maven

2 new configs are now available for Maven extension

  1. pomfile.globPattern – specified how the extension search for POM file.
  2. pomfile.autoUpdateEffectivePOM – specifies whether to update Effective-POM automatically.
Test Runner

In recent releases, we’ve added support for a couple additional JUnit5 annotations, such as @Nested and @TestFactory. Test runner will also automatically show the test report after execution now.

Sign up

If you’d like to follow the latest of Java on VS Code, please provide your email with us using the form below. We will send out updates and tips every couple weeks and invite you to test our unreleased feature and provide feedback early on.

Try it out

Please don’t hesitate to give it a try! Your feedback and suggestions are very important to us and will help shape our product in future.

The post Java on Visual Studio Code June Update appeared first on The Visual Studio Blog.
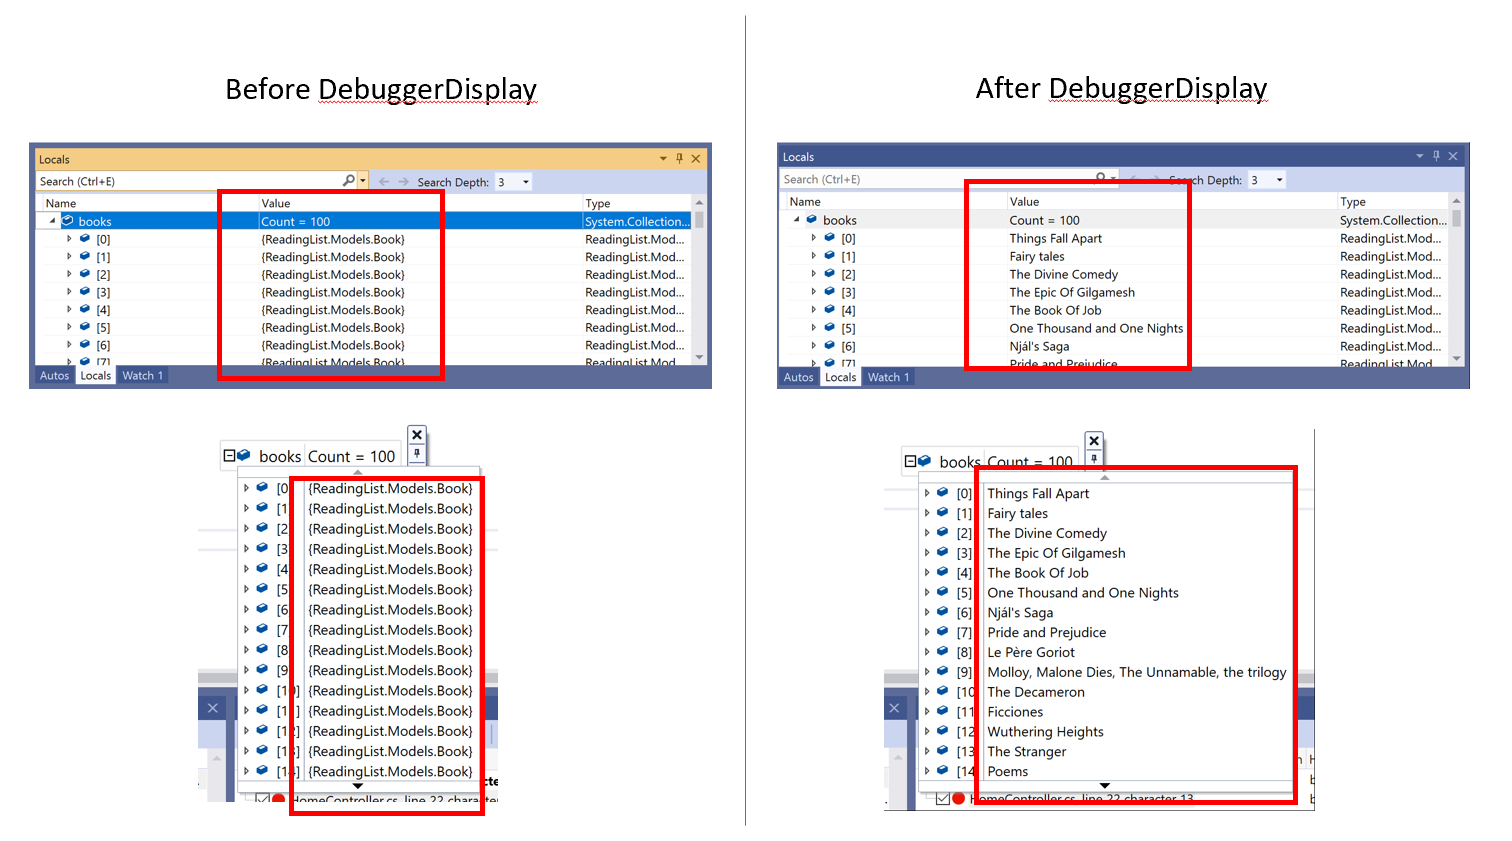
Azure IoT Dev Experience July Update: IoT Edge tooling GA and more!

$
0
0

Welcome to the June update of IoT Tooling!

In the release, we have made a lot of features and improvements for our IoT developers!

General Availability of IoT Edge tooling

Azure IoT Edge was released in the year of 2017. With near two years’ continuous working on the Azure IoT Edge Tooling, we are happy to announce that Azure IoT Edge Tooling is now general available. Azure IoT Edge Tooling includes:

ARM64 support in Azure IoT Edge extension for Visual Studio Code

With the release of IoT Edge 1.0.8, Azure IoT Edge is supported on ARM64 IoT Edge devices. In the meanwhile, I’m glad to share the steps of developing and debugging ARM64 IoT Edge custom modules in VS Code. For details, you could checkout this blog post for more information.

Containerized tool chain to simplify IoT device development

In early this month, we announced the preview of a new feature enabled in Azure IoT Tools extension in VS Code to simplify the device cross-compiling tool chain acquisition effort for device developers working on embedded Linux devices (e.g. Debian, Ubuntu, Yocto Linux…) with Azure IoT by encapsulating the compilers, device SDK and essential libraries in Containers. All you need is to install or upgrade the IoT Device Workbench and get started developing within the container, just like today you are using a local environment. For details, you could checkout this blog post for more information.

Try it out

Please don’t hesitate to give it a try! We will continuously improve our IoT developer experience to empower every IoT developers on the planet to achieve more!

The post Azure IoT Dev Experience July Update: IoT Edge tooling GA and more! appeared first on The Visual Studio Blog.

Viewing all 1039 articles
Browse latest View live


<script src="https://jsc.adskeeper.com/r/s/rssing.com.1596347.js" async> </script>