Quantcast
Channel: Visual Studio Blog
Viewing all 1039 articles
Browse latest View live

Visual Studio for Mac: Top Features of the New Editor

$
0
0

Over the past year, the Visual Studio for Mac team updated the editors within the IDE to be faster, more fluent and more productive. We did this by building a macOS-native editor interface on top of the same editor backend as Visual Studio on Windows. In version 8.1 we introduced the new C# editor. This was followed by the new XAML editor in 8.2. And most recently, we updated our web languages to utilize the new editors in version 8.3, completing the process we set out to do a year ago. To celebrate this accomplishment, I wanted to share a bit of detail regarding the design and implementation of the new editors along with my five favorite new features in the Visual Studio for Mac code editors.

At the core of the updated editors within Visual Studio for Mac is the shared language service with Visual Studio on Windows. What this means is that the same backend that powers the Windows version of Visual Studio now powers the macOS version as well. This includes IntelliSense, Roslyn, text logic, and all the language services behind the scenes. The only portion not shared between Windows and macOS is the UI layer, which stays native for each platform. In the case of macOS, that means using macOS frameworks like Cocoa and CoreText to power the UI experience. By using a native UI, while also being able to utilize support for native input methods as well as support for right-to-left languages, font ligatures and other advanced graphical features.

Now that we have the power of the new editor in the IDE, let’s take a look at my top 5 favorite new editor features. All of the features I want to share with you today are aimed at making your development experience more productive, delightful and fun. I hope you enjoy using them as much as we enjoyed developing them!

Multi-Caret Editing

Multi-caret allows you to insert any number of carets (text insertion points) within the file you are editing. This can be accomplished manually through mouse clicks with control-option-click or through the keyboard. When using the keyboard, you can utilize pattern matching to insert next matching (Option+Shift+.) or insert all matching (Option+Shift+;). You can also remove the last inserted caret with Option+Shift+, or move the last caret down with Option+Shift+/. In the below GIF, I use the Option+Shift+. hotkey to insert the next matching caret twice, allowing me to edit all three instances of “double” within this page.

Multi-caret editing is a very powerful feature that can greatly reduce the time associated with editing multiple lines at the same time. For example, if you need to change a prefix on several variables, or switching specific var declarations to strongly typed declarations, multi-caret editing allows you to do this with ease.


IntelliSense Type Filtering

The next feature that I want to highlight is IntelliSense Type Filtering. With IntelliSense Type Filtering, you can filter the completion list by type of completion. If, for example, you only want to see classes in your completion list, you can either click the classes icon or use the hotkey “option-c”. We have a full list of types that you can filter by, in addition to their corresponding icons and hotkeys in our Visual Studio for Mac Documentation. In the GIF below, I use IntelliSense type filtering to focus my list on interfaces, structures and finally on delegates.

This feature really comes in handy when you can’t recall the exact name of the item you want, or simply want to focus solely on a specific type. It also works super well when combined with my next favorite feature, Show Import Items.

Show Import Items

Often, when I am working on a project, I can’t always recall the exact namespace I need to import into my code file for a specific type. This often leads me to panic and feverishly search anywhere I can to find the import I need. This next feature alleviates this angst by not only showing completions which I have already imported, but also completions that are available for import. Additionally, if I end up selecting one of the not-yet-imported completions, the using statement will be added to the header of the code file. In the below GIF, I add “System.ComponentModel.DataAnnotations” to my project through the Show Import Items feature. You may have also noticed that for items which are not yet imported, the full namespace is listed next to the type, making it easy to see what the system is going to add to your header.

Show Import Items is currently disabled by default, but you can easily enable it by opening Visual Studio > Preferences > Text Editor > IntelliSense and enabling “Show Import Items”.

Right-to-Left and Native Input Support

A top ask from our community was to enable support of right-to-left and bi-directional languages, and we incredibly excited to offer support for those requests in Visual Studio 2019 for Mac. In the old editors, typing or pasting right-to-left strings, such as those in Persian, Hebrew or Arabic, would result in the word appearing to be in reverse. For example, the word for “hello” would appear to say “olleh”, flipping the text around so that it appears reversed. With the new editors, right-to-left and all types of bi-directional text are supported.

We’ve also introduced native input support. As the editors are built using the native toolkit for macOS, inserting text into the editor is just like inserting in any other native macOS app. This means that you get access to all of the advanced text entry features of macOS, such as long-press for accented and alternate characters as well as the emoji selector!

Ligature Support

If you use a font which supports ligatures, such as the newly released Cascadia Code, Visual Studio for Mac 2019 will automatically support the insertion of ligatures in place of common dual character glyphs. For example, the double-equal sign (==) will be transformed into an elongated equal sign with no space. Likewise, the bang-equals (!=) will be transformed to an equal sign with a slash throughout, more accurately depicting the “does not equal” symbol which bang-equals is intended to represent.

In the below GIF, I use a simple “if” statement to demonstrate the available ligatures for several different common multi-character glyphs.

Download Visual Studio 2019 for Mac

These are my five favorite editors features in Visual Studio for Mac 2019, but there are plenty more to experience as you work through a project. To get started with Visual Studio 2019 for Mac Download the Visual Studio 2019 for Mac v8.3 release today, or if you have it installed already – update to the latest release using the Stable channel!

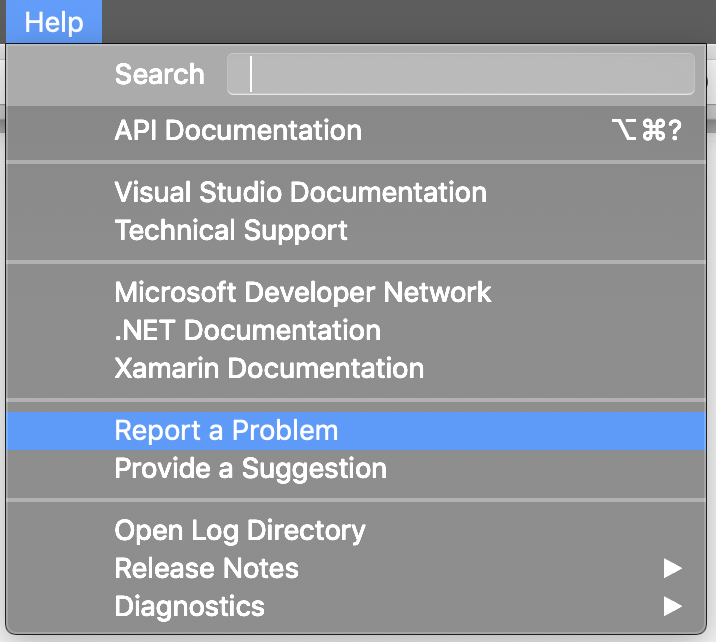
If you run into any issues with the v8.3 release, please use the Help > Report a Problem menu in the IDE to let us know about it. You can also provide suggestions for future improvements by using the Provide a Suggestion menu.

report a problem context menu

Finally, make sure to follow us on Twitter at @VisualStudioMac to stay up to date on the latest Visual Studio for Mac news and let us know what your experience has been like. We look forward to hearing from you!

The post Visual Studio for Mac: Top Features of the New Editor appeared first on Visual Studio Blog.
Introducing solution-level NuGet Package Management in Visual Studio for Mac

$
0
0

Visual Studio 2019 for Mac version 8.3 comes with many new features as summarized in this blog post. While the entirety of this release was greatly influenced by your feedback, having the ability to manage packages at the solution level was one of the capabilities that most of you expressed as lacking in Visual Studio for Mac. A new solution-level NuGet Package Manager is one of the exciting new features of Visual Studio 2019 for Mac version 8.3. We’ve made improvements to help you discover packages more easily. This includes an improved experience while searching for new packages, gaining an understanding of what packages are already installed in your project, and finding packages that have updates available. In this blog post, we will focus on the package management experience for a Solution. However, most of the experiences including installing, updating, and viewing installed packages have a similar new experience at the project-level, too.

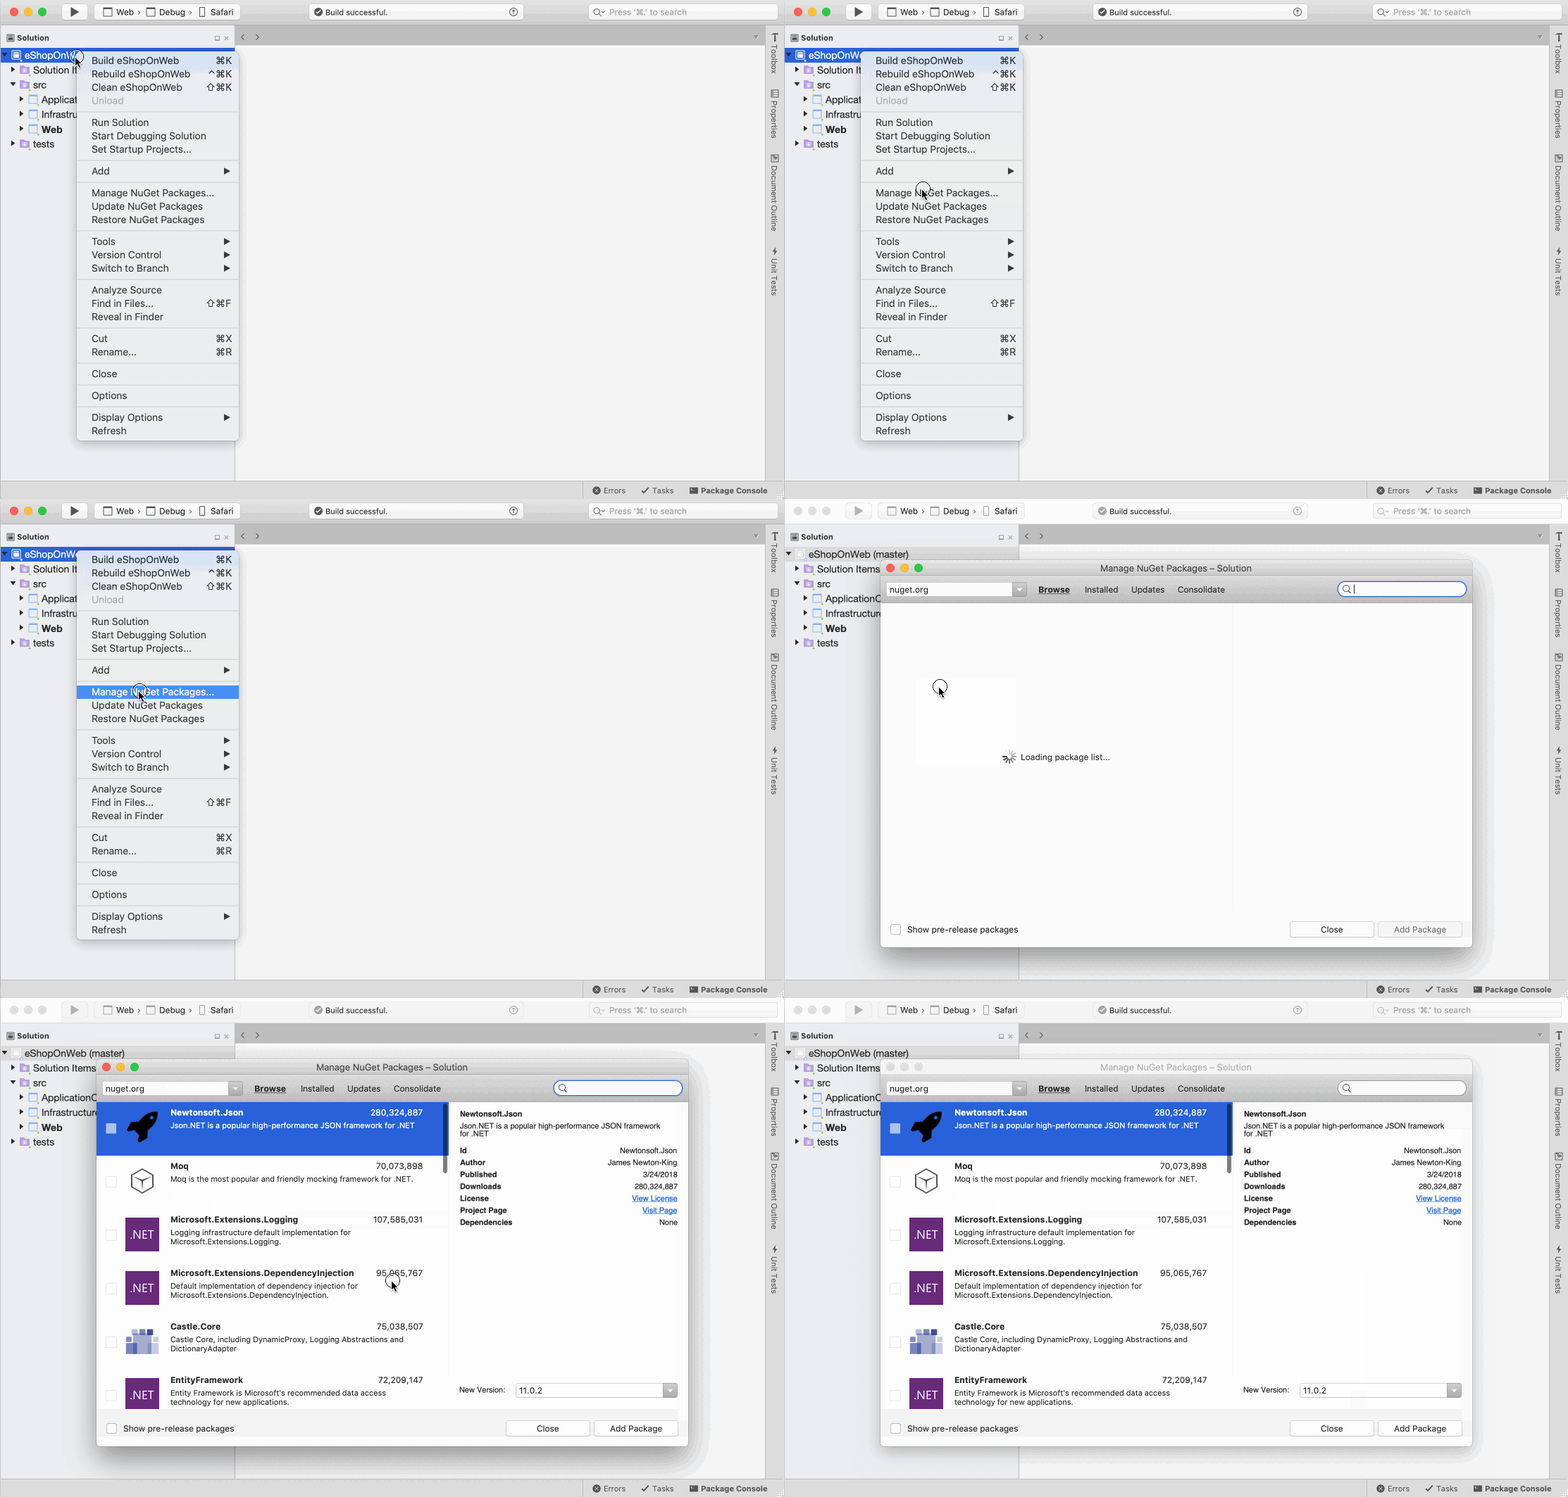
To launch the NuGet Package Manager for a Solution, you can go to the context menu for the Solution and select “Manage NuGet Package…”:

Context menu for Solution-level NuGet Package Manager


Add new packages

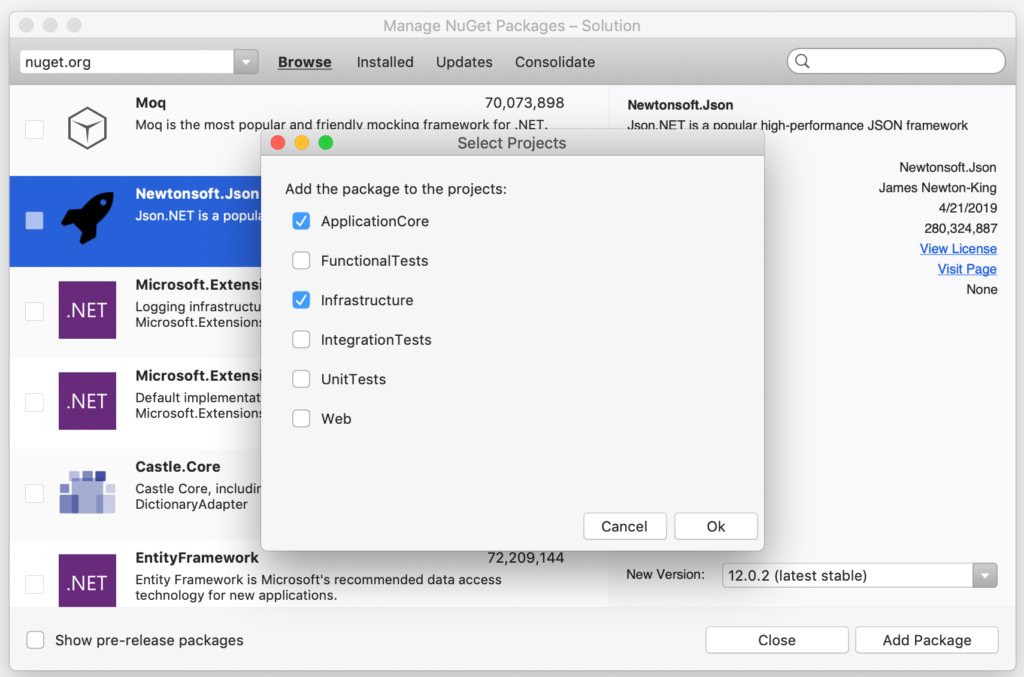
When you search and try to add a new package, you can now select the projects you want to install the package into.

At any time, you can go to the Installed tab and view list of all the packages installed in your solution, allowing you to uninstall to update them.

NuGet Package Management Install


Update packages

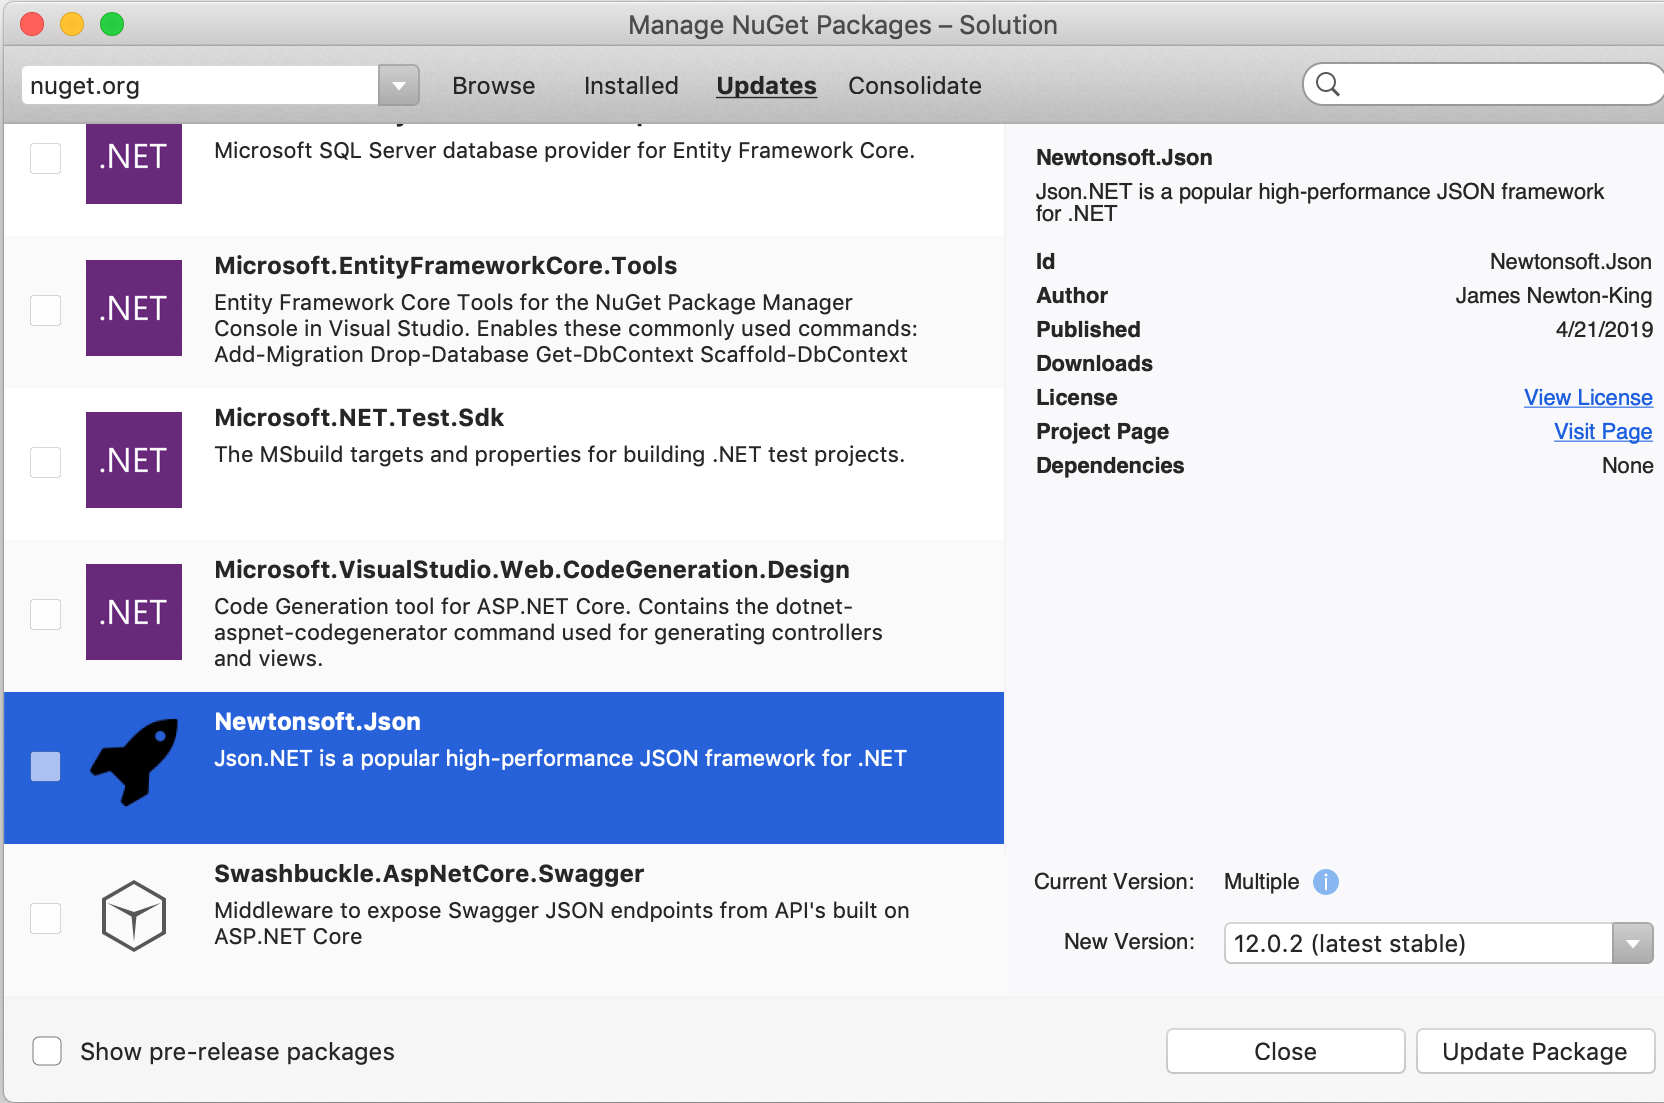
The Updates tab shows you all the packages in the solution for which updates are available (or a project, if you invoke the command at a project level).

NuGet Package Manager Updates

Consolidate packages

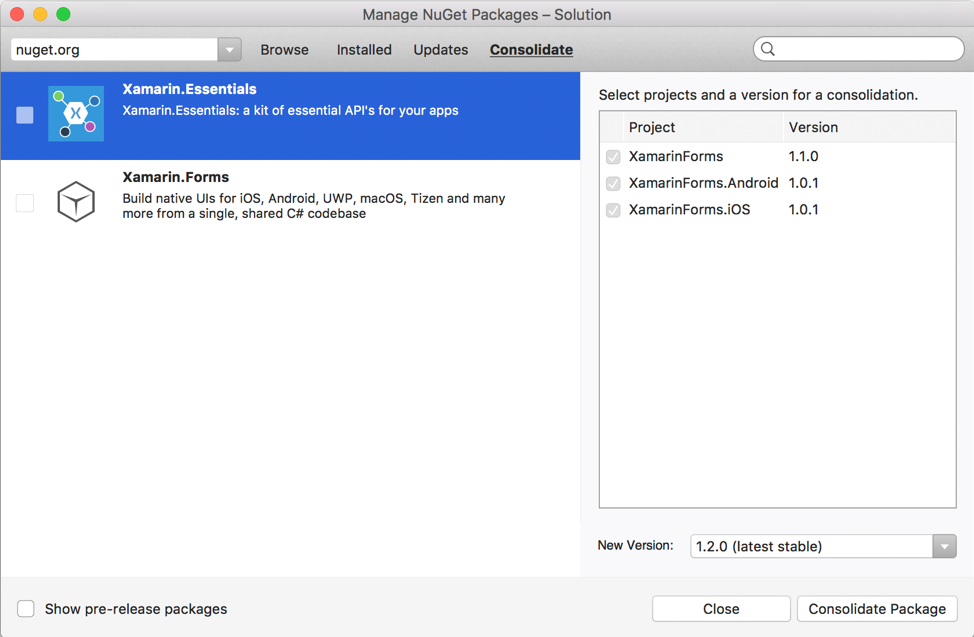
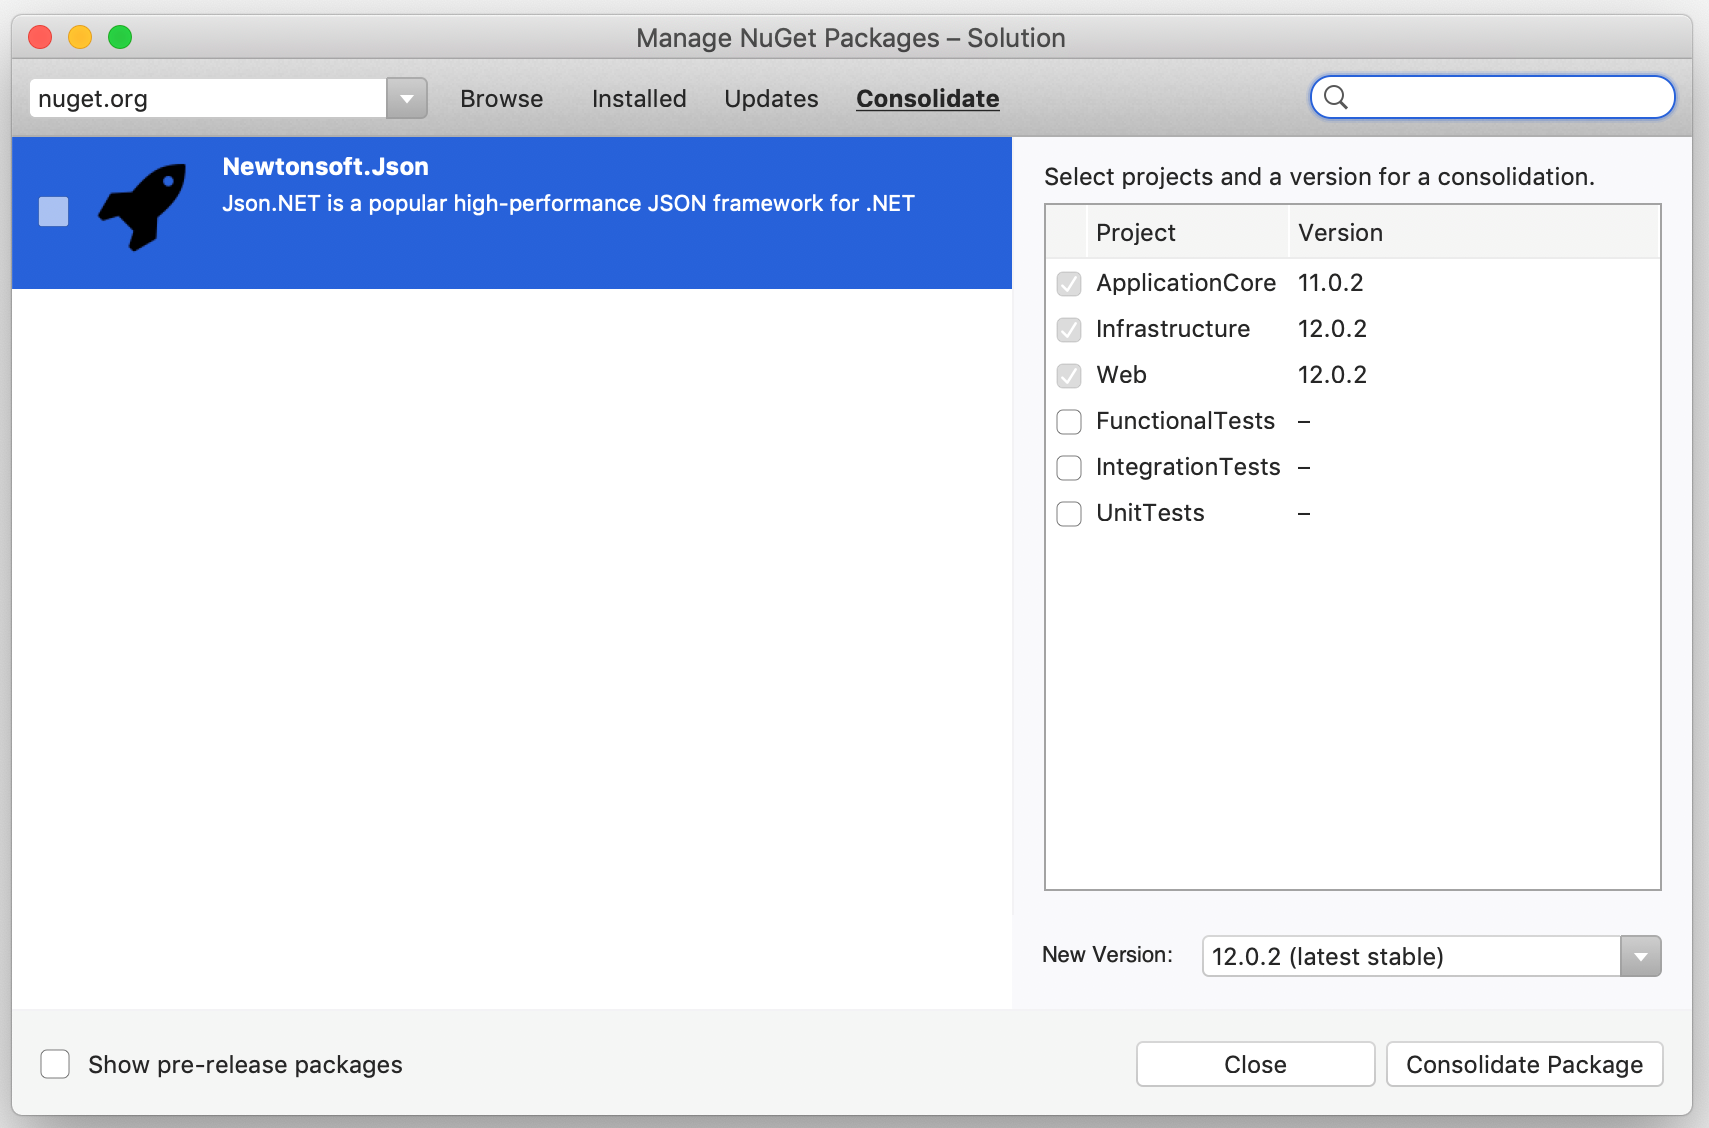
Often, large solutions end up in situations where different projects refer to different versions of a package. To consolidate these versions into one single version of the package that you might want to use across the solution, you can go to the consolidate tab of the NuGet Package Manager invoked at the solution node, select the package’s version to you would like all the projects in the solution to use and choose to consolidate packages:

Consolidate packages

Download today!

To try out these new NuGet capabilities, download the Visual Studio 2019 for Mac version 8.3 release today or update to the latest release using the Stable channel if you already have Visual Studio for Mac installed.

If you run into any issues with the version 8.3 release, please use the Help > Report a Problem menu in the IDE to let us know about it. You can also provide suggestions for future improvements to Visual Studio for Mac by using the Provide a Suggestion menu.

Report a Problem

Finally, make sure to follow us on Twitter at @VisualStudioMac to stay up to date on the latest Visual Studio for Mac news and let us know what your experience has been like. We look forward to hearing from you!


The post Introducing solution-level NuGet Package Management in Visual Studio for Mac appeared first on Visual Studio Blog.
Build Visual Studio extensions using Visual Studio extensions

$
0
0

What if the community of extension authors banded together to add powerful features to Visual Studio that made it easier to create extensions? What if those features could be delivered in individually released extensions, but joined by a single installation experience that allows the user to choose which of the features to install? That’s the idea behind Extensibility Essentials – an extension pack that ships community-recommended extensions for extension authors.

Extension authors are usually interested in improving their own tooling in Visual Studio – either by installing extensions created by others or by building some themselves. By banding together, we can create the best and most comprehensive tooling experience for extension authoring. So, let’s test that theory by creating a range of extensions published to the Marketplace under our own accounts, and reference them in Extensibility Essentials to provide a unified and simple installation experience.

The individual extensions can and probably should be single purpose in nature. This prevents feature-creep where additional features are added that may or may not be useful for extension authors. If additional features are not closely related to the extension, then simply create a new extension for them. That way it is up to the individual extension author to decide if they wish to install it. It is also crucial that the extensions follow all the best practices.

Once the individual extension is stable, it can be added to Extensibility Essentials.

The extension pack Extensibility Essentials doesn’t do anything by itself. It is a barebone extension pack that just references the individual extensions. When installing the extension pack, the user can choose which of the referenced extensions to install. At the time of this writing, there are 9 individual extensions.

How the individual extensions are listed before installing

Ideas for new extensions can be centralized to the GitHub issue tracker. By collecting ideas in a central location, it provides a single location to comment on and potentially design features ahead of implementation.

The issue tracker is for both bugs and suggested features

It would be cool if…

So next time you’re sitting in Visual Studio working on an extension, think about what feature you’d like that would make you more productive. If you can’t think of a feature, but feel there is a scenario that is particularly problematic, then open a bug on the GitHub issue tracker and let other people try to figure out how an extension could perhaps solve the issue.

Thinking “it would be cool if…” is the first step to make it possible and with the Extensibility Essentials, it might be closer to becoming reality than imagined.

Does this idea resonate with you? Let me know in the comments.

Mads Kristensen, Senior Program Manager
@mkristensen

Mads Kristensen is a senior program manager on the Visual Studio Extensibility team. He is passionate about extension authoring, and over the years, he’s written some of the most popular ones with millions of downloads.

Q# – a Wish List for the New Year

$
0
0

In previous blog posts you have read about some of the ideas behind Q#, how it came into existence, and its development over the past year. You have read about quantum computing, quantum algorithms and what you can do with Q# today. With the end of the year approaching, there is only one more thing to cover: What is next?

This blog post is about our aspirations for the future and how you can help to accomplish them. It contains some of our visions going forward, and we would love to hear your thoughts in the comment section below.

Community

One of the most exciting things about Q# for us is the growing community around it. Being rooted in the principles of quantum mechanics, quantum computing tends to have this air of unapproachability to the “uninitiated”. However, quantum computing builds on the notion of an idealized quantum system that behaves according to a handful of fairly easy to learn principles. With a little bit of acquired background in linear algebra, some persistence, and patience when wrapping your head around how measurements work it is possible to get knee-deep into quantum algorithms reasonably quickly!

Of course, a couple of good blog posts on some of these principles can help. We strive to actively support you in the adventure of exploring quantum algorithms by providing materials that help you get started, like our growing set of quantum katas. Our arsenal of open source libraries provides a large variety of building blocks to use in your quest of harnessing the power of quantum. One of the main benefits of open source projects is being able to share your work with all the people brave enough to explore the possibilities that quantum has to offer. Share your progress and help others build on your achievements! Whether in kata or library form, we welcome contributions of any size to our repositories. Let us know how we can help to make contributing easier.

Exchange among developers is one of the most important aspects of software development. It is omnipresent and vital to building a sustainable environment around a particular toolchain and topic. Thankfully, modern technology has made that exchange a lot easier than when the first computer programmers started their careers. We intend to make full use of the power of the internet and give a voice and a platform for discussions on topics related to Q# and quantum computing to developers around the world. The Q# dev blog is part of this effort. Contact us or comment below if you have an idea for a blog post or would like to hear more about a specific topic related to Q#. Establishing good feedback channels is always a challenging endeavor and in particular for a small team like ours. We would like this place to become a source of knowledge and exchange, a place where you can find the latest news and voice your take on them.

Growth

This brings us back to our plans for Q#. We have built Q# to make quantum development easier and more accessible. Of course, there were also a couple of other considerations that have played into that decision. For instance, we are anticipating the need to automate what is largely done in manual labor today, e.g. qubit layout and gate synthesis that are often still done on a case-by-case basis for each program and targeted hardware. When is the last time you worried about how error correction works on the hardware your code gets executed on? With qubits being an extremely scarce resource, and the long-term ambition to use quantum computing to address the most computationally intensive tasks that cannot be tackled with current hardware, the optimization of large-scale quantum programs needs to be a priority. We chose to develop our own language in order to have full control and flexibility over what information is represented how, and when it is used during compilation in order to be able to support a modular and scalable software architecture for executing quantum programs. But that’s a tale for another time. What is important is that these considerations are key factors in how we design and develop the language going forward.

A programming language is more than just a convenient set of tools for expressing an algorithm. It shapes the way that we think and reason about a problem, how we structure it and break it down into tasks when building a solution. A programming language can have a tremendous impact on our understanding of existing approaches, as well as how to adapt and combine them for our purposes. Particularly so when venturing into new territory.

Our goal is therefore to build a shared understanding of what it is we strive to accomplish, and to evolve Q# into the powerful language needed to drive progress in quantum programming. Our goal is to leverage the expertise of a community of language designers, compiler veterans, quantum physicists, algorithms and hardware experts, and a variety of software developers to shape a new kind of computing architecture. And we want you to be part of it.

Transparency

Since our 0.3 release at the beginning of November we have been eagerly working on not just the next release, but on defining and preparing the next steps in 2019. While we are in the middle of formulating our plans for the future, I want to give you a brief insight into some of our considerations.

As I am sure you have noticed, the support for data structures in Q# is minimal. While we do provide quite a few high-level language features for abstracting classical and quantum control flow, we intentionally omit some of the more object-oriented mechanisms such as classes. We anticipate remaining heavily focused on transformations that modify the quantum state, expressed as operations in Q#, as well as their characteristics and relations in the future. However, basic bundling of data and manipulations of such is of course an important aspect of many programs and we want to provide suitable mechanisms to express these in a way that allows to make abstractions, is convenient, and is resistant to coding errors. User defined types in the current setting have limited power besides an increased type safety. The “black box approach” to type parameterization currently restricts their usefulness; we do not provide a mechanism for dynamic reflection and it is not possible to apply operators or other type specific functionalities to argument items whose type is resolved for each call individually. In that sense, these items are “black boxes” that can merely be passed around. We want to do as much of the heavy lifting as possible statically in particular since debuggability of quantum devices is a huge challenge. There are several mechanisms one might consider alleviating the consequences of these decisions. On one hand, type constraints are a common mechanism used in several popular languages. In a sense, they can be seen as “specializations based on the properties of a type”. One could also pursue the stricter path of specializing based on the concrete type itself, de-facto adding a form of overloading that we currently explicitly prevent from being used. Either way, by clearly separating user defined types from tuples in the type system we have made a first step towards extending their power.

If you are curious to hear more about possible ideas for Q#, their benefits and caveats, or want to share some thoughts of your own, comment below! Contribute to the discussion and post your speculations to the question: What makes a quantum programming language “quantum”, i.e. what makes it particularly suited for quantum computing?

Join us

I hope you join us into a new year of pushing the boundaries of computation by participating in our coding competitions, contributing to our open source repositories, commenting on or writing blog posts and sharing your ideas and experiences!

How about a new year’s resolution of your own? Let us know what you expect to accomplish and how we can help you achieve your new year’s resolution around quantum programming in Q#!

Bettina Heim, Senior SDE, Quantum Software and Application
@beheim
Bettina Heim is a quantum physicist and software engineer working in the Quantum Architectures and Computation Group at Microsoft Research. She is responsible for the Q# compiler and part of the Q# language design team. Prior to joining Microsoft she worked on quantum algorithms, adiabatic quantum computing, discrete optimization problems, and the simulation and benchmarking of quantum computing devices.

Build an Azure IoT application with Cloud Explorer for Visual Studio

$
0
0

What we’ve heard and experienced ourselves is that when building applications, you have a frictionless experience when your code editor and tools are integrated and seamless. Yet when developing IoT apps, you often need to manage connected devices and send test messages between the device and IoT Hub at the same time that you’re debugging and working on your code. You’ll likely spend time switching between windows or even screens to monitor the messaging and many components of your development.

To ensure that the tools you need are close at hand, we’ve updated the Cloud Explorer for Visual Studio extension for IoT developers to enable you to view your Azure IoT Hubs, inspect their properties, and perform other actions from within Visual Studio. Cloud Explorer is installed by default if you selected the Azure Workload when installing Visual Studio. To access the latest features, you need to upgrade to Microsoft Visual Studio 2017 Update 9 or later, then download and install the latest extension from Visual Studio marketplace.

Here are some of the new features to help IoT developers easily interact with Azure IoT Hub, and the devices connected to it:

  • Interact with Azure IoT Hub
    • Send D2C messages to IoT Hub
    • Monitor D2C messages sent to IoT Hub
    • Send C2D messages to device
    • Monitor C2D messages sent to device
    • Invoke Direct Method
    • View and update device twin
  • Device management
    • List devices
    • Get device info
    • Create and delete devices
  • IoT Edge development support
    • Create IoT Edge deployment for device
    • List modules
    • View and update module twin

To learn more about what the IoT Hub enables and how to use the latest, check out the IoT Hub documentation.

Easy to Set Up

After you’ve installed Cloud Explorer, you can open Cloud Explorer view from Visual Studio menu View → Cloud Explorer. Sign in to your Azure account by clicking the Account Management icon if you haven’t done this before.

Expand Your subscription → IoT Hubs → Your IoT Hub, the device list will be shown under your IoT Hub node. Select one IoT Hub or device to inspect its properties or perform actions against the resource.

Now you have learned how to access your Azure IoT Hub resources.

Try the Tutorials

If you want to discover the Cloud Explorer features further, we offer the following walkthroughs where you will perform common IoT Hub management actions. To explore advanced or specific IoT scenarios, head over to check out our IoT Hub documentation, where we’re always adding new projects and tutorials.

Your feedback is also very important for us to keep improving and making it even easier to develop your IoT applications. Please share your thoughts with us by suggesting a feature or reporting an issue in our Developer Community

Chaoyi Yuan, Software Engineer

Chaoyi is a software engineer working on IoT tools. He’s currently focus on providing great tools for Visual Studio and Visual Studio Code users.

Visual Studio 2019 Preview 2 is now available

$
0
0

The second preview of Visual Studio 2019 is now available for download. This release contains a number of improvements and additions to the core experience and different development areas, many of which are a result of your direct feedback. As always, you can check out the release notes for more details or read on for the highlights.

Core IDE experience

Visual Studio 2019 will automatically download updates in the background while your computer is idle. This means you can continue using Visual Studio 2019 until it’s time to install. And, you will only need to wait for the actual installation of the update. The default will be set to “Download all, then install”, and you can modify this by going to Tools > Options > Environment > Product Updates.

In Preview 1, we introduced a new Per-Monitor Awareness (PMA) preview feature that is now enabled by default for users that meet the system requirements of .NET Framework 4.8 and Windows 10 April 2018 Update. Alongside the core IDE, multiple tool windows such as Toolbox, Breakpoints, Watch, Locals, Autos, and Call Stack should now render sharply across monitors with different display and scale configurations.

Search capabilities have improved in two places: the start window and inside the IDE. In the start window, you can now search for project templates by language, platform, and tags via the search box. Preview 2 introduces filters for menus, components, and templates during search in the IDE, as well as the capability to create and add new projects and items directly from the search box.

Based on your feedback, the new blue theme in Visual Studio 2019 has been updated by dialing down luminosity and increasing contrast. The draggable region has been improved as well by making the toolbar region also draggable. As a result, dragging the Visual Studio 2019 window should now be more natural.

The document health feature that was introduced with Preview 1 has been given a visual upgrade in Preview 2. Now, at a glance, you can see how many errors or warnings your document has, and clicking the control will bring up the error list. Code cleanup, which was introduced in Preview 1, has also been given its own control to quickly access the code cleanup features.

C++ development

C++ developers will notice quite a few improvements in this release. Check out the release notes for the full list, but here are some of the highlights:

  • You now have access to a fresh version of the MSVC compiler and to libraries that:
    • Bring you guaranteed binary compatibility with Visual Studio 2017 MSVC toolset and runtime
    • Add initial support for C++ 20 standards (specifically the “spaceship” operator i.e. <=> under /std:latest),
    • Enable OpenMP 4 SIMD vectorization as well as many codegen improvements for better runtime performance and build throughput, including a new compiler switch -Ob3 that provides more aggressive inlining
    • Provide new Code Analysis checks including the new Lifetime profile checker.

Plus, you can try out the latest C++ productivity improvements, including the newly-enhanced C++ Template IntelliSense, NULL->nullptr refactoring, quick fixes for missing #include and using namespace declaration, missing semicolons, and more.

C# development

Visual Studio 2019 Preview 2 adds a couple more new C# 8.0 language features on top of the ones that shipped in Preview 1 (Take C# 8.0 for a spin). Most notably, C# 8.0 pattern matching now allows recursive patterns, which can dig into the structure of an object, and switch expressions, which are a lightweight expression version of switch statements. To learn more, check out Do more with patterns in C# 8.0 on the .NET Blog.

F# development

A preview of the F# 4.6 language is now available in Visual Studio 2019 Preview 2. You can learn more about the language changes in the F# 4.6 Preview blog post. Additionally, we’ve revamped how the F# language service is initialized by Roslyn, which should result in a consistently faster solution load time for larger solutions.

.NET development

Visual Studio 2019 Preview 2 brings a range of new refactoring and codefix capabilities, such as sync namespace and folder name, pull members up, invert conditional expressions/logical operations, and many more. We’re also gradually rolling out new classification colors which are similar to Visual Studio Code. You can control these via Tools > Options > Environment > Preview Features.

Starting with this release, we are making project files for .NET SDK-style projects a first-class file type in Visual Studio and are supporting things like double-clicking a project node to open the project file and finding a project by name with Go To All (Ctrl + T). Additionally, .NET SDK-style projects will now use the new Integrated Console experience for F5 and Ctrl + F5 on console apps.

Code cleanup also now enables you to save collections of fixers as a profile. Now, if you wanted to apply a small set of targeted fixers frequently while you code and have another more comprehensive set of fixers to apply before preparing for a code review, you can configure profiles to address these different tasks.

Python development

You can now switch between different Python interpreters using the new Python Environments toolbar when editing Python files or working with projects or Open Folder workspaces.   Miniconda is available as an optional component during installation so you don’t have to separately install it to create conda environments. Additionally, you can now create Visual Studio Live Share sessions for collaboration on Python code. Check out the Python in Visual Studio 2019 Preview 2 blog post for more details.

Web and container development

If you’re developing with Node.js, you will find JavaScript debugging support for unit tests in this release. If ASP.NET is more your style, you will find that when publishing your application to Azure App Service, you can associate Azure Store and Azure SQL resources with your app as dependencies.

If you’re using containers, Visual Studio 2019 Preview 2 now supports debugging ASP.NET Core applications that use Alpine as a base image. There’s also support for the latest ASP.NET and .NET Core images.

Visual Studio Kubernetes Tools are now integrated in the Azure development workload for easy installation. This will add the Container Application for the Kubernetes project template to Visual Studio, which will automatically create a Dockerfile and Helm chart that you can use. This also enables you to add support for Kubernetes to an existing ASP.NET Core application by right-clicking the project and selecting Add > Container Orchestrator Support. After adding Kubernetes support, you can build, run, and debug your application in a live Azure Kubernetes Service (AKS) cluster with Azure Dev Spaces.

Mobile .NET development

For .NET developers using Xamarin to build mobile apps, Visual Studio 2019 Preview 2 has improved build performance if you use Xamarin.Android 9.1.1 or higher. Xamarin.Android now also supports the latest Android dex compiler (d8) and code shrinker (r8). The Android designer now natively supports Android Pie (9.0) and will show you improved status when loading. You can also use Go-To-Definition (Ctrl + Click) on resource URLs to navigate to the file or line where they are defined.

A new property panel has been added for Xamarin.Forms developers, enabling you to edit common attributes for controls. The Xamarin.Forms templates now use the latest Xamarin.Forms 4.0 release and include a new Xamarin.Forms Shell app that aims to reduce the complexity of a multi-platform app solution.

Last, but not least, load performance for new projects has been improved dramatically, showing performance gains of up to 50% in certain cases. When building apps, you can now also see more detailed build progress information by clicking the background tasks icon in the bottom left of the IDE.

Get started; share feedback

You can download Visual Studio 2019 Preview 2 here or update using the Visual Studio Installer. If you want to give it a spin without installing it, check out the Visual Studio images on Azure. Let us know of any issues you run into by using the Report a Problem tool in Visual Studio. You can also head over to the Visual Studio Developer Community to track your issues, suggest a feature, ask questions, and find answers from others. We use your feedback to continue to improve Visual Studio 2019, so thank you again on behalf of our entire team.

Angel Zhou Program Manager, Visual Studio

Angel Zhou is a program manager on the Visual Studio release engineering team, which is responsible for making Visual Studio releases available to our customers around the world.

Enhanced in Visual Studio 2019: Search for Objects and Properties in the Watch, Autos, and Locals Windows

$
0
0

Are you inspecting many variables at once in the Locals window? Tired of constantly scrolling through the Watch window to locate the object you are currently interested in? New to Visual Studio 2019 for most languages (with some exclusions such as Xamarin, Unity, and SQL), you can now find your variables and their properties faster using the new search feature found in the Watch, Autos, and Locals windows!

With the new search feature, you will be able to highlight and navigate to specified values contained within the name, value, and type columns of each watch window.

Find your keywords faster using search and highlighting

If you are a fan of scrolling to the items you want, highlighting will allow you to find what you want easier. As you start typing in the search bar, the highlighting of matches currently expanded on screen will occur, giving you a faster alternative to performing a large-scale search.

Navigate between your specified keywords quickly

You can execute a search query using ENTER or the right and left arrow icons (“find next” (F3) and “find previous” (Shift+F3), respectively) shown below. If you are not a fan of scrolling to the items you want, clicking the arrows are also used to navigate through each found match. We based the search navigation on a depth first search model, meaning that matches are found by diving as far into the selected variable as specified before looking for matches within the next variable. You don’t have to sit through the full search if you don’t want to because search can also be cleared and canceled at any time, whether the search is ongoing or not.

Search for items deeply nested in your code

Unable to find what you’re looking for on your initial search? We’ve provided a “Search Depth” drop down to find matches nested X number of levels deep into your objects, where levels are defined similarly to levels in a tree data structure context. This option gives you the power to choose how thorough you want to search inside your objects (up to 10 levels), letting you decide how long or short the search process takes.

When you are searching for items that are already expanded and visible on your screen, these items will always be returned as matches no matter what search depth you have specified. Having to loop back to the item you want after passing it can be a pain, so setting the search depth to 1 will allow you to navigate to previous matches using the “find previous” arrow icon.

Excited to start searching in the Watch, Autos, and Locals windows? Let us know in the comments!

For any issues or suggestions, please let us know via Help > Send Feedback > Report a Problem in the IDE. If you have any additional feedback about this feature, feel free to complete this brief survey.

Leslie Richardson, Program Manager, Visual Studio Debugging & Diagnostics
@lyrichardson01

Leslie is a Program Manager on the Visual Studio Debugging and Diagnostics team, focusing primarily on improving the overall debugging experience and feature set.

Debug your live apps running in Azure Virtual Machines and Azure Kubernetes

$
0
0

We are excited to announce that, in our Visual Studio Enterprise 2019 preview, we are expanding Snapshot Debugger support beyond Azure App Services hosting ASP.NET Core and ASP.NET applications to now also include Azure Virtual Machines (VM), Azure Virtual Machine scale sets (VMSS), and Azure Kubernetes Services (AKS)!

When Visual Studio 2017 Enterprise 15.5 became generally available, we introduced the Snapshot Debugger, an innovative diagnostic tool that enables you to quickly and accurately evaluate problems in their Azure production environments without stopping the process and with minimal performance impact.

When an unanticipated issue occurs in production, it can be difficult to replicate the exact conditions in your testing environment and almost impossible to do so on your local development machine. You might consider asking your DevOps team to “turn up” production logging but this relies on you having already anticipated where issues might occur prior to deployment. You may also request that a process dump be taken, but that requires perfect timing and some luck to capture the most important details, you also must gauge how your collection strategy might negatively imy pact performance.

The Snapshot Debugger provides a familiar and powerful debugging experience, allowing developers to set Snappoints and Logpoints in code, similar to debugger breakpoints and tracepoints. When a Snappoint is hit in your production environment, a snapshot is dynamically created without stopping the process. Developers can then attach to these snapshots using Visual Studio and see what’s going on with variables, Locals, Watches and Call Stack windows, all this while the live site continues to serve your customers.

Azure Virtual Machines/Azure Virtual Machine scale sets

For most PaaS scenarios, Azure App Service is more than capable of encapsulating a complete end-to-end experience. However, for developers and organizations that require greater control over of their platform and environment, VMs remain a critical option and Snapshot Debugger supports them in the latest preview of Visual Studio.

Once your VM/VMSS has been set up to host your ASP.NET or ASP.NET Core web application you can open your project in Visual Studio 2019, and click on the “Debug->Attach to Snapshot Debugger…” menu item, where you will now be able to select VM/VMSS as shown.

The UI experience remains almost identical but now you will be required to select an Azure Storage account to collect your snapshot logs and to share the snapshot collection plan (App Services will also require Azure Storage in Preview 2).

Selecting the “Install Remote Debugger Extension” option will prompt Visual Studio to install the extensions in Azure, which is necessary to view snapshots. This process also opens a specific set of ports (30398, 31398, 31399, 32398) to facilitate communication to your local machine, these ports are not required for retrieving and viewing logpoints.

Azure Kubernetes Services (AKS)

Azure provides an incredible cross platform experience and our debugging and diagnostics tools now provide feature parity in our Kubernetes service offerings.

Before attempting to use any of the Snapshot Debugger features in AKS it is vital that your Docker images include ASP.NET Core 2.2+ installed in a global location, as well as the correctly configured Snapshot Debugger and the requisite environment variables.

To help you enable support for Snapshot Debugger in AKS we have provided a repo containing a set of Dockerfiles that demonstrate the setup on Docker images. We support three variants of Linux (Debian, Alpine and Ubuntu) and they are organized according to the ASP.NET Core version, the OS platform, and the platform architecture.

For example, the ASP.NET Core 2.2 Debian 9 (Stretch) x64 Dockerfile is located at /2.2/stretch-slim/amd64/Dockerfile. This Dockerfile produces an image with Debian 9 x64 as the base with ASP.NET Core 2.2 Runtime, it includes the latest supported Snapshot Debugger backend package and sets the environment variables to load the debugger into your .NET Core application.

Try the preview

The latest Snapshot Debugger experiences are now in preview, download and try it out here.

This preview supports the following scenarios:

  • Azure App Services on the Windows OS running ASP.NET Core (2.0+) or ASP.NET (4.6.1+).
  • Virtual Machines on the Windows OS running ASP.NET Core (2.0+) or ASP.NET (4.6.1+).
  • Azure Kubernetes Services (Linux Docker Containers) running ASP.NET Core (2.2+).

If you have any issues using Snapshot Debugger, please review this guide on Troubleshooting and known issues for snapshot debugging in Visual Studio.

We would love to hear your feedback. To report issues, use the Report a Problem tool in Visual Studio. You’ll be able to track your issues on the Visual Studio Developer Community site where you can also ask questions and find answers.

Mark Downie, Program Manager, Visual Studio Diagnostics
@poppastring

Mark is a program manager on the Visual Studio Diagnostics team, working on Snapshot Debugger.


Become a Visual Studio for Mac super user with this Tips and Tricks Video Series

$
0
0

If you are a web, mobile or games developer and would like to know how to become more productive and efficient using Visual Studio for Mac then we’ve got you covered. Visual Studio for Mac is a powerful IDE for C# developers that work with Xamarin, .NET Core and Unity workloads. The new video series, hosted on the Visual Studio Toolbox, contains short, roughly 5-minute, videos that cover tips and tricks for specific tasks and may even unveil features you didn’t even know existed! The first few videos will be introducing Visual Studio for Mac and what you can do with it.

You don’t want to miss a single video in the series so make sure you subscribe now. We will be recording and releasing a new video each week over the next few weeks, and the links will be updated on the date specified below. The videos currently feature Program Managers, Cody Beyer (@cl_beyer) and Sayed Ibrahim Hashimi (@SayedIHashimi). You can also provide feedback using the Developer Community portal

Here are the links to all the videos:

Overview In this video, Sayed will give you a very brief overview of some of the types of applications you can develop with Visual Studio for Mac. Since this is a very short video, it just touches on some of the more common types of apps that can be developed. This is the first video in the Visual Studio for Mac Tips and Tricks series. The first few videos will be setting a foundation with some basic information on Visual Studio for Mac. Following that, each video will show one, or a few, tips and tricks for specific tasks.
Acquisition Visual Studio for Mac is our full-featured IDE for macOS, providing all the tools you need to create ASP.NET Core application, Unity games, Xamarin mobile apps, Azure Functions and so much more. Join Cody as he shows how to download and install Visual Studio for Mac.
Build Your First App In this video, Sayed will show you how you can create your first ASP.NET Core web application with Visual Studio for Mac. The application that will be developed is a web site that displays the emojis available on GitHub. The info for the emojis are retrieved using the GitHub API.
Launch Multiple Projects While developing applications, it’s common to need to debug, or simply launch, more than one project. In this video, Sayed will show you how you can do just that. You can launch more than one project on run, or debug, by creating a new Solution Run Configuration.
Work with Multiple Solutions 
(available 1/29/2019)
In this video, Sayed will show you how you can work with multiple solutions in Visual Studio for Mac. Specifically, he will demonstrate two ways to work with multiple solutions:
  1. How to open more than one solution in the same instance of the IDE
  2. How to open more than one instance of Visual Studio for Mac
Manage Projects with Git 
(available 1/29/2019)
Want to know how to “git” started with using Visual Studio for Mac? Join Cody as he introduces Git support in Visual Studio for Mac, from check-out to push.
Publish to Azure
(available 2/5/2019)
In this video, Cody will demonstrate how to log in and publish a web project to Azure. Join him and learn how to get the most out of Visual Studio for Mac by combining it with the power of Azure.
Customize the Look and Feel 
(available 2/5/2019)
No IDE is truly ready until it matches your unique style and preferences. In this video, Cody will walk you through the steps to enable dark mode, install custom editor color themes and change the interface language.
Refactoring Code
(available 2/12/2019)
Visual Studio for Mac offers the refactoring and suggestion engine that you know and love on Windows. Learn how to get the most out of the power of Roslyn in all of your projects using Visual Studio for Mac.
Using NuGet 
(available 2/12/2019)
Visual Studio for Mac supports NuGet for all of your dependency management needs. In this video, Cody will demonstrate how to add a NuGet package to your project, and how to connect Visual Studio for Mac to custom NuGet feeds.
Searching and Navigating 
(available 2/19/2019)
Learn how to be a keyboard wizard and navigate within your project with ease using Visual Studio for Mac. In this video, Cody shares his favorite tips and tricks for navigating around your code.
Using Navigate To
(available 2/19/2019)
In this video, Sayed will show you how you can improve your productivity when developing apps with Visual Studio for Mac using the Navigate To feature that allows you quickly find files, code, and more. Navigate To is a feature that is similar to the Visual Studio Quick Launch feature.


Tell us what you think!

We invite you to leave us a comment below and let us know what you think of the series. If these are helpful and valuable to our users, then we will record more videos and keep the series going. If there is another format that you think would be better, we would love to hear your thoughts.

Here are some useful links:

Cody Beyer, Program Manager
@cl_beyerCody Beyer is a Program Manager on the Visual Studio for Mac team at Microsoft. His primary areas of focus cover overall performance and reliability of the IDE. He is also interested in computer ethics and privacy and aims to create software that empowers and respects everyone.
Sayed Hashimi, Senior Program Manager
@sayedihashimiSayed Ibrahim Hashimi has a computer engineering degree from the University of Florida. He works at Microsoft as a Senior Program Manager creating better .NET Core, and ASP.NET Core, ­development tools in Visual Studio for Mac. Before joining the Visual Studio for Mac team, he worked on ASP.NET features in Visual Studio. Prior to joining Microsoft, he was a Microsoft Visual C# MVP. Sayed has written four book on MSBuild, http://msbuildbook.com and he is a co-founder of  the OmniSharp project.

A better multi-monitor experience with Visual Studio 2019

$
0
0

Visual Studio 2019 now supports per-monitor DPI awareness (PMA) across the IDE. PMA support means the IDE and more importantly, the code you work on appears crisp in any monitor display scale factor and DPI configuration, including across multiple monitors.

Visual Studio 2019 (left) with system scaling vs Visual Studio 2019 (right) with the PMA option enabled.

If you have used Visual Studio across monitors with different scale factors or remoted into a machine with a different configuration than the host device, you might have noticed Visual Studio’s fonts and icons can become blurry and in some cases, even render content incorrectly. That’s because versions prior to Visual Studio 2019 were set to render as a system scaled application, rather than a per-monitor DPI aware application (PMA).

System scaled applications render accurately on the primary display as well as others in the same configuration but have visual regressions such as blurry fonts and images when rendering on displays with different configurations. When working for extended periods of time, these visual regressions can be a distraction or even a physical strain.

Visual Studio 2019 Preview 1 included the core platform support for per-monitor DPI awareness and Preview 2 includes additional fixes for usability issues around scaling, positioning and bounding (e.g. content renders within the bounds of tool windows). Preview 2 also adds several more popular tool windows that now correctly handle per-monitor DPI awareness.

How to enable PMA for Visual Studio 2019

The easiest way to try the new PMA functionality is on Visual Studio 2019 Preview 2. You’ll need to have the Windows 10 April 2018 Update or a newer build installed along with the latest version of .NET Framework 4.8. If you’re still running Preview 1 then you also need to enable “Optimize rendering for screens with different pixel densities” in the Preview Features node of the Tools -> Options dialog.

There are many features where you’ll start to see Visual Studio render clear fonts and crisp images. Here’s a few of the most used UI in Visual Studio where you should notice a difference.

  • Core Shell
  • Menus and context menus
  • Most code editors
  • Solution Explorer
  • Team Explorer
  • Toolbox
  • Breakpoints
  • Watch
  • Locals
  • Autos
  • Call Stack

Visual Studio 2019 Preview 2 also fixes some of the usability issues affecting UI positioning, scaling and content bounding that were discovered in Preview 1.

Our goal is to have per-monitor awareness working across the most used features by the time we ship Visual Studio 2019. In future updates, we’ll continue enabling PMA across more areas and look forward to your feedback.

Tell us what you think!

We thank you for your ongoing feedback, and encourage you to install the latest Visual Studio 2019 preview, enable the PMA functionality, and tell us about your experiences through the Developer Community portal. Please upvote PMA related asks or create new ones whenever you feel a specific component (tool window, dialog, etc.) or issue has not being reported.

Reporting your experience alongside your display configurations, PMA feature state (on/off) and for bonus points, any screenshot or video showing the affected areas will help us resolve issues faster, and account for as many use-cases as possible.

Ruben Rios, Program Manager, Visual Studio
@rub8n

Ruben is a Program Manager on the Visual Studio IDE platform team. During his time at Microsoft, he’s helped build tools and services for web & mobile devs in both Visual Studio and the Microsoft Edge F12 dev tools. Before joining Microsoft, he was a professional web developer and has always been passionate about UX.

Microsoft Q# Coding Contest – Winter 2019

$
0
0

Are you new to quantum computing and want to improve your skills? Have you done quantum programming before and looking for a new challenge? Microsoft’s Quantum team is excited to invite you to the second Microsoft Q# Coding Contest, organized in collaboration with Codeforces.com.

The contest will be held March 1 through March 4, 2019. It will offer the participants a selection of quantum programming problems of varying difficulty. In each problem, you’ll write Q# code to implement the described transformation on the qubits or to perform a more challenging task. The top 50 participants will win a Microsoft Quantum T-shirt.

This contest is the second one in the series started by the contest held in July 2018. The first contest offered problems on introductory topics in quantum computing: superposition, measurement, quantum oracles and simple algorithms. The second contest will take some of these topics to the next level and introduce some new ones.

For those eager to get a head start in the competition, the warmup round will be held February 22-25, 2019. It will feature a set of simpler problems and focus on getting the participants familiar with the contest environment, the submission system and the problem format. The warmup round is a great introduction, both for those new to Q# or those looking to refresh their skills.

Another great way to prepare for the contest is to work your way through the Quantum Katas. They offer problems on a variety of topics in quantum programming, many of them similar to those used in the first contest. Most importantly, the katas allow you to test and debug your solutions locally, giving you immediate feedback on your code.

Q# can be used with Visual Studio, Visual Studio Code or command line on Windows, macOS or Linux, providing an easy way to start with quantum programming. Any of these platforms can be used in the contest.

We hope to see you at the second global Microsoft Q# Coding Contest!

Mariia Mykhailova, Senior Software Engineer, Quantum
@tcnickolas
Mariia Mykhailova is a software engineer at the Quantum Architectures and Computation group at Microsoft. She focuses on developer outreach and education work for the Microsoft Quantum Development Kit. In her spare time she writes problems for programming competitions and creates puzzles.

Break When Value Changes: Data Breakpoints for .NET Core in Visual Studio 2019

$
0
0

“Why is this value changing unexpectedly and where or when is this occurring?!

This is a question many of us dread asking ourselves, knowing that we’ll have to do some tedious trial-and-error debugging  to locate the source of this issue.  For C++ developers, the exclusive solution to this problem has been the data breakpoint, a debugging tool allowing you to break when a specific object’s property changes.  Fortunately, data breakpoints are no longer a C++ exclusive because they are now available for .NET Core (3.0 or higher) in Visual Studio 2019 Preview 2!

Data breakpoints for managed code were a long-requested ask for many of you. They are a great alternative to simply placing a breakpoint on a property’s setter because a data breakpoint focuses on a specific object’s property even when it’s out of scope, whereas the former option may result in constant, irrelevant breaks if you have hundreds of objects calling that function.

How do I set a data breakpoint?

Setting a data breakpoint is as easy as right-clicking on the property you’re interested in watching inside the watch, autos, or locals window and selecting “Break when value changes” in the context menu.  All data breakpoints are displayed in the Breakpoints window. They are also represented by the standard, red breakpoint circle next to the specified property.

Setting a data breakpoint in the Locals window and viewing the breakpoint in the Breakpoints window

When can I use data breakpoints?

Now that you know how to set a data breakpoint, now what?  Here are some ways to take advantage of data breakpoints when debugging your .NET Core applications.

Let’s say that you want to figure out who is modifying a property in an object and for most of the time, this property change does not happen in the same file. By setting a data breakpoint on the property of interest and continuing, the data breakpoint will stop at the line after the property has been modified.

Break when _data value changes

This also works for objects. The data breakpoint will stop when the property referencing the object changes value, not when the contents of the object change.

Break when the property referencing an object changes

As illustrated in the GIF above, calling the toEdit._artist.ChangeName() function did not cause a breakpoint to hit since it was modifying a property (Name) inside the Song’s Artist property.  In contrast, the data breakpoint is hit when the _artist property is assigned a reference to a new object.

Data breakpoints are also useful when you want to know when something is added or removed from a collection. Setting a data breakpoint on the ‘Count’ field of classes from System.Collections.Generic makes it easy to detect when the collection has changed.

Break when an object is added or removed from a list

Are there opportunities for improving managed data breakpoints?

Since Visual Studio 2019 is still in preview, we highly encourage you to experiment, play around with, and provide feedback for this iteration of data breakpoints.  Here are some known scenarios where data breakpoints currently cannot be set that we are working on erasing and improving in future Visual Studio updates:

  • Properties that are not expandable in the tooltip, Locals, Autos, or Watch window
  • Static variables
  • Classes with the DebuggerTypeProxy Attribute
  • Fields inside of structs

Managed data breakpoints also exclude properties that call native code and properties that depend on too many fields.

Ready to try data breakpoints in your .NET Core applications?  Let us know in the comments!

For any issues or suggestions about this feature, please let us know via Help > Send Feedback > Report a Problem in the IDE or in the Developer Community.

Leslie Richardson, Program Manager, Visual Studio Debugging & Diagnostics
@lyrichardson01

Leslie is a Program Manager on the Visual Studio Debugging and Diagnostics team, focusing primarily on improving the overall debugging experience and feature set.

Say hello to the new Visual Studio terminal!

$
0
0


Building on the momentum from the recently announced Developer PowerShell, we are excited to share the first preview of the new Visual Studio terminal. This new preview experience is part of Visual Studio version 16.3 Preview 3.


Rather than build everything from scratch, the Visual Studio terminal shares most of its core with the Windows Terminal. For you, that translates into a more robust terminal experience, and faster adoption of new functionality.


Enabling the new Visual Studio terminal

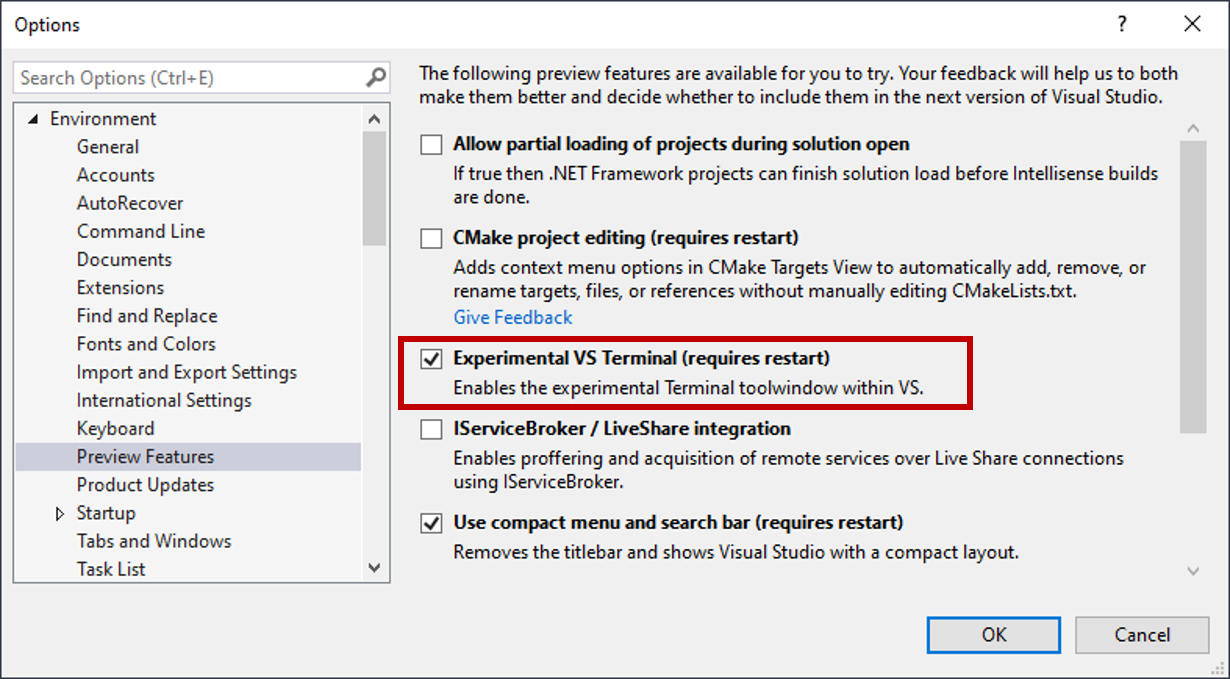
To try the terminal preview, you’ll first need to enable it by visiting the Preview Features page. Go to Tools > Options > Preview Features, enable the Experimental VS Terminal option and restart Visual Studio.

Once enabled, you can invoke it via the View > Terminal Window menu entry or via the search.

Creating Terminal profiles

Launching the terminal automatically opens an integrated PowerShell instance. However, you can customize the startup experience by using shell profiles.

With shell profiles, you can target different types of shells, invoke them using unique arguments, or even set a default shell that better fits your needs.

In future updates, we plan to optimize the experience by pre-populating the terminal with a few basic profiles. In the meantime, you can manually add additional profiles on the terminal’s Options page.


As an example, here’s how you can set profiles for some popular options:

Developer Command Prompt

Shell location:
C:\Windows\System32\cmd.exe
Arguments:
/k "C:\Program Files (x86)\Microsoft Visual Studio\2019\IntPreview\Common7\Tools\VsDevCmd.bat"

Developer PowerShell

Shell location:
C:\WINDOWS\system32\WindowsPowerShell\v1.0\powershell.exe
Arguments:
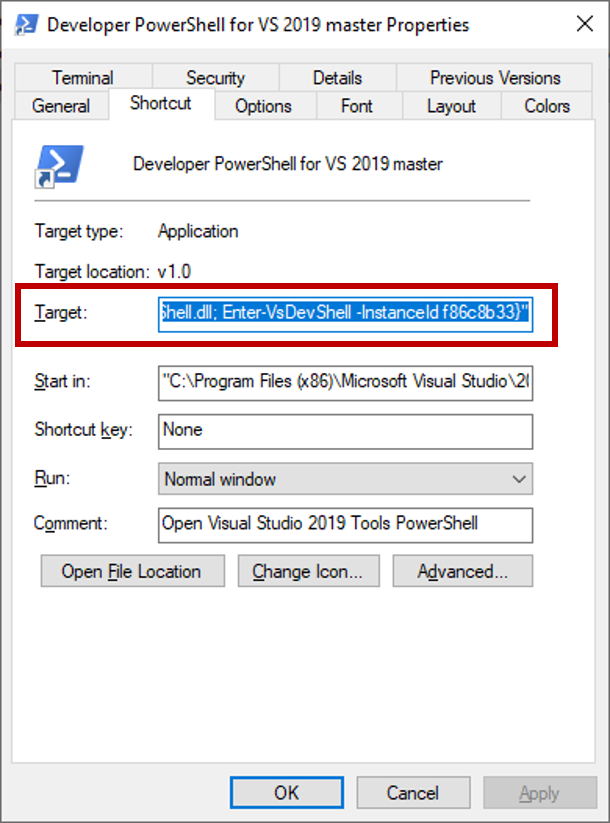
-NoExit -Command "& { Import-Module 'C:\Program Files (x86)\Microsoft Visual Studio\2019\Preview_master\Common7\Tools\vsdevshell\Microsoft.VisualStudio.DevShell.dll'; Enter-VsDevShell -InstanceId f86c8b33}"

Note: You’ll need to update the above argument to match your specific configuration. You can extract the argument information by looking into the Target string for the Developer PowerShell shortcut.

WSL

Shell location:
C:\WINDOWS\sysnative\wsl.exe


Try it out and let us know what you think!

While we are excited to share this preview, we want to ensure a solid experience before we enable this experience in the release version of Visual Studio. As a result, the terminal will initially only be available in the preview versions of Visual Studio 2019.

As next steps, we’ll look to deliver improvements around rendering (the terminal currently needs to be resized to render correctly), accessibility and theming. We’ll also add new productivity boosters such as multiple terminal instances and deeper integration with Visual Studio.

We’d love to know how it fits your workflow and how we could further improve your terminal experience. Send us your feedback via the Developer Community portal, or via the Help > Send Feedback feature inside Visual Studio.

The post Say hello to the new Visual Studio terminal! appeared first on Visual Studio Blog.
Java on Visual Studio Code September Update

$
0
0

Welcome to the September update of Java on Visual Studio Code!

There’re a lot we’ve been working on during the summer which we’d like to share with you now. You will see new refactoring and code action features such as move member and class, live linting as well as improvements for Debugger, Test Runner and Maven. We’ve also improved getting started experience with our new Pack release.

Refactoring and Code Actions

Move refactoring support

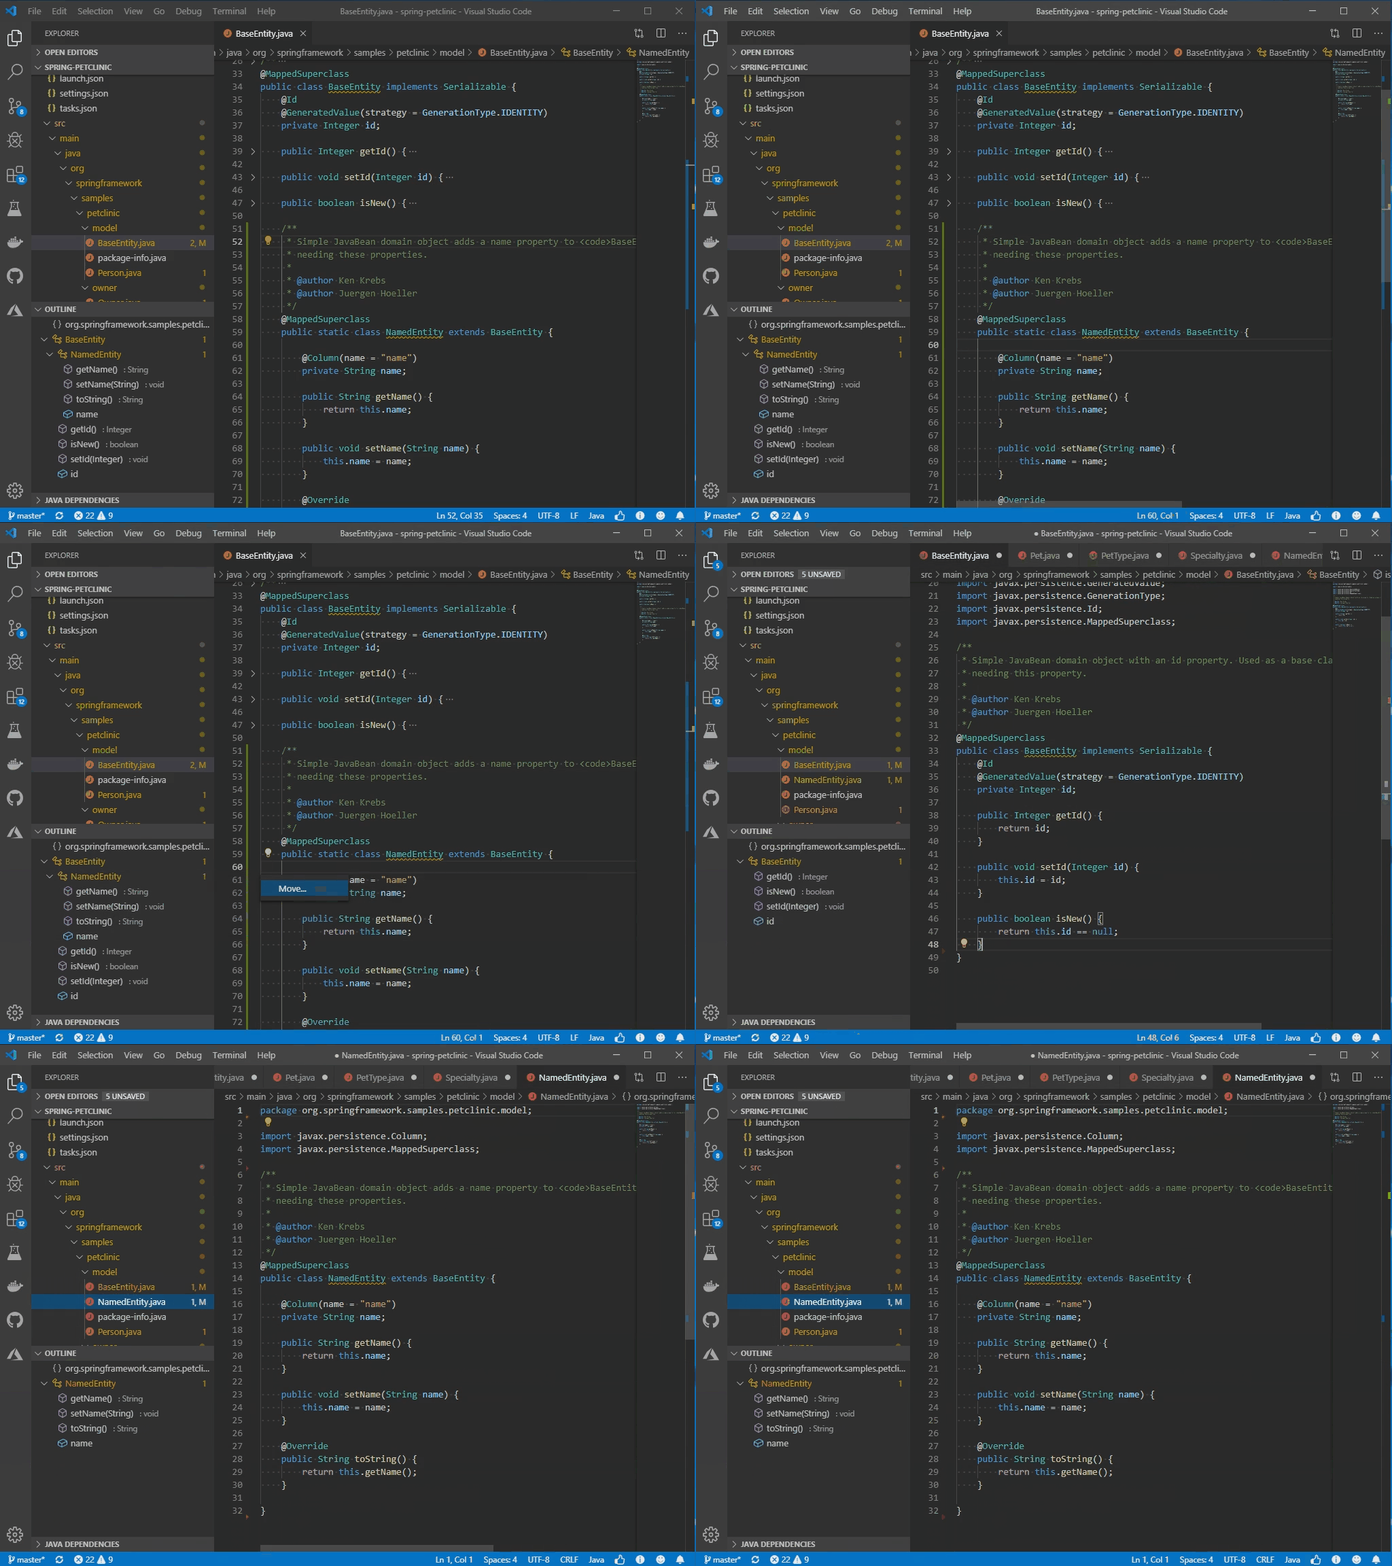
The Move refactoring lets you move packages and classes between the source roots of a project, class members to other classes and inner classes to upper hierarchy levels.

For example, you can perform the move refactoring on static method if it is used more in another class than in its own class.

You can also move a class to another package.

And move inner class to new a new file.

Other new code actions

A couple of other code actions and quick fixes are also included in the latest release

  1. Invert local variable lets you change the sense of a Boolean variable to the opposite one.
  2. Convert lambda to anonymous class (as we already support Convert to lambda expression).
  3. Create unresolved types which covers create simple class/enum/interface/annotation in various scenarios.

Linting and Checkstyle

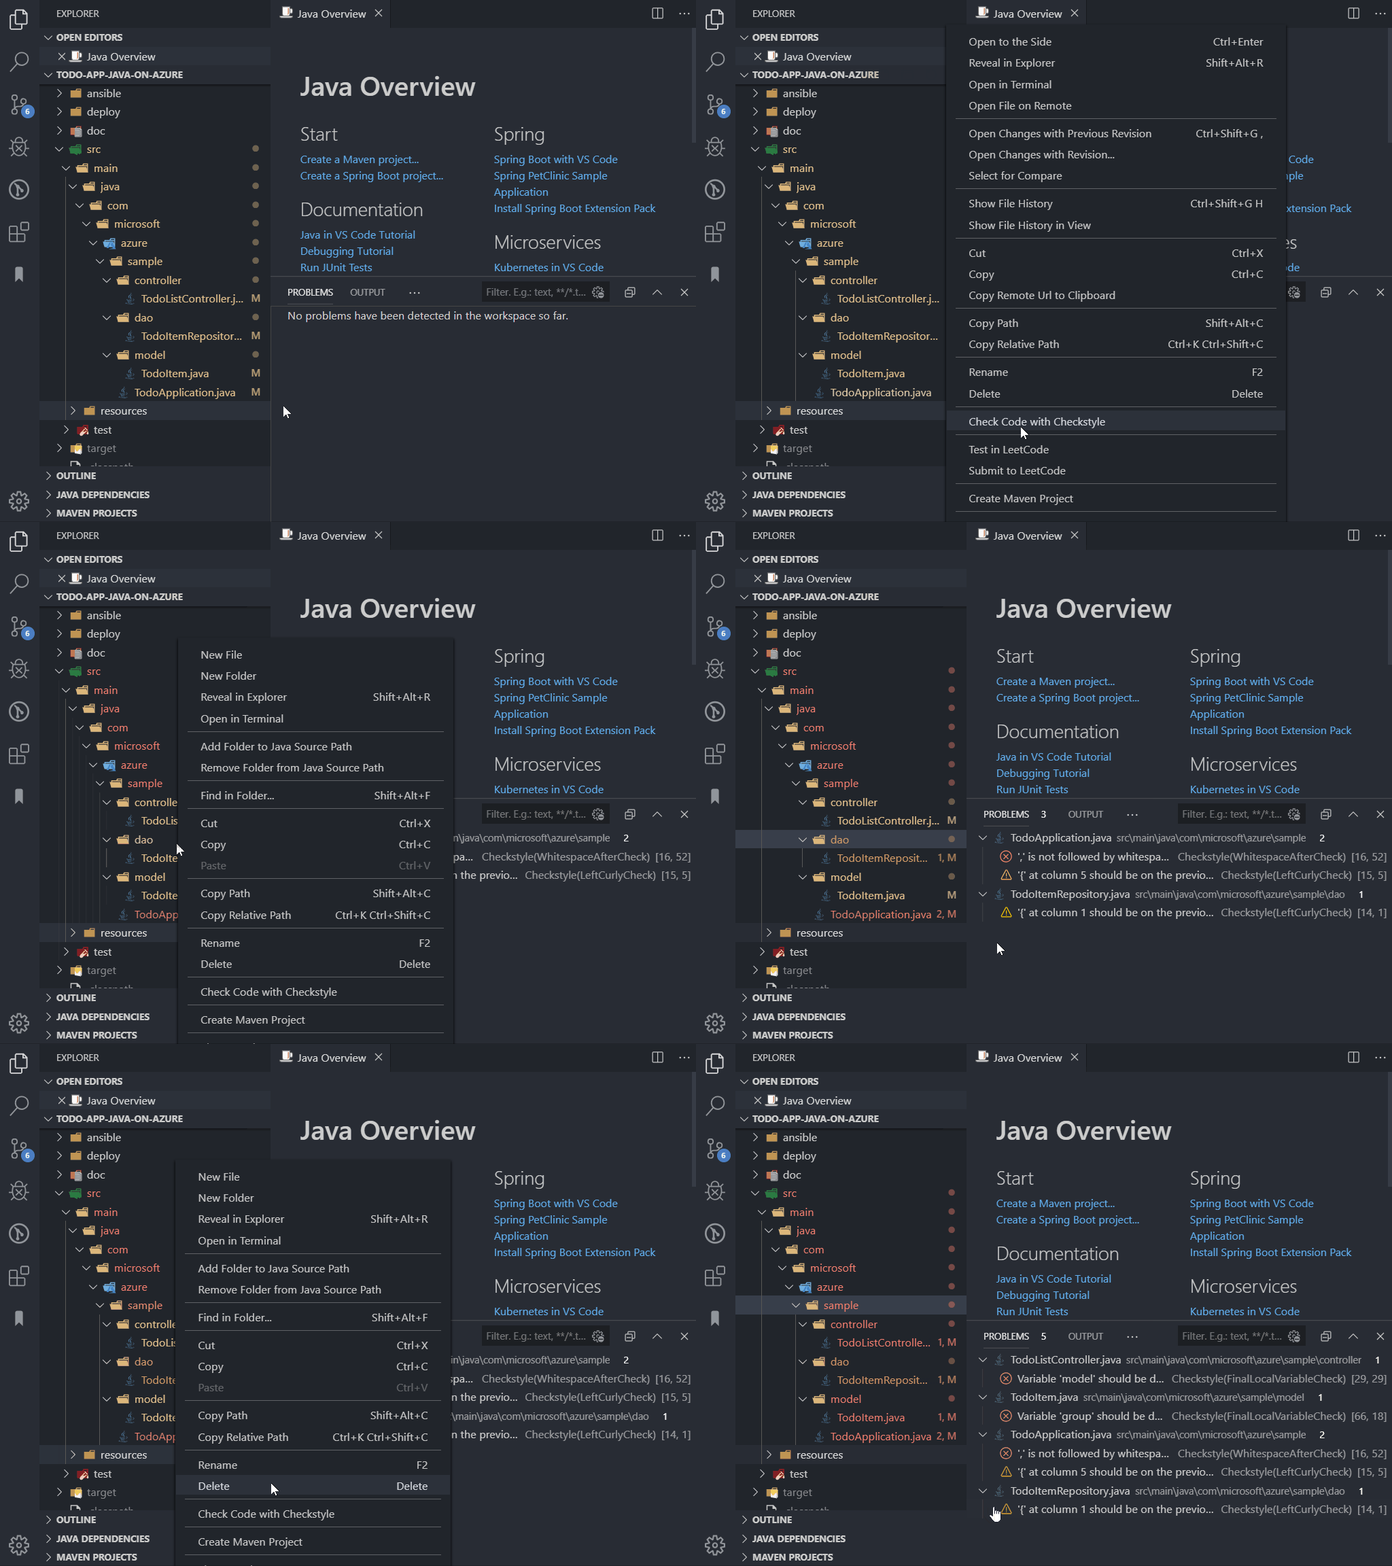
We now support Live Linting and batch check for Java through Checkstyle extension so you no longer need to save the file one by one to update the check result. 

See live linting in action.

And batch check is now also available.

Other improvements in Checkstyle extension include

  1. Open problems panel when click the status icon in the status bar
  2. Automatically detect potential Checkstyle configuration files when using command to set the configuration

Debugger

One of the changes we’ve recently made is to use integrated terminal as default debug console. With this change, you no longer need to make specific configuration to allow the console to accept your input. The only drawback of this change is the integrated terminal doesn’t support expression evaluation. In order to use this feature, you would now need to change the console to use the Internal Console in launch.json.

"console": "internalConsole"

If you’d like to use that setting each time you launch a Java program, you can configure it as a global user setting with java.debug.settings.console.
In order to make run and debug even easier, another change we’ve made is to add menu entries to Run and Debug a Java application when you right click a Java file in file explorer or opened editor.

Test Runner

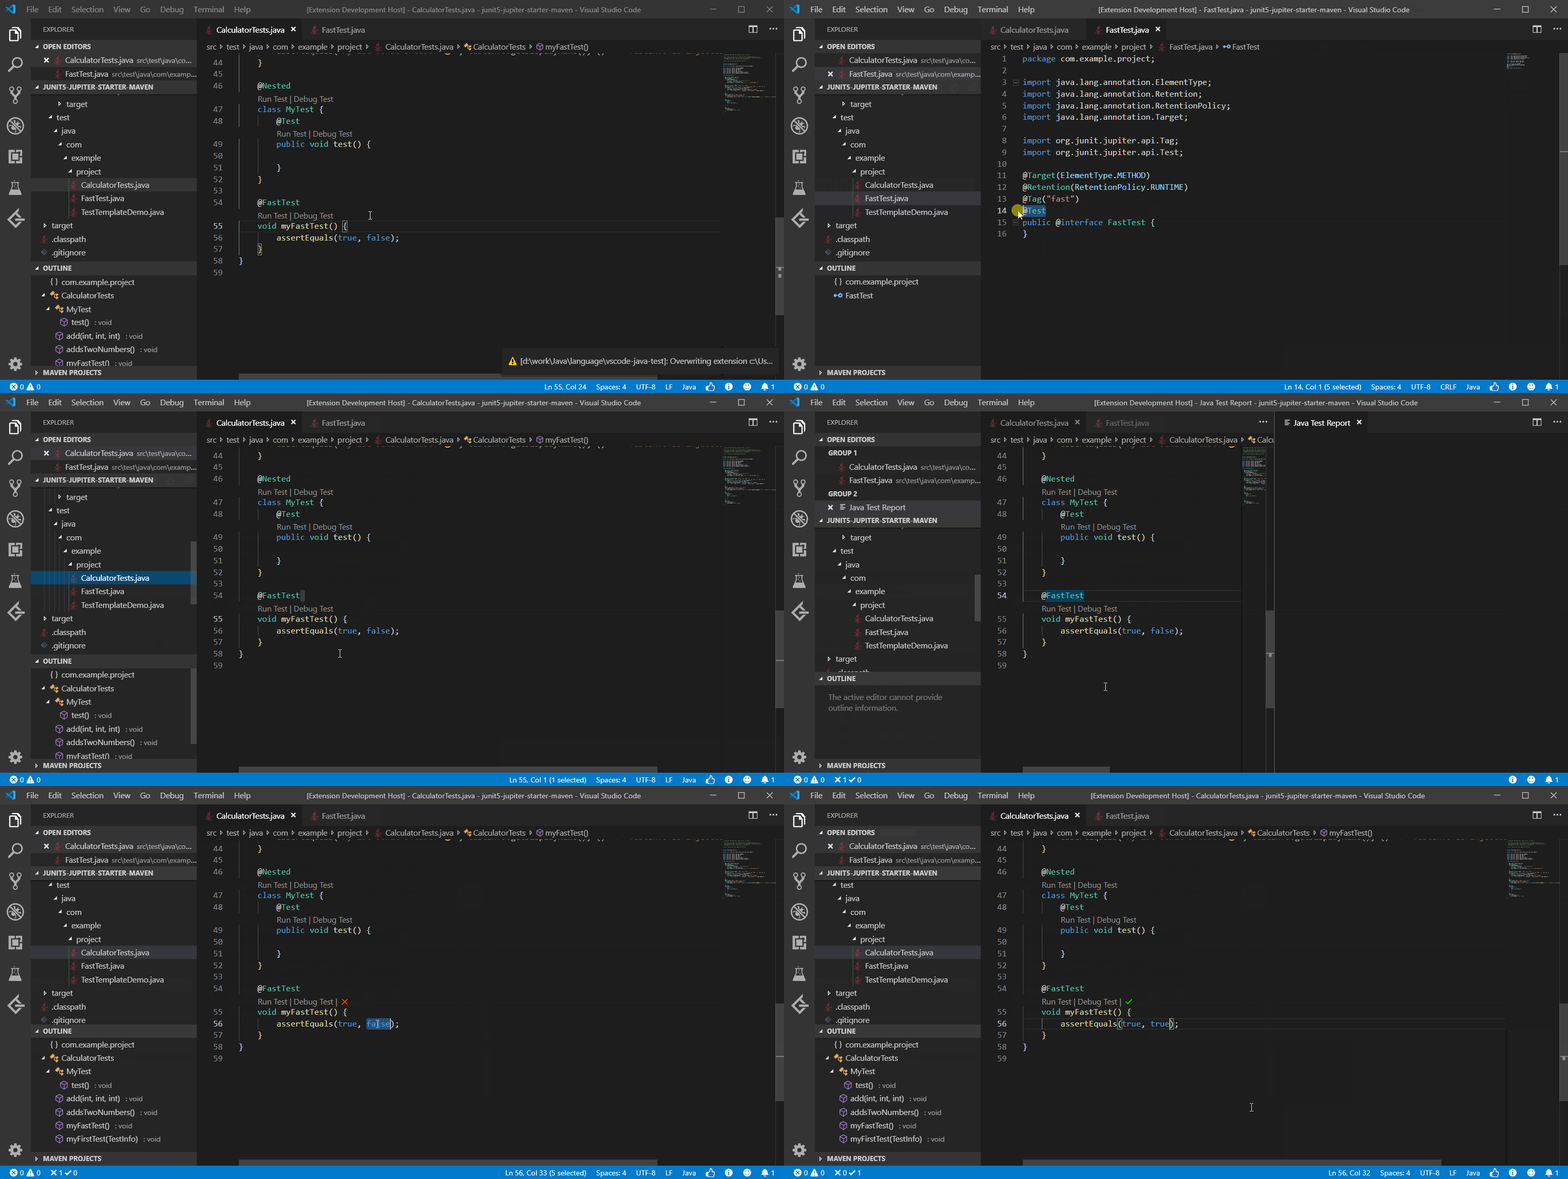
More JUnit 5 annotations are now supported by VS Code Java Test Runner.

Support JUnit 5 meta-annotations and composed annotations.

Support JUnit 5 @TestTemplate.

Getting Started Experience

For developers new to Java or new to VS Code, we’re now providing a refreshed Getting Started experience. Once you’ve installed the Java Extension Pack, you can use the command Java: Getting Started to get the quick start guide.

The new Getting Started view provides a quick start guide as well as tips for code editing and debugging. It also has an FAQ to answer some of the most asked questions. We plan to add more section to it in future.

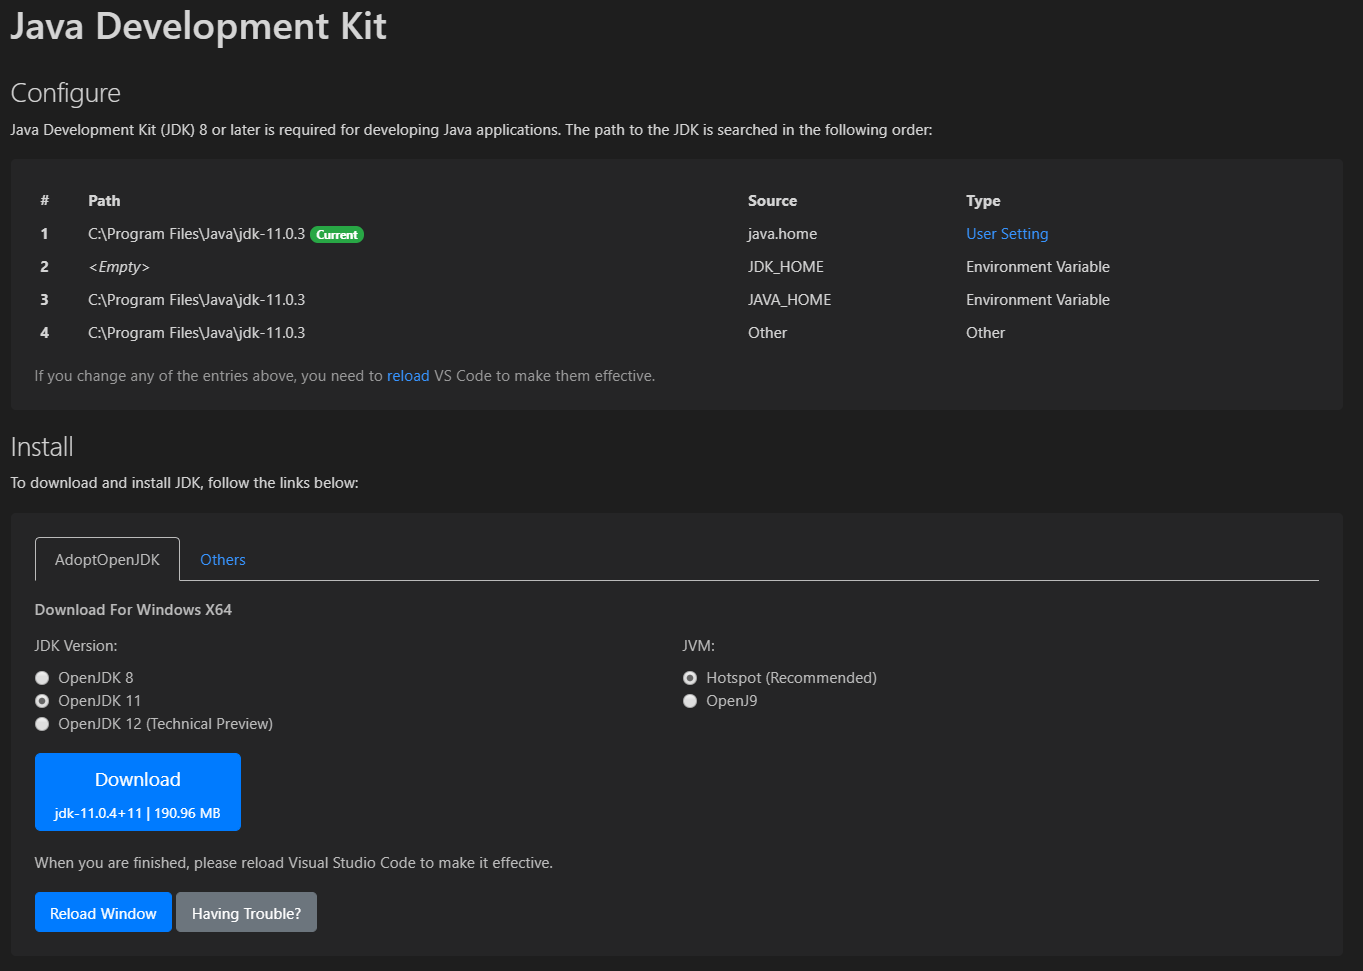
One of the other hurdle for new Java developer is to get the JDK right. For that, we’ve also upgraded our Configure Java Runtime page which now shows the JDK configuration we detect with priority order and allow you to jump to the setting by a simple click. If a working JDK configuration is not detected, this page will be presented automatically, otherwise you can also use the command Java: Configure Java Runtime to get there.

With those new features, we’ve also released our new version of VS Code Installer for Java. You can try it at https://aka.ms/vscode-java-installer-win with improved downloading and installation experience.

External contributions

As VS Code becomes popular among Java developers, we’re getting more and more issues reported. They’re very helpful and please keep them coming! In addition, we’d like to express our gratitude for those from the community who spend more time with us to make the product even better.

  • Contribution from pi1024e: User face change: say “Do not show again” instead of “Not show again”. https://github.com/microsoft/vscode-java-debug/pull/630
  • Contribution from Christian Lutz thccorni: Typo ‘gourpId’ in hoverProvider. https://github.com/microsoft/vscode-maven/issues/368

There’re also a few pull requests from community currently under review. We’d like to thank all of you to help us build better tool for the Java community.

Sign up

If you’d like to follow the latest of Java on VS Code, please provide your email with us using the form below. We will send out updates and tips every couple weeks and invite you to test our unreleased feature and provide feedback early on.

Try it out

Please don’t hesitate to give it a try! Your feedback and suggestions are very important to us and will help shape our product in future.

The post Java on Visual Studio Code September Update appeared first on Visual Studio Blog.

How to debug and profile any EXE with Visual Studio

$
0
0

Have you ever needed to debug or profile an executable (.exe file) that you can’t build locally? Then the least known Visual Studio project type, the EXE project, is for you!

In Visual Studio you can open any EXE as a ‘project’. Just go to File->Open->Project/Solution and browse to the .exe file. Like you would if it was a .sln file. Visual Studio will then open that EXE as a project. This feature has been around for a long time. It works on all currently supported Visual Studio versions and the docs for it are at  ‘Debug an app that isn’t part of a Visual Studio solution‘.

.Opening an exe file with Visual Studio 2019

Debugging

Just as with a normal project you can start debugging with F5, which will launch the EXE and attach the debugger. If you want to debug startup you can launch with F11, which will launch the EXE and stop on the first line of user code. Both of these options are available on the context menu for the EXE project in Solution Explorer window as illustrated below:

Starting debugging from the solution node

For debugging will need to have symbols (PDB files) for the EXE and any DLLs you need to debug. Visual Studio will follow the same process to try to obtain symbols as it does when debugging a normal project. Since it’s not likely that the PDB files were distributed alongside the EXE you might want to locate them from a build drop or, better yet, from a symbol server. More information and best practices for symbols can be found in this blog.

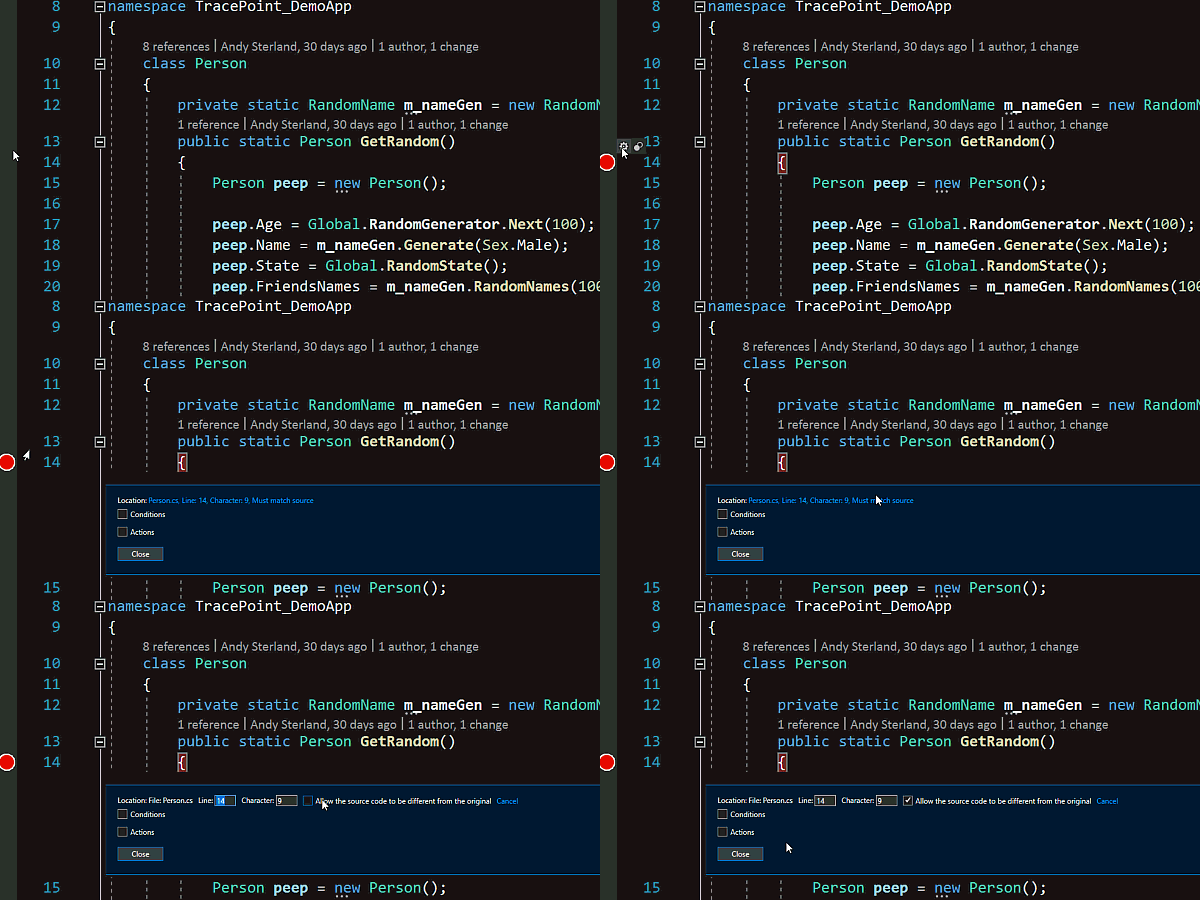
To effectively debug you’ll also need the source code that was used to build the EXE, even for just a few files that you care about. You’ll need to locate those files and open them in Visual Studio. If the source code isn’t the exact same as the source code that was built the EXE Visual Studio will warn you when you try to insert a breakpoint and the breakpoint won’t bind. That behavior can be overridden from the Breakpoint Settings peek window. In the settings peek window click on the Must match source link text and then check the box to allow mismatched source, as illustrated below. Of course, with mismatched source you never really know what’s going to happen, so use at your peril.

Setting the breakpoint to not require exact source.

If the EXE was built with SourceLink enabled then information about the source will be included in the PDBs and Visual Studio will try to download the source automatically. This is a really good reason to use SourceLink with your projects. Even if you have a local enlistment you might not have the same version that was used to build the binary. SourceLink is your sure-fire way to make sure that the right source is linked with the right binary.

If you can’t obtain any source code you still have a couple of options:

  1. Use a tool to decompile the assemblies back into C#, which you can then recompile into a new assemble to patch the old one.
    1. ILSpy is a great choice for this, but there’s plenty of other good paid and free tools out there.
    2. [Note: Several comments have also pointed out dnSpy https://github.com/0xd4d/dnSpy as a great solution for this – thanks!]
  2. Use the Disassembly tool window in Visual Studio.
    1. The Source Not Found document has a link to view disassembly. Be warned, if you’re used to debugging C# code the disassembly view is a tool of last resort.

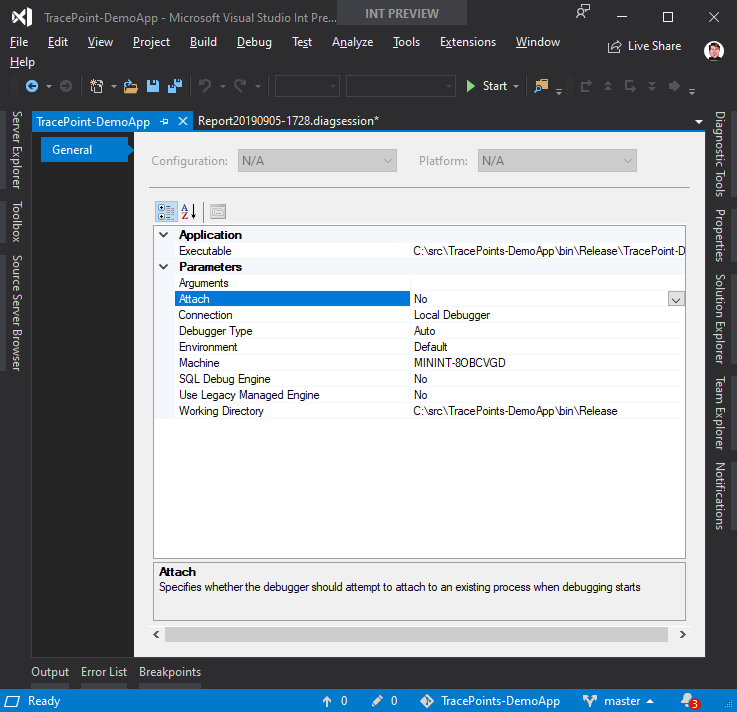
Lastly, if you need to pass in any arguments to the EXE that’s being debugged you can configure them along with other options in the Project Properties page (Right Click->Properties on the project node in solution explorer).

Project properties page for the exe project.

Profiling

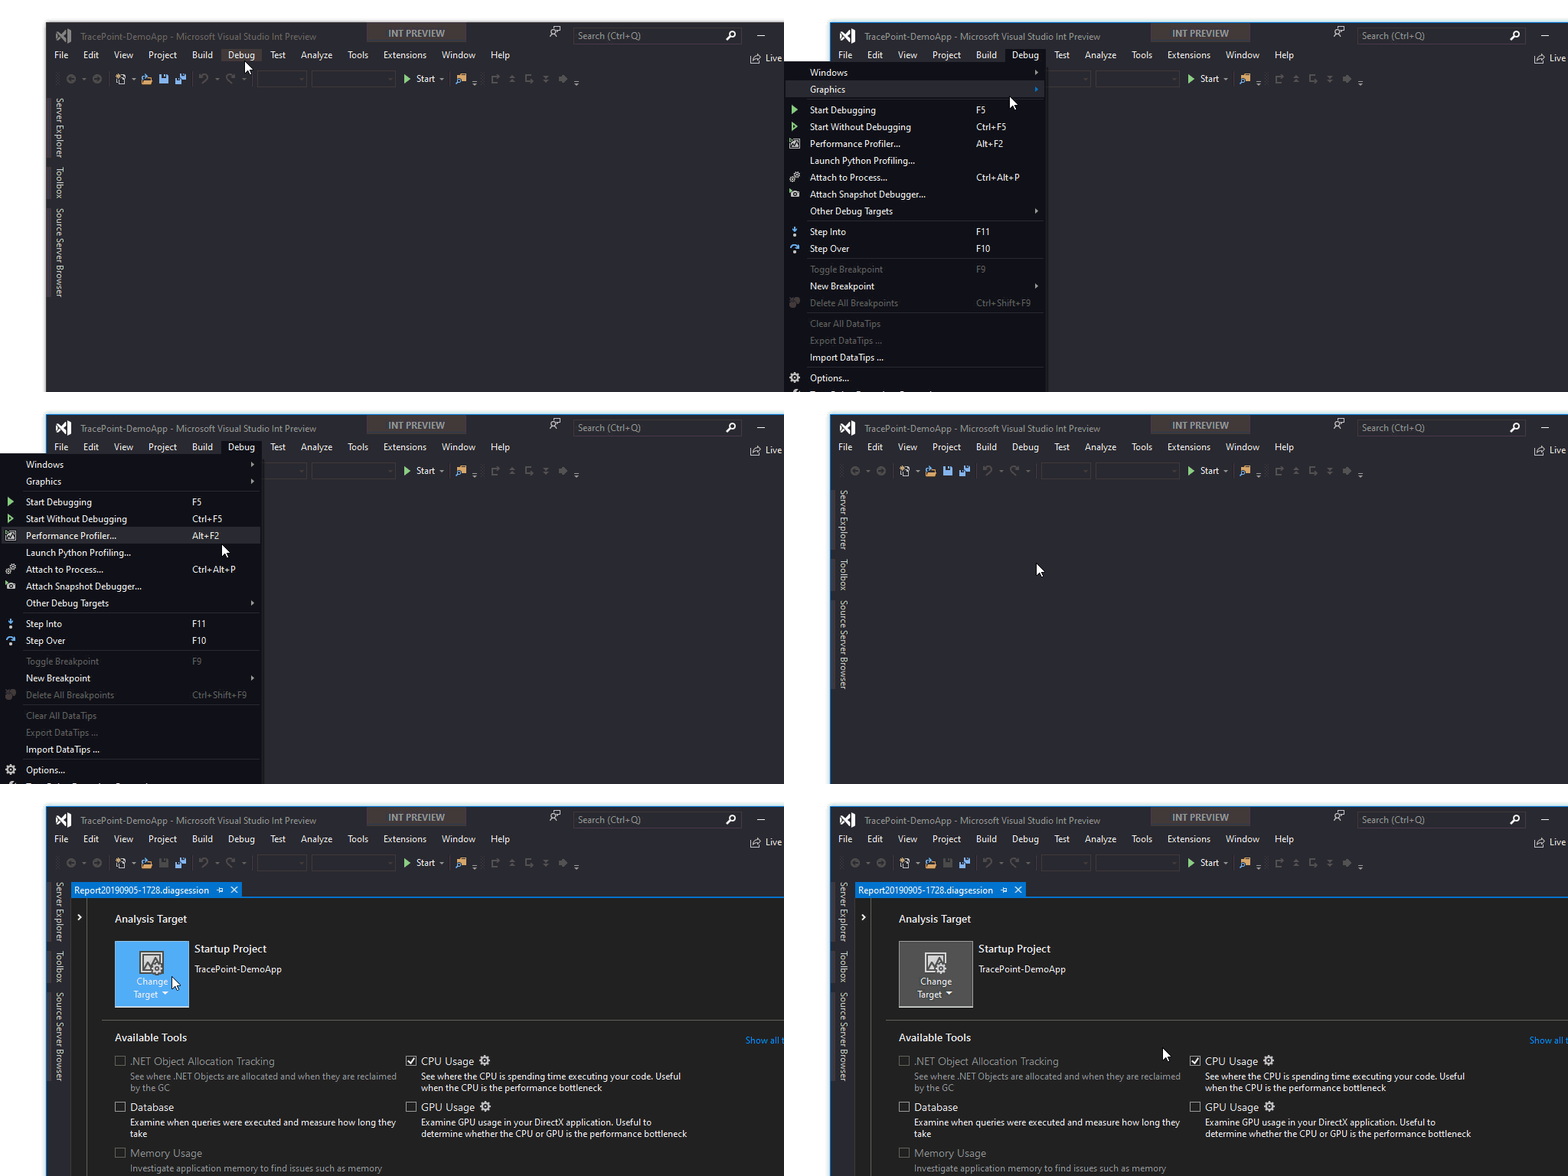
You can also use the profiling tools with the EXE by launching them from the Debug -> Performance Profiling. From the launch page of the profiling tools you can select what tools to use against the EXE. More information on profiling can be found in the docs over at :https://docs.microsoft.com/en-us/visualstudio/profiling/profiling-feature-tour?view=vs-2019.

Launching the performance profiler for an exe project.

Conclusion

That’s it. A brief overview of how you can use Visual Studio to debug and profile applications that you aren’t building and might not even have source for. So, next time you need to debug or profile an EXE don’t forget you can open it as a Solution in Visual Studio!


The post How to debug and profile any EXE with Visual Studio appeared first on Visual Studio Blog.


.NET Core Support and More in Visual Studio 2019 version 16.3 – Update Now!

$
0
0

As we continue to deliver on our mission of any developer, any app, any platform, it’s always an exciting time on the Visual Studio team when we get to launch major features.  Today we’ve released Visual Studio 2019 version 16.3 which contains support for the release of .NET Core 3.0, significant C++ improvements, and great updates for Python developers as well as TypeScript 3.6 support. You can download version 16.3 on visualstudio.com or update from the Visual Studio installer.

We are also releasing the first preview of Visual Studio 2019 version 16.4 which can be downloaded from visualstudio.com. For additional information on what’s in Preview 1, check out the release notes.

So, grab your favorite fall beverage, click the update button in the Visual Studio Installer or download the latest version, and while the update commences, peruse this overview of what’s new and awesome in this release.

.NET Core 3.0

Visual Studio version 16.3 includes support for .NET Core 3.0.  Why is .NET Core 3.0 exciting?  Here’s what Scott Hanselman has to say:

“.NET Core is open source and cross-platform.  You can use .NET Core to run server applications on Windows, Mac, a dozen Linuxes, iPhone, IoT devices, and more! .NET Core is open source, cross-platform, and fast as heck. And it’s out today. Fully supported. Open source, yes, but fully supported with the full weight of Microsoft.

Together with .NET Core 3.0, C# 8.0 is out today!  It’s also open source and is the language that many of you will use to make your applications.  Visual Studio 16.3 supports both C# 8.0 and .NET Core 3.0, and provides tooling support for all new .NET Core 3.0 features.  This includes support for building desktop applications with Windows Forms and WPF, client-side web applications with Blazor and back-end microservices using gRPC.

While .NET Core 3.0 is cross-platform, you can also create platform-specific applications!  This means your apps can “light up” with operating system-specific features.  For example, if you want to talk to a light sensor on a Raspberry Pi with .NET Core, you can!

Taking this to obvious next steps, you take (if you want) a 15-year-old existing Windows Forms or WPF app and swap out it’s “engine” for all new .NET Core 3.0 and reap the benefits. It’s a brain transplant that can make your application faster, easier to deploy, and easier to maintain but it will still be a Windows app using your existing code.

You might think because .NET Core 3.0 includes support for Windows Forms and WPF that it might be heavier or take up more space.  In fact, this support exists in optional NuGet packages.  Your .NET Core apps are smaller than ever (and will get even tighter in future releases) and run amazingly well in containers/Docker and in the cloud where density is needed.”

There are so many exciting features in .NET Core 3.0. Head over to the .NET Blog to read all of the details.

NOTE if you are working with .NET Core 3.0, you will need to use Visual Studio version 16.3 or greater.

.NET Core Desktop Application Support

.NET Core 3.0 includes full support for Windows Forms and WPF applications. 

In Visual Studio 2019 version 16.3, you have the familiar tooling you expect for building and publishing WPF applications, including the WPF XAML designer, tools for creating MSIX packages for WPF applications and more. 

Also, we are happy to announce that the first preview version of the Windows Forms Designer for .NET Core projects is available today! We are in the very early days of the designer, so it’s available as a Visual Studio extension (“VSIX”). Once you install the .NET Core Designer, Visual Studio will automatically pick the correct designer based on the target framework of your application. This preview of the designer supports a subset of controls, but more will be added every month in further preview versions. That’s why we don’t recommend porting your Windows Forms applications to .NET Core yet if you need to use the designer on a regular basis.

In addition to supporting WPF and Windows Forms with .NET Core, we recently introduced support for WPF and Windows Forms in Visual Studio App Center as a public preview.  This blog post will give more details.

Please reach out with your suggestions, issues, and feature requests. We appreciate your engagement!

Download .NET Core Windows Forms Designer Preview 1 

.NET Applications in Containers

Developers building Azure Functions (v2) can now add Docker container support (Linux only) to their C# projects. This can be done by right-clicking the project name in Solution Explorer and selecting Add > Docker Support. In addition to adding a Dockerfile to your project, the debug target will be set to “Docker” which means when you debug your Function app it will happen inside the running container.

.NET Applications in Containers


Also, be sure to check out the Visual Studio Container Tools Extensions (Preview) for a glimpse of even better tooling coming in Visual Studio 2019 version 16.4 Preview 2.

.NET Productivity

Since C# 8.0 and .NET Core 3.0 are out today, Visual Studio tooling is updated to make you more productive when using these new tools.  Here’s a taste of the dozens of refactorings and happiness features we’ve added.

You can wrap chains of fluent calls with a refactoring.  To try this out, place your cursor on a call chain and press Ctrl + . to open the Quick Actions and Refactorings menu.

Wrap Chains of Fluent Calls
Wrap Chains of Fluent Calls with Quick Actions and Refactoring


Now you are also able to rename a file when renaming an interface, enum or class.  To do so, just place the cursor in the class name and type Ctrl + R, R to open the Rename dialogue and check the Rename file box.

Easily rename a file when renaming interface, enum or class
You can easily rename a file when renaming an interface, enum, or class.
.NET in version 16.4 Preview 1

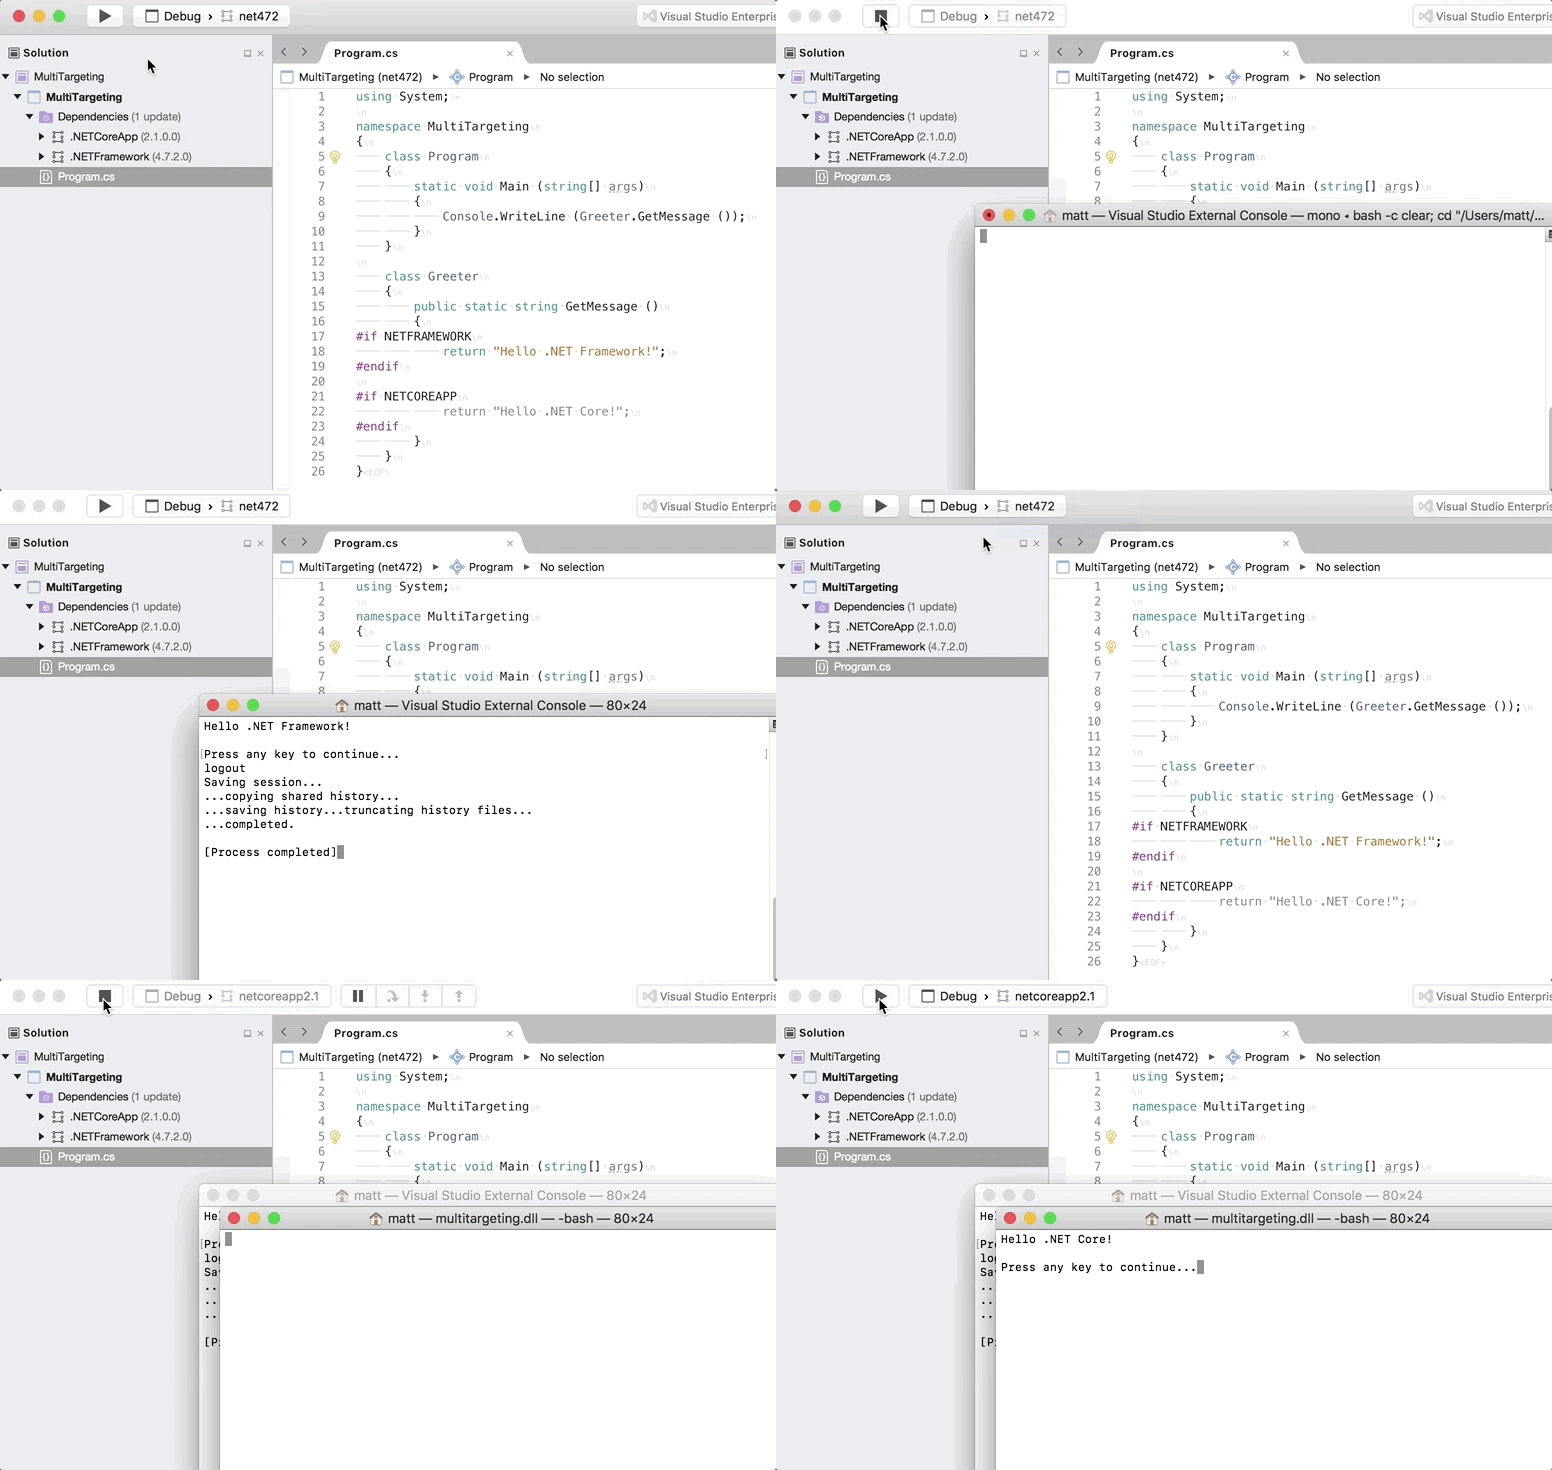
If you are a developer wanting to try the cutting-edge tools in .NET, check out the features in Visual Studio 2019 version 16.4 Preview 1.  It includes new .NET Core 3.0 app publishing options:  Ready to Run (Crossgen), Linking, and SingleExe (make tiny .NET Core 3.0 apps) as well as new templates. Again, the release notes contain a larger list of features.

C++

Visual Studio 2019 version 16.3 brings new productivity features to all C++ developers and enhancements to the C++ cross-platform development experience.

Beyond those two aspects (which we’ll dive into next), those of you following our C++ Standard conformance efforts will be glad to hear that in the C++ Standard Library (STL), several new preview features are available under the /std:c++latest switch, including C++ Concepts! Concepts are predicates that can be used to express a generic algorithm’s expectations on its template arguments.

C++ Productivity

There are several improvements for C++ developers to be excited about. For example, you can toggle line comments using the keyboard shortcut Ctrl + K, Ctrl + / to easily set aside code you don’t want to compile just yet.

Set Aside Code to Compile for Later


The IntelliSense completion list is now more powerful than ever with a built-in filter that considers type qualifiers. For example, if you type after const std::vector, the list will now filter out functions that would illegally modify it, such as push_back.

Intellisense Improvement
Intellisense Build-in Filter that Considers Type Qualifiers


Next, a new default semantic colorization scheme allows you to better understand your code at a glance. You will notice new colors in the following areas: functions, local variables, escape characters, keyword – control (if/else/for/return), string escape characters, and macros. There is also an option to differentiate between global and member functions and variables. The screenshots below illustrate new colorization for the blue and dark themes of Visual Studio:

The Colorization for the blue and dark themes of Visual Studio


Lastly, we turned IntelliCode on by default for C++ developers for AI-powered IntelliSense, added a way to configure the Call Stack window to hide or show template arguments for improved readability, and added some new CppCoreCheck rules to Visual Studio Code Analysis, including a new ‘Enum Rules’ rule set and additional const, enum, and type rules.

C++ Cross-Platform

Switching gears from productivity to cross-platform development, we made several user experience improvements. First of all, for CMake projects, you can now install missing 3rd party libraries that your application depends on straight from the IDE, using Vcpkg, our cross-platform C++ library manager. You will need to have Vcpkg installed on your machine, have run ‘vcpkg integrate install’ to set it up, and have a vcpkg toolchain file in your CMake project to take advantage of this feature. When you activate this feature, Vcpkg will download your library from source, compile it for you, and make it available for use for your future builds. This quick action will also install the package’s upstream dependencies for you.

Install Missing 3rd Party Libraries


Next, the CMake Settings Editor has been updated with better settings descriptions and links to documentation so it is easier than ever to configure your project. Below is a screenshot of the new experience:

CMake Editor Updates
CMake Settings Editor has been Updated


There were a few more improvements to the cross-platform development experience. This includes environment variable support for configuring debug targets and custom tasks in launch.vs.json and tasks.vs.json. In addition, remote header copies for Linux projects now run in parallel for improved performance. Visual Studio’s native support for WSL also supports parallel builds for MSBuild-based Linux projects. Lastly, you can now specify a list of local build outputs to deploy to a remote system with Linux Makefile projects.

Python

With this release you will enjoy a revamped testing experience for your Python projects. Not only there is now support for the popular pytest framework, but the support for the unittest framework has been improved to provide you with a more seamless testing experience. Let’s walk through some of those improvements from configuring & executing tests, to debugging, and finally code coverage.

Configuring and Executing Tests

Let’s look at how you do this for Python projects, and then for the Open Folder scenario.

To enable the testing experience within Visual Studio for Python projects, right-click on the project name and select the ‘Properties’ option. This option opens the project designer, which allows you to configure tests by going to the ‘Test’ tab. From the ‘Test’ tab, simply click the ’Test Framework’ dropdown box to select the testing framework you wish to use, as you can see in this screenshot:

Test Framework Dropdown Box
Test Framework dropdown box for configuring testing.


Pressing CTRL+S initiates test discovery for the testing framework you have selected, whether that is pytest, or unittest.

For Open Folder scenarios, the testing experience relies on the PythonSettings.json file for configuration. This file is located within your ‘local settings’ folder as shown here:

Configuring the .json file
Configure the PythonSettings.json file for Open Folder scenarios.
Code Coverage for Tests

Below you can see how Code Coverage is supported for unittest and pytest in both project mode and open folder scenarios:

Code Coverage is supported for unittest and pytest
Code Coverage supported for unittest and pytest in both project mode and open folder scenarios.


To enable Code Coverage for your currently opened project/folder, you must install the Python package, coverage, into your active virtual environment. Then, you can analyze Code Coverage by going to the Test Explorer and selecting Analyze Code Coverage for All Tests.

Read our Python documentation for further details on making the most of the new testing experience.

Version 16.4:  Our Next Servicing Baseline

When version 16.4 moves to the release channel later this year, it will be the second “servicing baseline” for Visual Studio 2019. We introduced servicing baselines with Visual Studio 2019 to provide large organizations increased flexibility over when they adopt the new features in minor version updates included in the Enterprise and Professional editions. Unlike versions 16.1, 16.2, and 16.3, which received servicing fixes only until the next minor update is releases, we offer fixes for servicing baselines for an extended period. We will service version 16.4 for 12 months after the next servicing baseline is declared.

As version 16.0 is the first servicing baseline, it will continue to receive servicing fixes for one year after version 16.4 releases later this year. Full details can be found at Visual Studio Product Lifecycle and Servicing.

Update now and let us know what you think

If the above summary got you as excited as we are, head on over to visualstudio.microsoft.com/downloads to get the latest releases. As always, you can continue to use the Report a Problem tool in Visual Studio or head over to the Visual Studio Developer Community to track issues or suggest a feature. We continue to make many tweaks and improvements along the way to address your feedback, and rest assured that we will continue doing so in releases going forward.

The post .NET Core Support and More in Visual Studio 2019 version 16.3 – Update Now! appeared first on Visual Studio Blog.

Visual Studio 2019 for Mac version 8.3

$
0
0

Today, we’re releasing version 8.3 of Visual Studio 2019 for Mac – our .NET IDE, built natively for macOS. This release is predominantly driven by your feedback: delivering a faster and more reliable ASP.NET Core web developer experience, reducing the time between coding and testing Xamarin UI changes, and including a few “delighters” to make your experience even better. 

These are the 3 top requests we’ve focused on in this release: 

ASP.NET Core developers will find this release really exciting. In addition to the items mentioned above, we’ve made the following improvements for your daily coding lives: 

Mobile developers using .NET and Xamarin also have new features to look forward to: 

Finally, v8.3 also includes several “delighters” across the product such as tab pinning, support for launchSettings.json in .NET Core projects, and an easier way to get started with your preferred keyboard shortcuts.  

In this post, we’ll cover a few of the highlights mentioned above. To learn about all the changes in this release, be sure to check out therelease notes. 

Support for .NET Core 3.0, .NET Standard 2.1, and C# 8.0 

This release officially supports .NET Core 3.0. .NET Standard 2.1, and C# 8.0Whether you install the IDE for the first time or update from a previous release, the .NET Core 3.0 SDK will be installed automatically for you. You can create, build, run, debug, and publish .NET Core 3.0 applications. 

When you’re editing C# 8.0 files in Visual Studio for Mac, you’ll have access to new C# 8.0 features like readonly members and switch expressions. All the existing editor functionality, such as IntelliSense and Quick Fixes, will also continue to work. For more info on what’s new in C# 8.0, head over to the docs to read about  What’s new in C# 8.0. 

NuGet solution-level package management 

We’ve also added support for NuGet solution-level package management functionality, a top requested item on the Developer Community site. As the number of projects grow within a solution, it becomes harder to keep same version of packages across the projects. With the improvements we made in this area, now it’s easier to consolidate to a single version of packages across the solution. 

NuGet package management dialog, showing package consolidation in Visual Studio for Mac

Multi-Targeting 

When building modern .NET libraries, it’s common for library authors to target a variety of platforms and devices. .NET Standard is the best solution for adding support for multiple platforms, but sometimes it’s necessary to use APIs in .NET frameworks that don’t support .NET Standard. In that case, the best solution is to use multi-targeting to build for multiple .NET frameworks. Recently, we included support for working on projects that support multi-targeting, another highly requested feature. When editing code in one of these projects, you can use a Target Framework drop down at the top of the editor window to focus your editing experience on a specific target framework. 


Dependencies are also now displayed broken down by target framework, and when running your project you can choose the target framework against which to debug.  

All web editors, now updated 

A major focus of the Visual Studio for Mac v8.3 release is optimizing the ASP.NET Core developer workflow. We’ve heard from hundreds of .NET Core developers and focused our efforts on addressing the community’s feedback. In this release, we’re introducing new web editors based on the same editors (and code) as Visual Studio on Windows, and support for managing NuGet packages across multiple projects at the solution level.  

 Since the initial release of Visual Studio 2019 for Mac in April, we’ve been working to update all the editors within the IDE. In v8.1, we introduced the new C# editor. v8.2 brought the new XAML editor to Visual Studio for Mac. In v8.3, we’re updating all the web editors! The new web editors are based on the same native UI as the C# and XAML editors and provide all the advanced features recently introduced to Visual Studio for Mac, such as multi-caret editing, RTL support, and native input support. In addition to these high-level editor features, the new web experience is also powered by the same core as Visual Studio on Windows, so you can expect the same language service features that make Visual Studio such a productive IDE. These language services provide vital features, such as IntelliSense as well as code formatting, syntax highlighting, and navigation support.   

The new editors support a variety of web files, including HTML, CSHTML, JS, JSON, and CSSThis also brings support for a common request, IntelliSense and syntax highlighting for languages embedded in .cshtml: JavaScript, C#, and CSS! This means you get all features as appropriate for the file types you are working within, so you will see advanced IntelliSense in JS, CSHTML and more. We have also improved support for LESS and SASS files. The web experience in Visual Studio for Mac has never been better! 

Typing CSS into a .cshtml file in Visual Studio for Mac, showing suggestions for CSS properties while typing. 

ASP.NET Core: File Nesting support 

We’ve also added automatic File Nesting for ASP.NET Core projects. The auto file nesting rules applied are the same as what you find in Visual Studio. With file nesting enabled, you can focus better on the files that you edit most frequently. Generated files, and less frequently edited files will be nested under other related files. Check out the screenshot of the Solution Pad showing the nesting behavior. 

The solution pad open, showing an Index.cshtml.cs file nested underneath an Index.cshtml file


Debugging ASP.NET Core apps on multiple web browsers 

Finally, for ASP.NET Core development, we’ve added one more popular feature request – support for targeting multiple web browsers. Now, when debugging an ASP.NET Core app, you can pick the browser in which you want to run your app. This makes it a lot easier to make sure you’ve got just the right experience in each browser your app supports. 

Drop down menu in Visual Studio for Mac showing target web browser selection  

XAML Hot Reload for Xamarin.Forms Preview 

We are making XAML Hot Reload for Xamarin.Forms available in this release as a preview. XAML Hot Reload enables you to rapidly iterate on your Xamarin.Forms UI without needing to build and deploy. When debugging your app, you can now edit your XAML and hit save to see the changes immediately reflected on the running appThis works on all valid deployment targets, including simulators, emulators, and physical devices. To get started, check out the XAML Hot Reload documentation. 

Editing .xaml files in VS for Mac, seeing the UI update automatically in the simulator while editing.

Android 10, Xcode 11, and iOS 13 Support for Xamarin 

With Visual Studio for Mac version 8.3, Xamarin developers can take advantage of the latest-and-greatest features from both Google and Apple.  

Android 10 introduces a variety of new features such as dark theme, gestural navigation, and optimizations for foldable devices. iOS 13 provides the next generation of existing features like SiriKit and ARKit, while also introducing new features such as Dark Mode and Sign In with AppleTo learn more about how you can use these new features in your apps, head over to our Android 10 with Xamarin and Introduction to iOS 13 documentation pages. 

New “Delighters” for all developers 

A common request we’ve heard from developers who use both Windows and macOS is to support more of the same keyboard shortcuts as Visual Studio on Windows. Visual Studio for Mac has long had support for configurable “Key Bindings” that allow you to select from a set of pre-defined profiles and customize shortcuts to your liking. You can configure these from the Preferences > Key Bindings screen. 

In this release, we’ve added a new prompt on first launch of the IDE, to make it easier for you to customize the IDE to work the way you want it. 

Selecting Visual Studio for Mac keyboard shortcuts, with a list of shortcuts for Visual Studio (Windows), Visual Studio Code, or Xcode

Another helpful improvement added into this release is support for document pinning. Now, you can take any document in the IDE, right-click on it, and choose to “pin” it to remain open on the left-hand side of all your document tabs. 

Selecting to pin a tab, and then unpinning it


Download today 

Download the Visual Studio 2019 for Mac v8.3 release todayor if you have it installed already – updatto the latest release using the Stable channel 

If you run into any issues with the v8.3 release, please use the Help > Report a Problem menu in the IDE to let us know about it. You can also provide suggestions for future improvements by using the Provide a Suggestion menu. 

report a problem context menu

Finally, make sure to follow us on Twitter at @VisualStudioMac to stay up to date on the latest Visual Studio for Mac news and let us know what your experience has been like. We look forward to hearing from you! 

The post Visual Studio 2019 for Mac version 8.3 appeared first on Visual Studio Blog.

Tracepoints: Debug with less clutter

$
0
0

Have you ever accidentally shipped a log statement to production? Are you tired of cleaning up log statements while debugging? The tool to solve your problems has been here all along!

Do you use log statements to debug?

Let’s be honest we have all done it at some point. Whether it be Debug.WriteLine(), console.log(), print(), etc. logging output to the console is a common practice that leads to what some might call “immediate feedback”. But what seems like a simple and enjoyable approach to debugging quickly turns into a lot of cleanup work because the log statements are now littered through your code. After all no one wants to see your log statements shipped to production.

Do you find code cleanup tedious?

If so, then Tracepoints are a great tool you can use in Visual Studio. This feature allows you to log desired information without modifying your code and is initialized in a similar fashion to breakpoints. When you are done debugging simply click on a tracepoint to remove it.

The solution has been here all along

Tracepoints are not a new feature. In fact, they have existed in Visual Studio since 2005, but we feel that many developers do not know about this capability. In this post, we will go over what tracepoints can do, how to use them, and why they are a feature worth using.
For an even more thorough explanation of tracepoints, see our docs page: https://docs.microsoft.com/en-us/visualstudio/debugger/using-tracepoints?view=vs-2019.

Let’s look at an example

The following program is a for loop with a counter variable increasing by one each time the loop iterates. Let’s say we wanted to print out the value of counter for each iteration of the for loop. One solution is to use a log statement such as Debug.WriteLine(counter) to print out the values. Let’s see what that would look like:

While that certainly accomplished this simple task, it required us to modify our code and will necessitate we delete the statement later so that the log statement is not shipped to production. You also will need to delete log statements periodically even before shipping to production as you add newer log statements so that the Output window in Visual Studio is not cluttered with irrelevant information. Furthermore, there is no conditional logic to when these statements print such as only printing the “counter” variable when it is an odd number. Adding conditions would require more code, further complicating the debugging process and creating more cleanup for later. We believe that there is a better way to handle these situations.

Tracepoints to the rescue

The GIF below demonstrates how to initialize a tracepoints.

Notice how when you add a message in the “Show a message in the Output window field” under the actions menu you are not modifying your original code in any way. By this I mean you do not need to add print statements or functions such as Debug.WriteLine() in the middle of your code just to see information in Visual Studio’s Output window. This allows you to get the desired information in Visual Studio’s Output window that you wanted before without compromising the readability of your code. Furthermore, when you are done debugging simply click on the tracepoint once to delete it. Simple as that. If you forget to delete a tracepoint don’t fret about the extraneous output showing up in production. That’s because tracepoints only exist locally on your machine.

You can add conditions too

What about those cases earlier when we wanted conditions? Let’s say we wanted every other count or the value of counter during a specific iteration of the for loop. Well it turns out we can add conditions too in a similar fashion to conditional breakpoints.


There are three condition types:

  • Conditional Expression: Output message displayed only under certain conditions such as “counter >= 5”.
  • Hit Count: This condition allows you to output only after a pre-specified number of times the line the tracepoint was set on has been executed.
  • Filter: Tracepoint will only be activated on specified devices, processes or threads.

Adding these conditions will not modify your original code and unlike breakpoints does not stop the program and require a user to repeatedly step into or over a program (as long as the “Continue code” box under Actions is checked).

Tips and tricks

Currently tracepoint messages go to Visual Studio’s Output window. It is easy to lose track of the messages amongst the many other things that get sent to the same window.

  • If you right click within the Output window, you can turn off classes of messages such as Exception Messages, Step Filtering Messages, Process Exit Messages, etc by clicking on them. By turning off some of these classes of messages that you may not want, it will make it easier to focus on your tracepoint output.
  • If your current task requires you keep all the classes of messages on, another trick to make it easier to find your output is to prefix your action’s message with a unique phrase like “AA”. Once you start debugging your program you can use the CTRL-F command in the Output window to search for the prefix you set and it will take you straight to your output message (see image below).

  • To temporarily disable a tracepoint without deleting it is to hit “Shift + left click” on the tracepoint.
  • To view, disable, and/or delete all the Tracepoints and Breakpoints in your current file at once hit Debug -> Windows -> Breakpoints to access the Breakpoints window.

When logging might be useful

In some cases, a language’s log statement such as Debug.WriteLine() in C# may be a better choice than using tracepoints. For example, if you want to always see some output in the debugger that persists beyond the current debug session then Debug.WriteLine() might be the right option in that context. Tracepoints do not persist beyond a single (or possibly a few) debug sessions. Another consideration is efficiency. Tracepoints are also less efficient at debug time so if they too slow for your needs try a log statement instead. Lastly, tracepoints have limitations in what data they can collect because they can only virtually execute function evaluations. Despite some of these restrictions, we still feel like tracepoints are a great tool to have in your debugging toolkit.

Wrapping up

In conclusion, tracepoints are a great way to keep your code clean during debugging. You will not need to modify your original code or remove statements later. If you want conditions you can add those as well without needing continuously stop and step through your program. We hope you enjoy using tracepoints and that they streamline your workflow! For more information on tracepoints please check out our docs page: https://docs.microsoft.com/en-us/visualstudio/debugger/using-tracepoints?view=vs-2019

If you have any feedback, please feel free to reach out to us. We would love to hear from you!

The post Tracepoints: Debug with less clutter appeared first on Visual Studio Blog.

Watch the latest Visual Studio extensibility videos

$
0
0

We have been posting several short videos about Visual Studio extensibility to our YouTube channel in the past couple of months. We chose the topics for the first videos, but now it’s time for you to tell us what videos to record next.

The idea behind the short videos is to introduce extensibility concepts you may find useful. Perhaps you’ll even go ahead and implement some of them in your own extensions.

Often the concepts aren’t new but relatively unknown to Visual Studio extension authors. There’s always something to learn and we’ve found that short videos are a great way to show and tell.

If you haven’t yet, make sure to check out the first batch of extensibility related videos, which include:

Find these and more videos on the Visual Studio YouTube channel in the Tips & Tricks playlist.

What videos should we do next?

We’d love to make more videos about Visual Studio extensibility and could use your help to come up with the right topics. So, if you want us to make a video covering any specific topic, let us know in the comments below. Please remember that the topic should fit a 5-minute video format.

The post Watch the latest Visual Studio extensibility videos appeared first on Visual Studio Blog.

Azure IoT Tools September Update: Azure IoT Edge remote debug and more!

$
0
0

Welcome to the September update of Azure IoT Tools!

In this September release, you will see the improved remote debugging experience and Azure IoT Device Provisioning Service support in Visual Studio. Additionally, an iotedge-compose tool has been released for you to port compose-based apps to Azure IoT Edge.

Debug Azure IoT Edge C# remote Linux container

With the version 16.3 release of Visual Studio 2019, the remote debugging experience in Linux docker containers has been improved. The feature is intended to help generic container debugging. We can leverage it in Azure IoT Edge module scenario to help developers debug remote Azure IoT Edge C# Linux module container with ease.

For more details, you can check out this blog post to see how to use this feature in your Azure IoT Edge module debugging with the step-by-step instructions.

Support Azure IoT Hub Device Provisioning Service in Cloud Explorer

The Azure IoT Hub Device Provisioning Service is a helper service for Azure IoT Hub that enables zero-touch, just-in-time provisioning to the correct Azure IoT hub without requiring human intervention, enabling customers to provision millions of devices in a secure and scalable manner.

We’re pleased to announce that Visual Studio Cloud Explorer now supports the Azure IoT Hub Device Provisioning Service. You can now access your Azure IoT Hub Device Provisioning Services without leaving Visual Studio. You can check out this blog post for more details.

Convert Docker Compose projects to Azure IoT Edge solutions

If you are a container expert, you may want to port your existing Docker Compose application to Azure IoT Edge. We are glad to introduce iotedge-compose to help you convert your Docker Compose project to an Azure IoT Edge solution. iotedge-compose is a CLI tool written in Python. After you have installed Python, all you need to do is to install it through pip:

pip install iotedge-compose

Then, check out this blog post to see how to convert your Docker Compose file or project.

Try it out

Please don’t hesitate to give it a try! If you have any feedback, feel free to reach us at https://github.com/microsoft/vscode-azure-iot-tools/issues. We will continuously improve our IoT developer experience to empower every IoT developers on the planet to achieve more!

The post Azure IoT Tools September Update: Azure IoT Edge remote debug and more! appeared first on Visual Studio Blog.

Viewing all 1039 articles
Browse latest View live