Quantcast
Channel: Visual Studio Blog
Viewing all 1143 articles
Browse latest View live

Microsoft Q# Coding Contest – Winter 2019

$
0
0

Are you new to quantum computing and want to improve your skills? Have you done quantum programming before and looking for a new challenge? Microsoft’s Quantum team is excited to invite you to the second Microsoft Q# Coding Contest, organized in collaboration with Codeforces.com.

The contest will be held March 1 through March 4, 2019. It will offer the participants a selection of quantum programming problems of varying difficulty. In each problem, you’ll write Q# code to implement the described transformation on the qubits or to perform a more challenging task. The top 50 participants will win a Microsoft Quantum T-shirt.

This contest is the second one in the series started by the contest held in July 2018. The first contest offered problems on introductory topics in quantum computing: superposition, measurement, quantum oracles and simple algorithms. The second contest will take some of these topics to the next level and introduce some new ones.

For those eager to get a head start in the competition, the warmup round will be held February 22-25, 2019. It will feature a set of simpler problems and focus on getting the participants familiar with the contest environment, the submission system and the problem format. The warmup round is a great introduction, both for those new to Q# or those looking to refresh their skills.

Another great way to prepare for the contest is to work your way through the Quantum Katas. They offer problems on a variety of topics in quantum programming, many of them similar to those used in the first contest. Most importantly, the katas allow you to test and debug your solutions locally, giving you immediate feedback on your code.

Q# can be used with Visual Studio, Visual Studio Code or command line on Windows, macOS or Linux, providing an easy way to start with quantum programming. Any of these platforms can be used in the contest.

We hope to see you at the second global Microsoft Q# Coding Contest!

Mariia Mykhailova, Senior Software Engineer, Quantum
@tcnickolas
Mariia Mykhailova is a software engineer at the Quantum Architectures and Computation group at Microsoft. She focuses on developer outreach and education work for the Microsoft Quantum Development Kit. In her spare time she writes problems for programming competitions and creates puzzles.

Break When Value Changes: Data Breakpoints for .NET Core in Visual Studio 2019

$
0
0

“Why is this value changing unexpectedly and where or when is this occurring?!

This is a question many of us dread asking ourselves, knowing that we’ll have to do some tedious trial-and-error debugging  to locate the source of this issue.  For C++ developers, the exclusive solution to this problem has been the data breakpoint, a debugging tool allowing you to break when a specific object’s property changes.  Fortunately, data breakpoints are no longer a C++ exclusive because they are now available for .NET Core (3.0 or higher) in Visual Studio 2019 Preview 2!

Data breakpoints for managed code were a long-requested ask for many of you. They are a great alternative to simply placing a breakpoint on a property’s setter because a data breakpoint focuses on a specific object’s property even when it’s out of scope, whereas the former option may result in constant, irrelevant breaks if you have hundreds of objects calling that function.

How do I set a data breakpoint?

Setting a data breakpoint is as easy as right-clicking on the property you’re interested in watching inside the watch, autos, or locals window and selecting “Break when value changes” in the context menu.  All data breakpoints are displayed in the Breakpoints window. They are also represented by the standard, red breakpoint circle next to the specified property.

Setting a data breakpoint in the Locals window and viewing the breakpoint in the Breakpoints window

When can I use data breakpoints?

Now that you know how to set a data breakpoint, now what?  Here are some ways to take advantage of data breakpoints when debugging your .NET Core applications.

Let’s say that you want to figure out who is modifying a property in an object and for most of the time, this property change does not happen in the same file. By setting a data breakpoint on the property of interest and continuing, the data breakpoint will stop at the line after the property has been modified.

Break when _data value changes

This also works for objects. The data breakpoint will stop when the property referencing the object changes value, not when the contents of the object change.

Break when the property referencing an object changes

As illustrated in the GIF above, calling the toEdit._artist.ChangeName() function did not cause a breakpoint to hit since it was modifying a property (Name) inside the Song’s Artist property.  In contrast, the data breakpoint is hit when the _artist property is assigned a reference to a new object.

Data breakpoints are also useful when you want to know when something is added or removed from a collection. Setting a data breakpoint on the ‘Count’ field of classes from System.Collections.Generic makes it easy to detect when the collection has changed.

Break when an object is added or removed from a list

Are there opportunities for improving managed data breakpoints?

Since Visual Studio 2019 is still in preview, we highly encourage you to experiment, play around with, and provide feedback for this iteration of data breakpoints.  Here are some known scenarios where data breakpoints currently cannot be set that we are working on erasing and improving in future Visual Studio updates:

  • Properties that are not expandable in the tooltip, Locals, Autos, or Watch window
  • Static variables
  • Classes with the DebuggerTypeProxy Attribute
  • Fields inside of structs

Managed data breakpoints also exclude properties that call native code and properties that depend on too many fields.

Ready to try data breakpoints in your .NET Core applications?  Let us know in the comments!

For any issues or suggestions about this feature, please let us know via Help > Send Feedback > Report a Problem in the IDE or in the Developer Community.

Leslie Richardson, Program Manager, Visual Studio Debugging & Diagnostics
@lyrichardson01

Leslie is a Program Manager on the Visual Studio Debugging and Diagnostics team, focusing primarily on improving the overall debugging experience and feature set.

Get Started with Visual Studio for Mac

$
0
0

The first step is often the hardest. Do you find yourself with great ideas for the next awesome app, website, or game but you never get around to making that first leap into the unknown? Today, I’ll help you with that! In this blog post, I’m going to walk through how to get started with Visual Studio for Mac.

Visual Studio for Mac is a macOS-native .NET IDE that focuses on .NET Core, Xamarin, and Unity. It provides many of the same features as Visual Studio for Windows, such as a shared C#, XAML, and web editor. For more information on Visual Studio for Mac, see our documentation.

Installation

Before writing any code, you’ll first need to download Visual Studio for Mac from https://visualstudio.microsoft.com/vs/mac/. Once downloaded, click on the .dmg to launch it. Double-click the installer icon to mount it and start your install experience. Click Open if you’re prompted with security messages.

Once the installer launches, agree to the licensing terms by pressing Continue.

On the component selection screen, illustrated below, you can select the components you want to install. The component you need to install depends on the type of app that you want to create:

  • .NET Core: Allows you to create .NET Core apps and libraries, ASP.NET Core Web apps, and Azure Functions.
  • Android: Allows you to build native Xamarin or Xamarin.Forms apps targeting the Android platform. Selecting this will also install OpenJDK and the latest Android SDK, both of which are required for Android development.
  • iOS: Allows you to build native Xamarin or Xamarin.Forms apps targeting iOS.
  • macOS: Allows you to build native Xamarin.Mac apps.

Note that you’ll need to separately install Xcode if you want to develop for iOS or Mac. I recommend that you do this once Visual Studio for Mac has finished installing.

In this post, I want to create an Azure Function, so I want to select the .NET Core option. Once you click Install, the installation will take approximately 10 minutes depending on how many components you selected and your internet speed.

You’ll be prompted to log in with your Microsoft account if this is your first time launching Visual Studio for Mac. I’m going to log in now to activate my Enterprise license and make it easier to publish my Function to Azure.

if you don’t have an Azure or Microsoft account, you can get one totally free ! This also comes with over $200 free Azure credits to spend as you see fit.

Next, you can configure the IDE to work in a way that works for you through keyboard shortcuts. I’m going to stick with Visual Studio for Mac shortcuts, but the bindings can be changed later through the Preferences menu item.

Visual Studio for Mac will then greet you with the Start Window. From here you can open an existing project from your machine, create a new project, or browse through a list of recent projects. However, before you go any further, you might want to make some changes so the IDE really works for you. This can all be done through the Preferences menu item (Visual Studio > Preferences), similar to Tools > Options in Visual Studio. Personally, I like to change to the dark theme and change my font to something bigger. I also like to show invisible characters on selection.

Create a new project

Now that you have the IDE configured in a way that works for you, you’re ready to start writing code! In the Start Window select New and then select Cloud > General > Azure Functions. In this example, I’m just using the HTTP Trigger, but you can use any template. For more information on other templates, see the Azure Functions documentation on docs.microsoft.com.

Name your project, press Next, set the Authorization level to Anonymous and click Next. If you want to use Git for version control, you can set that while creating the project. Click Create to open your project in Visual Studio for Mac:

Your solution and project will be loaded and should look like the image above. The most important parts of the IDE are described below:

  1. Solution Pad ­– The solution pad organizes all the projects, files, and folders in a solution. You can right-click on any item here to see its context actions allowing you to do things such as add references and publish to azure.
  2. Code Editor – This is where you will likely spend most of your time. This editor shares the same code components with Visual Studio, but with a native macOS UI. For more information in the editor, see the Source Editor docs.
  3. Debug/Run Controls ­– You can use the dropdown menus to set your run configuration, including the device or platform that you want to deploy to. When you’re ready to go, press the triangular “Start” button.
  4. Search Box – Search within your project, commands, or for a NuGet package from here.
  5. Workspace – The workspace consists of a main document area (an editor, designer surface, or options file) surrounded by pads containing useful information for the task at hand.
  6. Additional Pads – Visual Studio for Mac Pads are analogous to Panes in Visual Studio – they’re used to show additional information, tools, and navigation aids. Depending on the type of task, different pads will be displayed automatically. For more information on using pads in your workspace, refer to the Customizing the IDE documentation.

You’re now ready to start writing some code and creating something great!

Going further

Happy Developing! If you have any feedback or suggestions, please leave them in the comments below. You can also reach out to us on Twitter at @VisualStudioMac. For any issues that you run into when using Visual Studio for Mac, please Report a Problem.

The post Get Started with Visual Studio for Mac appeared first on Visual Studio Blog.

All Things Developer Tools at Microsoft Ignite

$
0
0

There is a lot of developer goodness happening at Ignite this week. Visual Studio Online is available as a public preview for developers to try cloud hosted development environments with your tool of choice. Visual Studio 2019 version 16.4 Preview 3 and Visual Studio 2019 for Mac version 8.3 Preview 2 just released with tons of new productivity features. There are also a bunch of great sessions that deep dive into all this and much more.

Welcome to the family Visual Studio Online

Today Visual Studio Online moved to a public preview; providing managed, on-demand development environments for long-term projects, to quickly prototype a new feature, or for quick tasks like reviewing pull requests. You can work with environments from any device using Visual Studio Code, Visual Studio 2019 or the built-in browser-based editor. The features for connecting to a cloud environment from the Visual Studio 2019 IDE are available in private preview. Read more about the exciting announcement in the Visual Studio Online blog post.

The Visual Studio 2019 IDE can also create and connect to Visual Studio Online environments and take advantage of all the benefits of a cloud powered development environment to build any application.

  • Get up and running quickly by letting Visual Studio Online install runtimes, SDKs and dev tools
  • Create environments quickly to isolate your work across different projects
  • Spin up extra capacity with a premium environment to gives you the memory and compute to run your toughest workloads
  • Give your teammates a ready to go environment for rich code reviews without tying up your dev box or asking anyone to setup their own environment

We’re eager to invite developers that love working in a full IDE to join our private preview.

Visual Studio 2019 version 16.4 Preview 3 is here

Preview 3 of Visual Studio 2019 version 16.4 is now available. If you aren’t already running the Preview builds you can download and try out the latest side by side with our current version of Visual Studio. Of course, if you already have a Preview installed just click the notification or go to Help menu and click Check for updates.

Speedy code navigation

In 16.3 we introduced file search for all languages and semantic code search for C# and VB into the new Search bar. In 16.4 we have rewritten the Find in files tool window to address suggestions and feedback on the most popular search control in the IDE. Performance has been significantly improved and reliability issues that previously led to frustrating hangs have been fixed. We cleaned up the UI and added a few improvements like adding exclusions to a search query.

IntelliSense without Using Directives

IntelliSense is indispensable for browsing and finding members of a type but if you’re missing a Using directive you might not find what you need. In 16.4 IntelliSense shows members and types for any assemblies referenced from your project and automatically adds the Using directive to keep your code neat and tidy.

IntelliCode helps with argument completion

IntelliCode saves you time by putting what you’re most likely to use at the top of your IntelliSense completion list. IntelliCode can also provide suggestion for arguments as you type, bringing the most likely arguments to the top of your completion list. Set your cursor on a method and type CTRL+SPACE to give it a try.

Automatically re-train and acquire IntelliCode team models

Since we released the ability to create team models trained on your own code last year, we’ve heard feedback that sharing team models through links can be cumbersome and it’s difficult to remember to retrain your models. With our new Azure DevOps task and automatic acquisition of models, you can set up your pipeline to take care of team model updates and automatically share the model with others working in the same repository.

Refactoring with help from IntelliCode

ItelliCode goes beyond smarter IntelliSense. IntelliCode learns from your edits and provides refactoring suggestions for repeated edits as you type. IntelliCode understands the syntactic structure of your changes so suggestions include locations with similar structure but different variables and formatting. These suggestions appear with your other refactoring quick fixes and are available from the CTRL + ”.” shortcut. Remember to enable this early IntelliCode feature from Tools Options.

More real estate for code and easier navigation with vertical document tabs

We’re excited to include with 16.4 the most popular customer suggestion, vertical document tabs. Real estate for code is a premium in many environments. Vertical document tabs give vertical space to your source code while better utilizing your horizontal screen space. Stretch to bring long file names into view, sort tabs alphabetically and use tab groups to get more code on the screen.

XAML code editor pop up, merge resource dictionaries and more

In this release there are multiple new features for desktop developers building WPF or UWP applications. One such feature is the ability to open the XAML code editor window separately from the XAML designer using our new “pop up” button next to XAML tab:

Other features include the ability to easily merge an existing resource dictionary into your application with our new solution explorer command “Merge Resource Dictionary Into Active Window”, the ability to filter Live Visual Tree to “Just My XAML” and more. For a complete list of what’s new for desktop developers see the release notes.

Audio calls and app sharing for desktop apps in Live Share

Real time collaboration with Live Share opens the door for pair programming, rich code reviews, and help from experts even when they are remote. A quick call can often provide more context behind the code. Now the Live share tool window lets you start an audio call with other collaborators in a Live Share session.

You can now App Share a desktop and web apps in a Live Share conversation. Start a Live Share conversation with another developer or tester and start debugging. Guests will see the same running app you see on your local machine. They can even interact with the application and trigger breakpoints in the debugger.

Pin Properties in the Debugger

Identifying objects by their properties while debugging has just become easier and more discoverable with the new Pinnable Properties tool. In short, hover over a property you want to display in the debugger window of the Watch, Autos, and Locals windows, click that pin icon, and immediately see the information you are looking for at the top of your display!

Visual Studio 2019 for Mac version 8.4 Preview 2

Today we’re releasing Visual Studio 2019 for Mac version 8.4 Preview 2. This is an exciting release because it adds significant accessibility improvements to the overall IDE as well as support for .NET Core 3.1 Preview and full Blazor (server-side) support. With the latest version you can create, build, debug and run Blazor projects and then deploy your Blazor app directly to Azure without ever leaving the IDE. Learn more about this release on the latest Visual Studio for Mac blog post.

Ignite sessions to check out this week

The above is just a glimpse of the developer topics that will be covered at Microsoft Ignite this week. Make sure you head on over to https://www.microsoft.com/ignite to catch the following sessions and more. Times listed are in Eastern Time (ET).

Monday, Nov 4
2:00 PM – 2:45 PM
Empowering every developer to innovate with Microsoft Azure
Monday, Nov 4

3:15 PM – 4:00 PM

Increase your .NET productivity with Visual Studio and Visual Studio for Mac
Tuesday, Nov 5

9:00 AM – 10:15 AM

Keynote: App development for everyone with Hanselman and friends
Tuesday, Nov 5

10:30 AM – 11:15 AM

Visual Studio Online: A look at the future of developer productivity and collaboration
Tuesday, Nov 5

11:45 AM – 12:30 PM

Visual Studio Code tips and tricks
Tuesday, Nov 5

1:00 PM – 1:45 PM

The now and then of cloud native application in the enterprise using containers
Tuesday, Nov 5

2:15 PM – 3:00 PM

Ship it! Build for any platform with Azure Pipelines, and make shipping fun and stress-free
Tuesday, Nov 5

2:15 PM – 3:00 PM

Building serverless web applications in Azure
Tuesday, Nov 5

3:30 PM – 4:15 PM

Enterprise-grade Node.js on Azure
Tuesday, Nov 5

4:30 PM – 5:15 PM

Being a social developer
Wednesday, Nov 6

9:15 AM – 10:00 AM

Building enterprise capable serverless applications
Wednesday, Nov 6

10:30 AM – 11:15 AM

Create amazing web apps with ASP.NET Core
Wednesday, Nov 6

12:30 PM – 1:45 PM

.NET platform overview and roadmap
Wednesday, Nov 6

12:45 PM – 1:30 PM

Windows App Development Roadmap: Making Sense of WinUI, UWP, Win32, .NET
Wednesday, Nov 6

2:15 PM – 3:00 PM

Community powered continuous integration with GitHub Actions
Thursday, Nov 7

9:15 AM – 10:00 AM

Applying best practices to Azure Kubernetes Service (AKS)
Thursday, Nov 7

10:30 AM – 11:15 AM

Debugging tips and tricks in Visual Studio 2019
Thursday, Nov 7

12:45 PM – 1:30 PM

Moving the web forward: Microsoft Edge for web developers
Thursday, Nov 7

1:00 PM – 1:45 PM

Cloud native applications with .NET Core and Azure Kubernetes Service
Thursday, Nov 7

2:15 PM – 3:00 PM

Build Python apps in Azure faster with Visual Studio Code
Thursday, Nov 7

3:30 PM – 4:15 PM

Mobile app development reimagined with Xamarin and .NET
Friday, Nov 8

9:15 AM – 10:00 AM

.NET Microservices with Azure Service Fabric: A real-world perspective
Friday, Nov 8

10:30 AM – 11:15 AM

Linux based web app development made easy on App Service
Friday, Nov 8

11:45 AM – 12:30 PM

Build a highly secure and scalable mobile backend using App Center

If you’re at the event in Orlando this week, be sure to stop by the Development & Architecture Center to chat with our team and catch one of the many theater and lightning talks. There are also hands-on workshops throughout the week for you to experience these technologies first-hand.

Thanks,
Anthony & the entire Visual Studio team

The post All Things Developer Tools at Microsoft Ignite appeared first on Visual Studio Blog.

Visual Studio 2019 for Mac version 8.4 Preview 2, now available

$
0
0

Today we released the latest preview, Preview 2, of Visual Studio 2019 for Mac version 8.4. This preview comes with several exciting new features which we would love for you to try out. To get the preview:

Updates in this preview

The focus of this preview is around accessibility improvements and .NET Core and ASP.NET Core. Let’s dive into the details of the updates.

Accessibility Enhancements

Ensuring Visual Studio for Mac can be used by all users is important to us and we realize the need to support various assistive technologies to make this happen. Visual Studio for Mac previously had some built-in accessibility features compatible with VoiceOver and other assistive technologies. With the release of Preview 2, we’ve increased the surface area of the IDE accessible by assistive services to include several commonly used parts that were previously inaccessible.

Those using assistive technologies will find general improvements over the entire IDE that include focus order, contrast, reduction of keyboard traps, more accurate VoiceOver navigation and reading, and more. We’ve also rewritten the UI for the debugger to make it accessible with VoiceOver.

Improving accessibility of Visual Studio for Mac is a top priority for our team. While we have made rapid progress in this area recently, we are looking for some real-world users to assist in guiding the work. Try this preview and reach out to us to let us know what scenarios are working well and what and are not. If you would like to directly engage with us on our accessibility work, please email Dominic Nahous, the lead PM for the initiative at dominicn@microsoft.com. Now let’s move on to discuss the .NET Core specific updates.

.NET Core 3.1 Preview support

In this release, we have added support for the latest preview of the .NET Core 3.1 SDK Preview 2. When you install the preview version of the IDE, that version of the .NET Core SDK will be installed automatically. We have full support for .NET Core 3.1 Preview 2 projects including: creating new projects, editing, building, debugging and other features.

ASP.NET Core Blazor Server Support

In this release we are adding support for developing and publishing ASP.NET Core Blazor Server applications. If you haven’t heard of Blazor, it’s a framework for building interactive client-side web UI with .NET. Here are some of the advantages of using Blazor.

  • Write code in C# instead of JavaScript.
  • Leverage the existing .NET ecosystem of .NET libraries.
  • Share app logic across server and client.
  • Benefit from .NET’s performance, reliability, and security.
  • Stay productive with Visual Studio 2019 on PC, Linux, and macOS.
  • Build on a common set of languages, frameworks, and tools that are stable, feature-rich, and easy to use.

In Visual Studio 2019 for Mac 8.4 Preview 2 you can create new Blazor server projects as well as get the standard support you would expect such as building, running and debugging Blazor projects. As you can see, the Blazor Server App project template is now available in the New Project dialog.

One of the areas where the team has focused on this release was adding support for editing .razor files. These are the files that you’ll be using when creating Blazor applications. If you’ve edited these files in the Windows version of Visual Studio 2019, then you’ll be very comfortable in Visual Studio 2019 for Mac. Both the Windows and Mac version of the IDE share the same editor for .razor files. You’ll see full colorization and completion support for your .razor files including completions for Razor components declared in the project.

vsmac blazor editor

You can also publish Blazor applications directly to Azure App Service. And if you don’t have an Azure account to run your Blazor app on Azure, you can always sign up for a free one here that also comes 12 months of free popular services, $200 free Azure credits, and over 25 always free services.

Updates to the editing experience

vsmac blazor editor

As mentioned before, the editor in Visual Studio for Mac now supports full colorization, IntelliSense and completion for .razor files. In addition to adding Blazor support, we’ve been hard at work adding features that have been top requests from our community. The biggest change that you will notice is that we brought back preview boxes for any code changes that may occur from a code fix or analysis suggestion. In the screenshot below, we see a preview of the changes that will occur if I use the “Make Static” codefix provided by Roslyn.

vsmac csharp editor

To celebrate the new preview view, we are also providing several new code fixes like the aforementioned “Make Static” as well as the ability to add null checks to each parameter of a method.

Finally, you may have noticed in the screenshots that the coloring looks more like what you may be used to on Visual Studio for PC. We’ve been working to standardize the Visual Studio theme, and we will be making more progress in this area in the releases ahead, so stay tuned!

Pack support for .NET Core library projects

When creating .NET Core class libraries, you may be interested in distributing your library to a larger audience. To do this you need to create a NuGet package from your class library. In Visual Studio for Mac we made it very easy to create a NuGet package from a .NET Core library project. You right-click your project and then select the Pack menu option as per the example below:

After invoking the Pack menu option for a library project, you will find the NuGet package (.nupkg file) in the output folder. This experience is consistent with that in Visual Studio on PC.

Download and try today

If you haven’t already make sure to download Visual Studio 2019 for Mac and then switch to the preview channel. With this release we are hoping that you’ll be able to easily get started with .NET Core 3.1 as well as Blazor Server applications. We encourage you to leave your comments either below in this post or by submitting issues to the developer community via Report a Problem.

If you’re interested in upcoming releaseses, you’ll be happy to know that we have recently updated the Visual Studio 2019 for Mac Roadmap so please take a look and let us know your thoughts.

Make sure to follow us on Twitter at @VisualStudioMac and reach out to the team. Customer feedback is important to us and we would love to hear your thoughts. Alternatively, you can head over to Visual Studio Developer Community to track your issues, suggest a feature, ask questions, and find answers from others. We use your feedback to continue to improve Visual Studio for Mac 2019, so thank you again on behalf of our entire team.

The post Visual Studio 2019 for Mac version 8.4 Preview 2, now available appeared first on Visual Studio Blog.

Announcing Visual Studio Online Public Preview

$
0
0

TL;DR

Available beginning at Microsoft’s Ignite conference as a public preview, Visual Studio Online provides managed, on-demand development environments that can be used for long-term projects, to quickly prototype a new feature, or for short-term tasks like reviewing pull requests. You can work with environments from anywhere using either Visual Studio Code, Visual Studio IDE (in private preview), or the included browser-based editor. 😁

Visual Studio Online - Develop anywhere

Empowering Modern Development

Software developers, and the software development process, live on the bleeding edge of technological trends. We talk to developers every day, and we’ve heard that expectations for innovation continue to increase across all industries and sectors. We’ve also noted resounding feedback that the confluence of current trends demands a new breed of development tools and capabilities.

These trends include:

  • More and more teams are distributed remotely, or leveraging freelancers, which magnify the pain of onboarding new team members without the benefit of a local IT presence.
  • Open source and inner source are making collaboration more important than ever. As a result, developers are working across boundaries in many codebases, often at the same time.
  • Increasing computational and data workloads (e.g. Machine Learning, Artificial Intelligence, Big Data), powered by cloud computing, are naturally shifting development activities beyond the “standard issue development laptop”.
  • The explosion of cloud native development and microservices have enabled developers to use multiple languages and stacks in a single system to take advantage of each technology’s particular strengths.
  • Developers facing expectations for decreased time-to-market are seeking techniques and technologies to help them collaborate more quickly and increase productivity.

As a result of your feedback, these trends, and what we have learned with Visual Studio Code Remote Development, we have been working hard on a new service called Visual Studio Online. Visual Studio Online philosophically (and technically) extends Visual Studio Code Remote Development to provide managed development environments that can be created on-demand and accessed from anywhere. These environments can be used for long-term projects, to quickly prototype a new feature, or for short-term tasks like reviewing pull requests. Additionally, since many companies already have existing infrastructure for development, we made sure that Visual Studio Online can take advantage of those as well. You can connect to your environments from anywhere using either Visual Studio Code, Visual Studio IDE (see below), or the included browser-based editor.

We’re excited to get your feedback as we launch Visual Studio Online into public preview. Read on to learn more about the service and the scenarios it enables, or dive right in with one of our quickstarts.

Rapid Onboarding

Development environments are the cornerstone on which Visual Studio Online is based. They’re where all of the compute associated with software development happens: compiling, debugging, restoring, etc. Whatever your project or task, you can spin up a Visual Studio Online environment from your development tool of choice or our web portal, and the service will automatically configure everything you need: the source code, runtime, compiler, debugger, editor, personal dotfile configurations, relevant editor extensions and more.

Environments are fast to create and disposable, allowing new team members to quickly onboard to a project, or for you to experiment with a new stack, language, or codebase, without worrying about it affecting your local configuration. And since environments share definitions, they are created in a repeatable manner – all but eliminating configuration discrepancies between team members that often lead to “works on my machine” type bugs.

Additionally, environments are completely configurable so they can be precisely tuned as required by your project. Start simple by specifying a few extensions that you want installed, or take full control over the environment by defining your own Dockerfile.

Cloud Powered

Visual Studio Online’s development environments are Azure-hosted and come with all the benefits of the cloud:

  • They scale to meet your needs:
    • Create as many as you want (up to subscription limits) for all your various projects and tasks and throw them away when you’re done.
    • Need a little extra horsepower? Create a premium environment to get all the CPU and RAM you’d need to tackle even the most demanding projects.
  • They have predictable pricing and you only pay for what you use – down to the second. If you create an environment and delete it after 6 minutes and 45 seconds, you’ll only pay for 6 minutes and 45 seconds. Environments also auto-suspend to eliminate accidental runoff costs.
  • Moving your development workload to the cloud boosts your overall computing power so your personal machine can edit media assets, email, chat, stream music, or do anything else, more.

Already have investments in on-premise development environments, or not quite yet ready to move a workload to the cloud? Visual Studio Online also allows you to register and connect your own self-hosted environments, so you can use that already-perfectly-tuned environment and experience some of the benefits of Visual Studio Online, for free!

Your Favorite Tools

Visual Studio Online supports three editors: Visual Studio Code, our no-install browser-based editor, and Visual Studio IDE (see below). This allows you to use the tool you’re most comfortable with, in any language or framework.

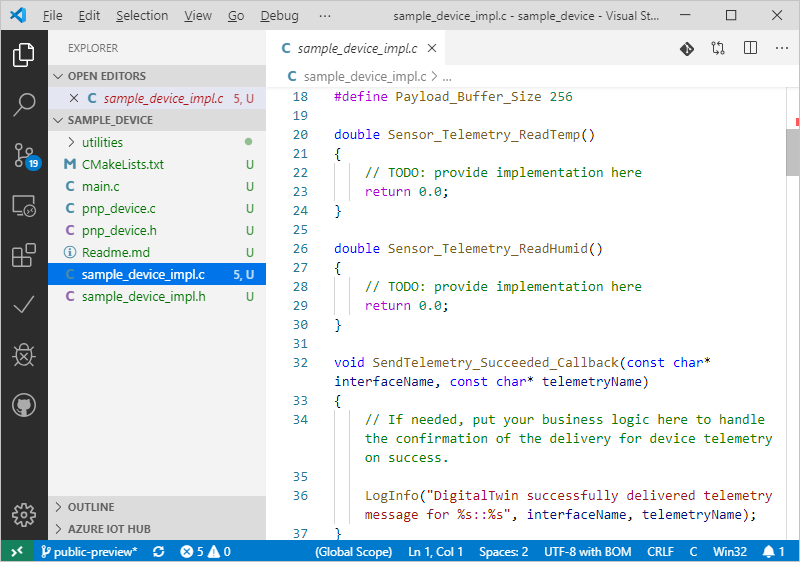
By installing the Visual Studio Online extension you can use Visual Studio Code, the streamlined code editor with support for operations like debugging, task running, and version control. It aims to provide just the tools a developer needs for a quick code-build-debug cycle. It’s free, built on open source and now enhanced with cloud powered development environments.

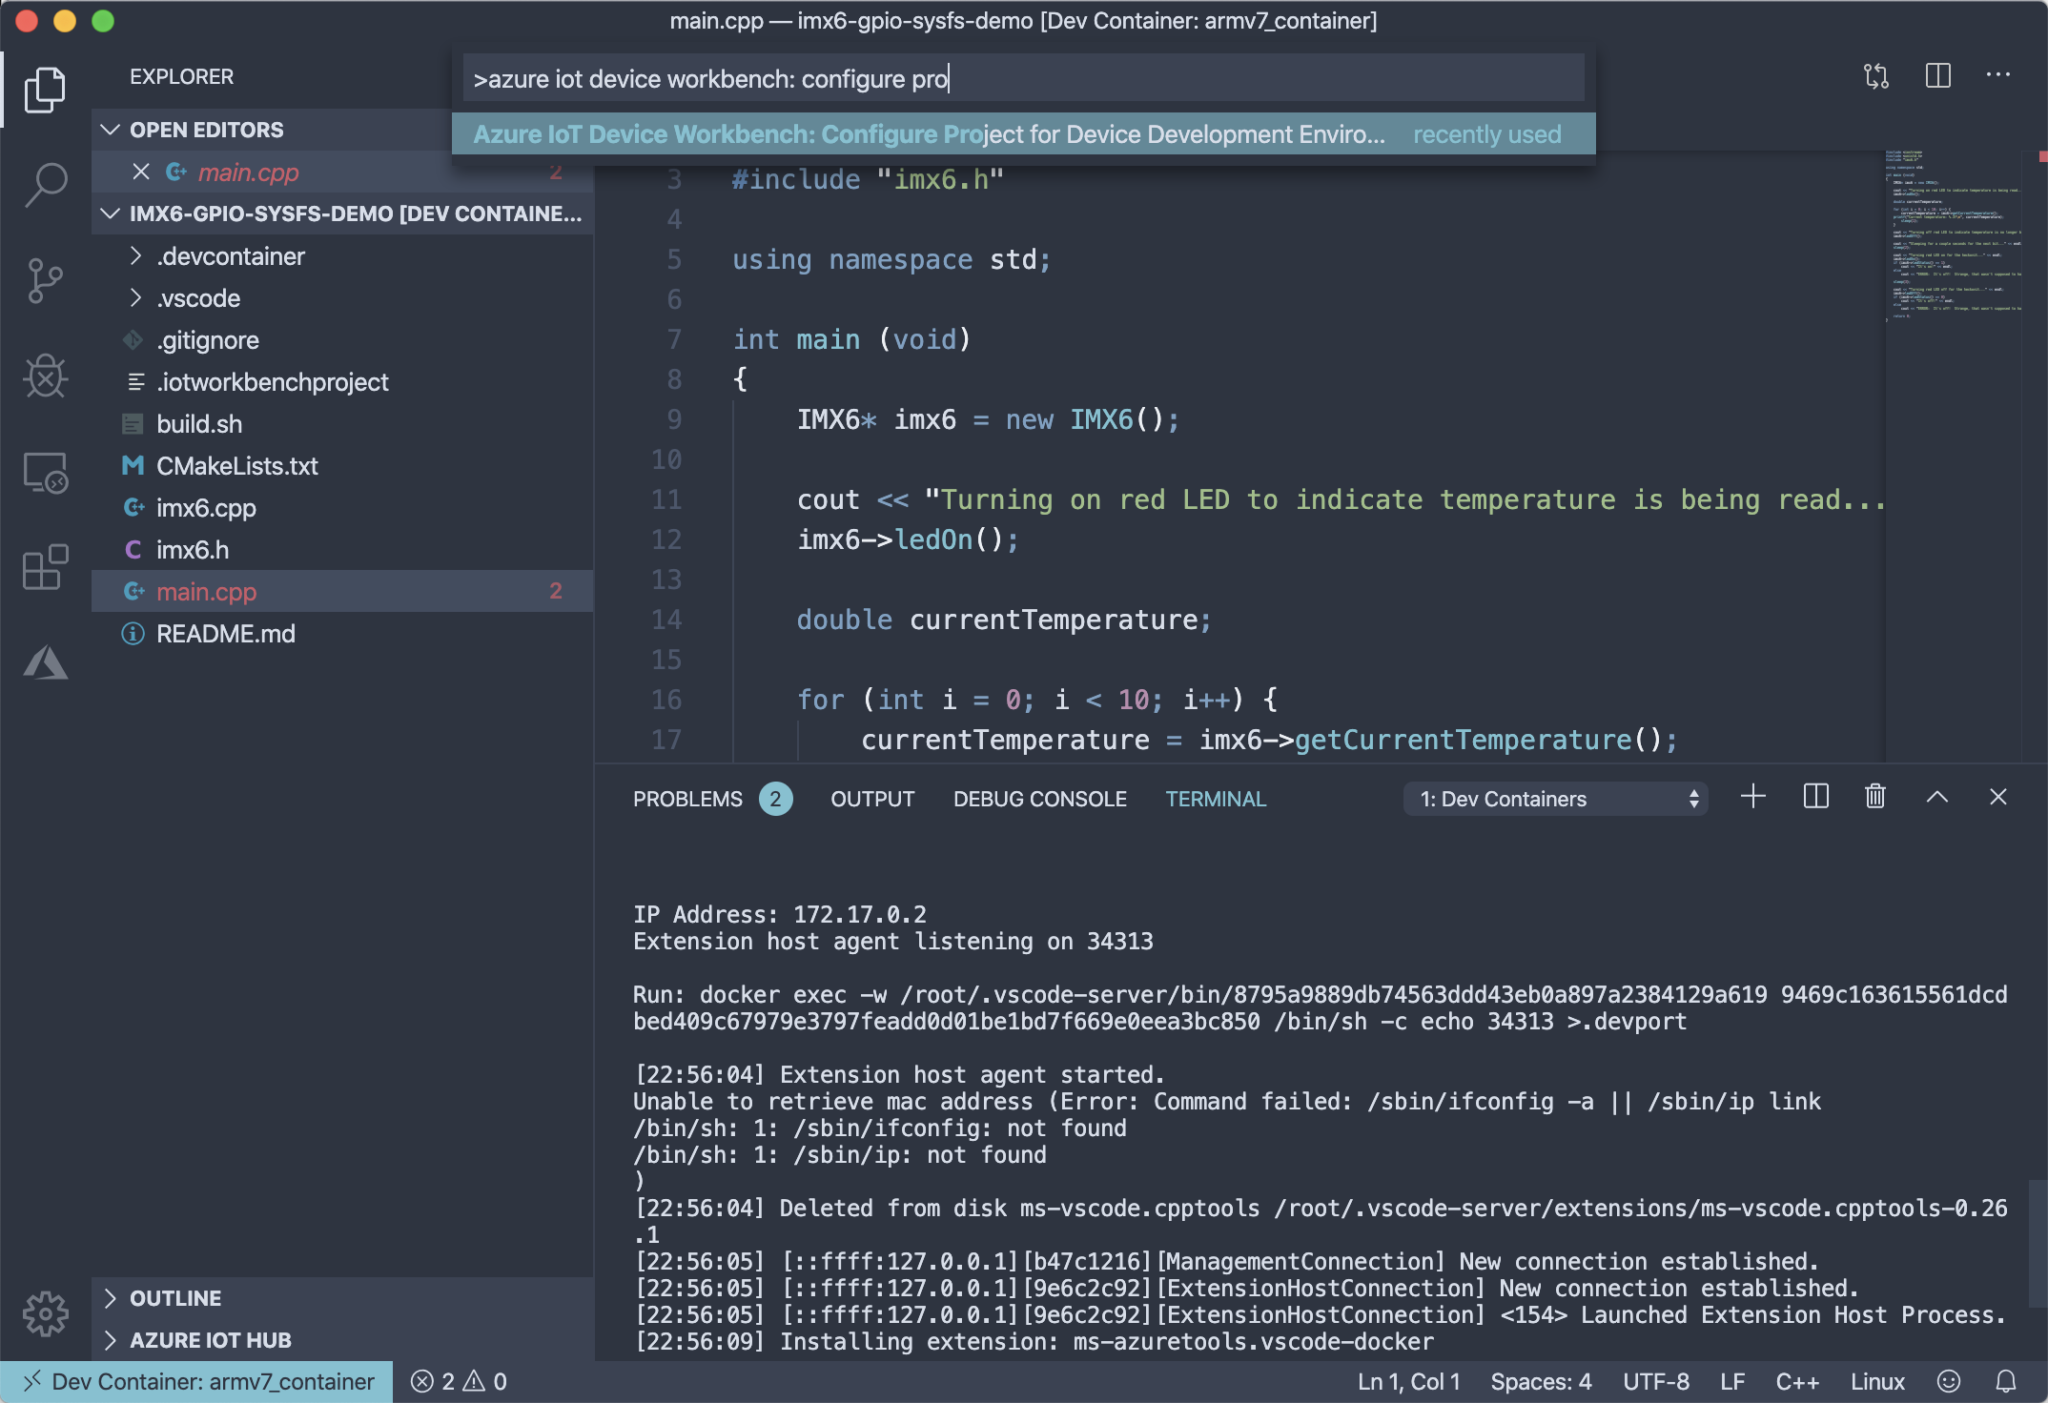
Visual Studio Online’s browser-based editor adds the ability to connect and code from literally anywhere, and its fully powered with Visual Studio Code under the hood. Gone are the days of lugging around heavy dev machines on the road or to a coffee shop. Instead, travel light knowing you’ve got the full computing power of Azure, just a new browser tab away.

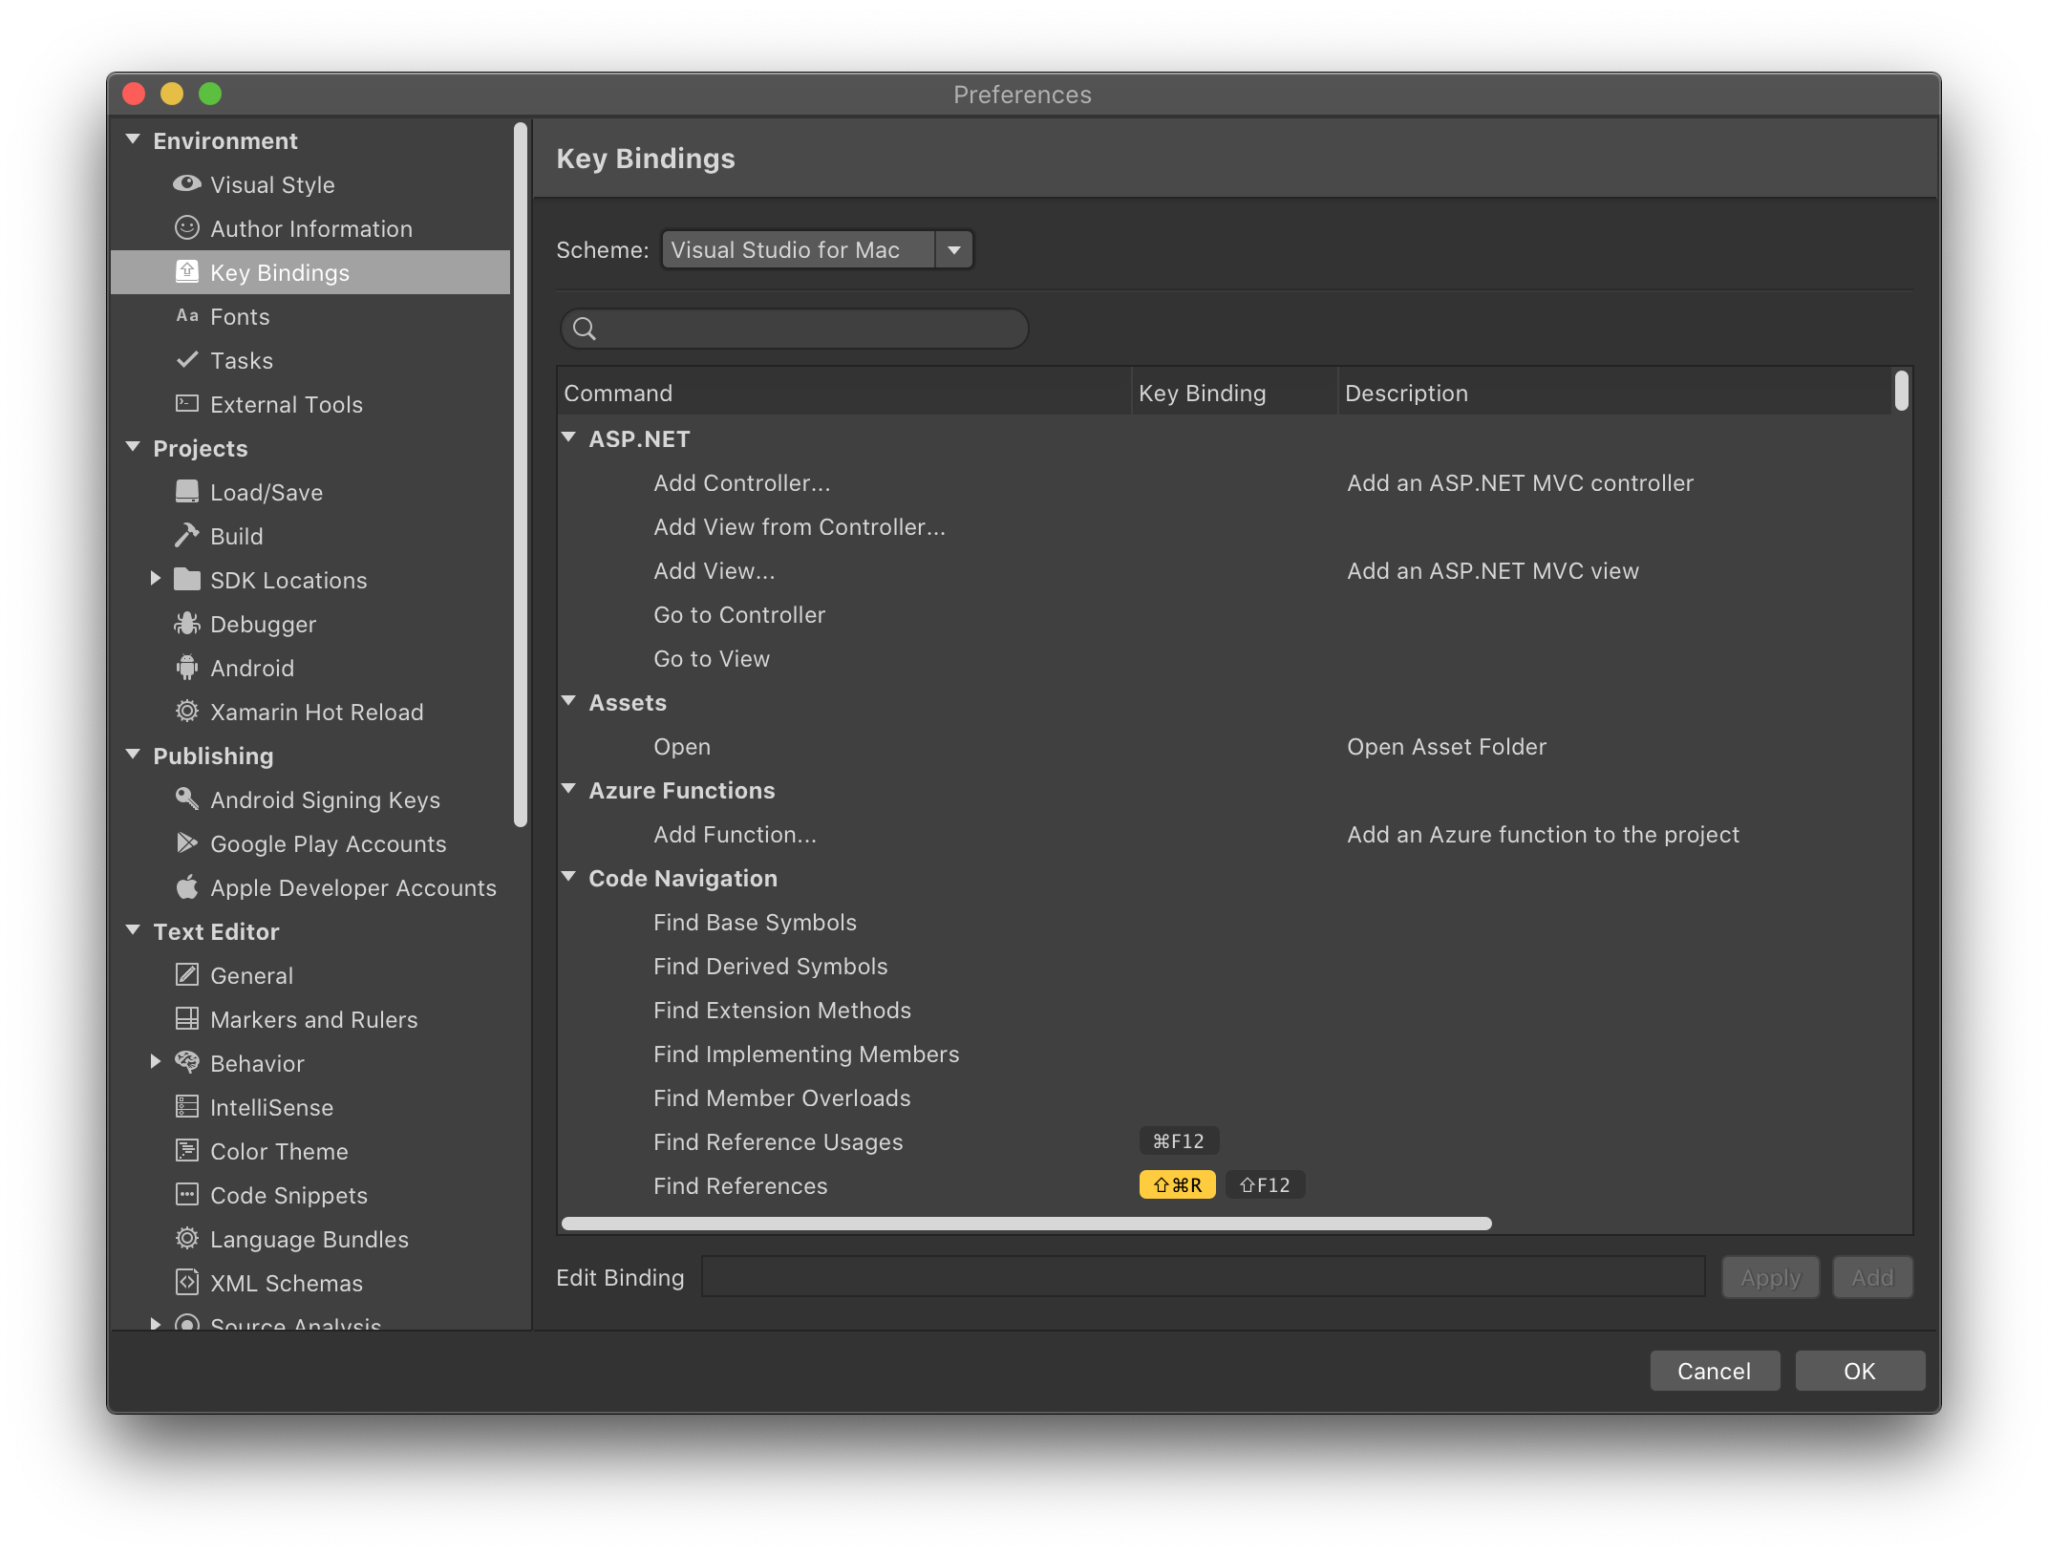
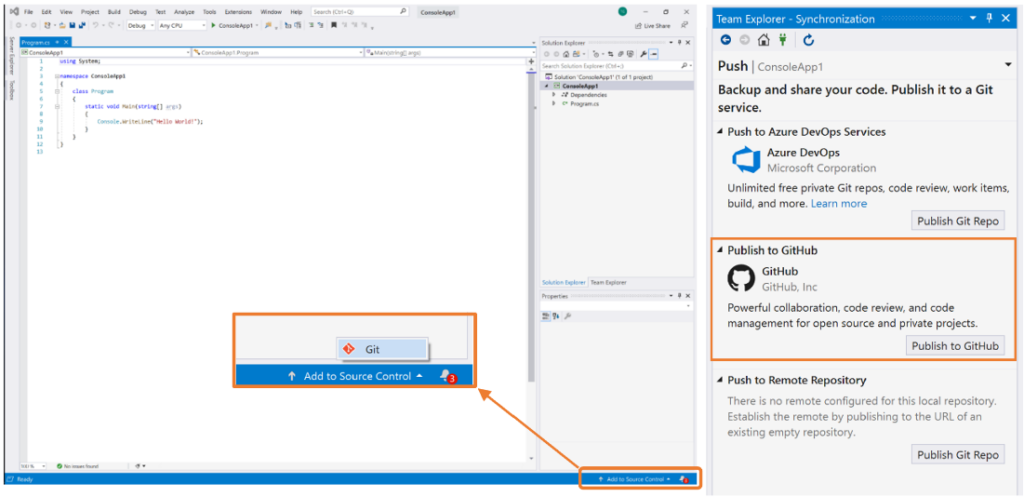
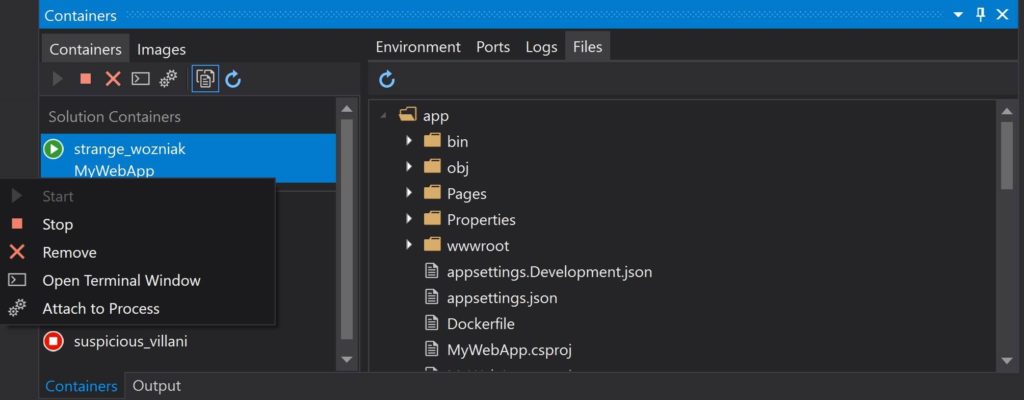
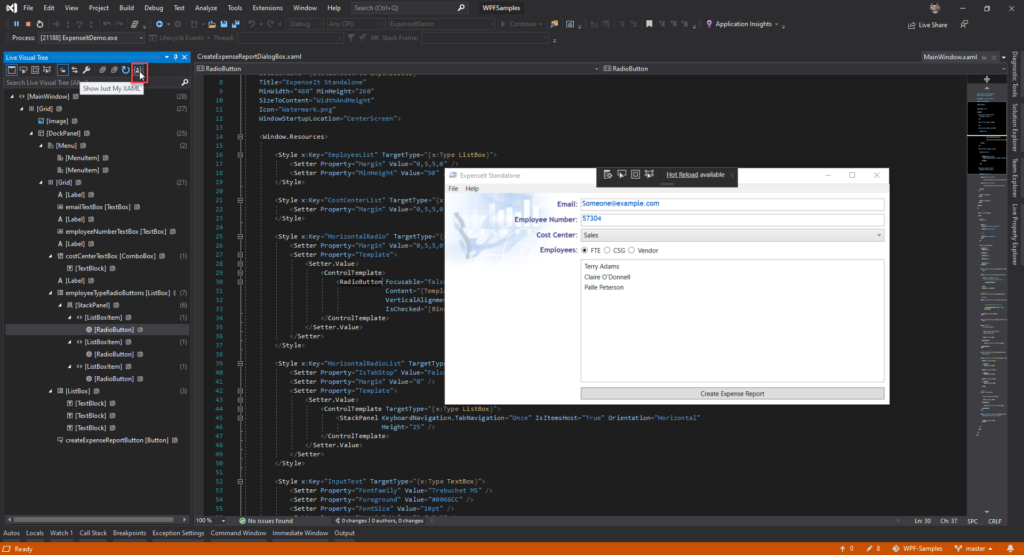
We’re also proud to announce that Visual Studio IDE’s support for Visual Studio Online is in private preview at Ignite. Developers will now have the option to use a full-fledged IDE with the entire toolset, from initial design to final deployment, enhanced with the benefits of Visual Studio Online. Along with this private preview, we’re also introducing the capability to create Windows based Visual Studio Online environments, expanding the set of workloads the service will support. Sign up now to be added to the wait list.

Along the way we’ve also learned that developers not only want to use the right tool for the job, but they are also highly opinionated about their development environment, and commonly spend countless hours personalizing their editor and terminal. To address this, Visual Studio Online’s flexible personalization features make any environment you connect to feel familiar, as if you’ve never left home, whichever editor you decide to use.

Even better, you can freely extend these capabilities since Visual Studio Online has support for the rich ecosystem of extensions in the Visual Studio Marketplace.

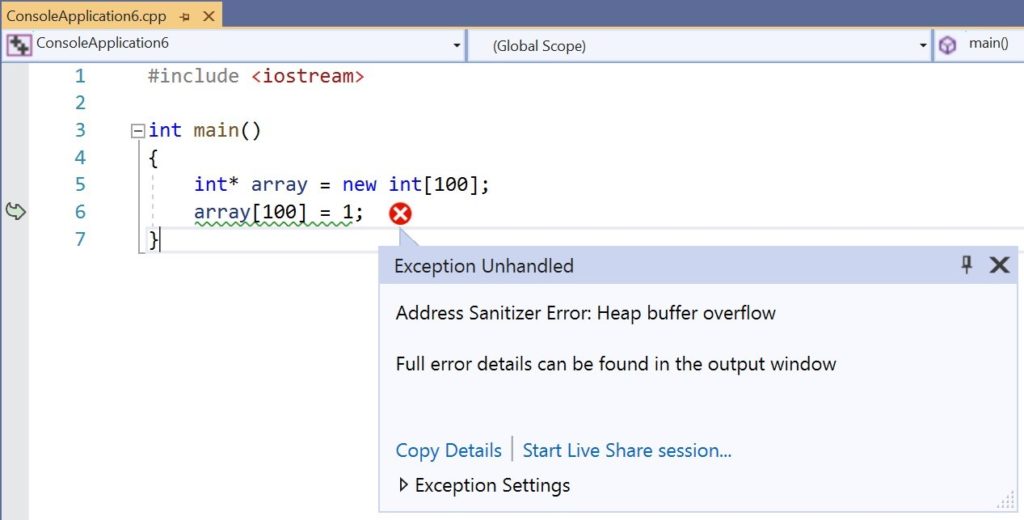
Effortless Remote Debugging

Once connected to your Visual Studio Online environment, simply run your web app or API as you usually would, and we automatically forward it, so that it’s accessible to you – and only you. It behaves just like your traditional, local dev workflow.

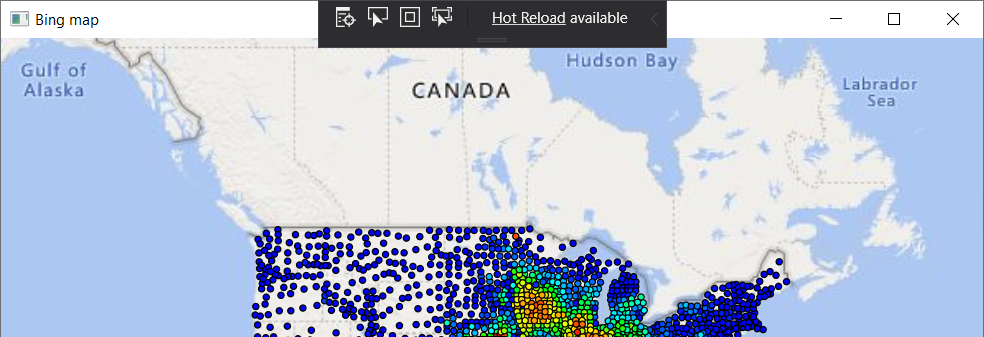
In addition, we’ll soon be introducing support for app casting, that will allow you to remotely interact with and share a running GUI application.

Built in Collaboration

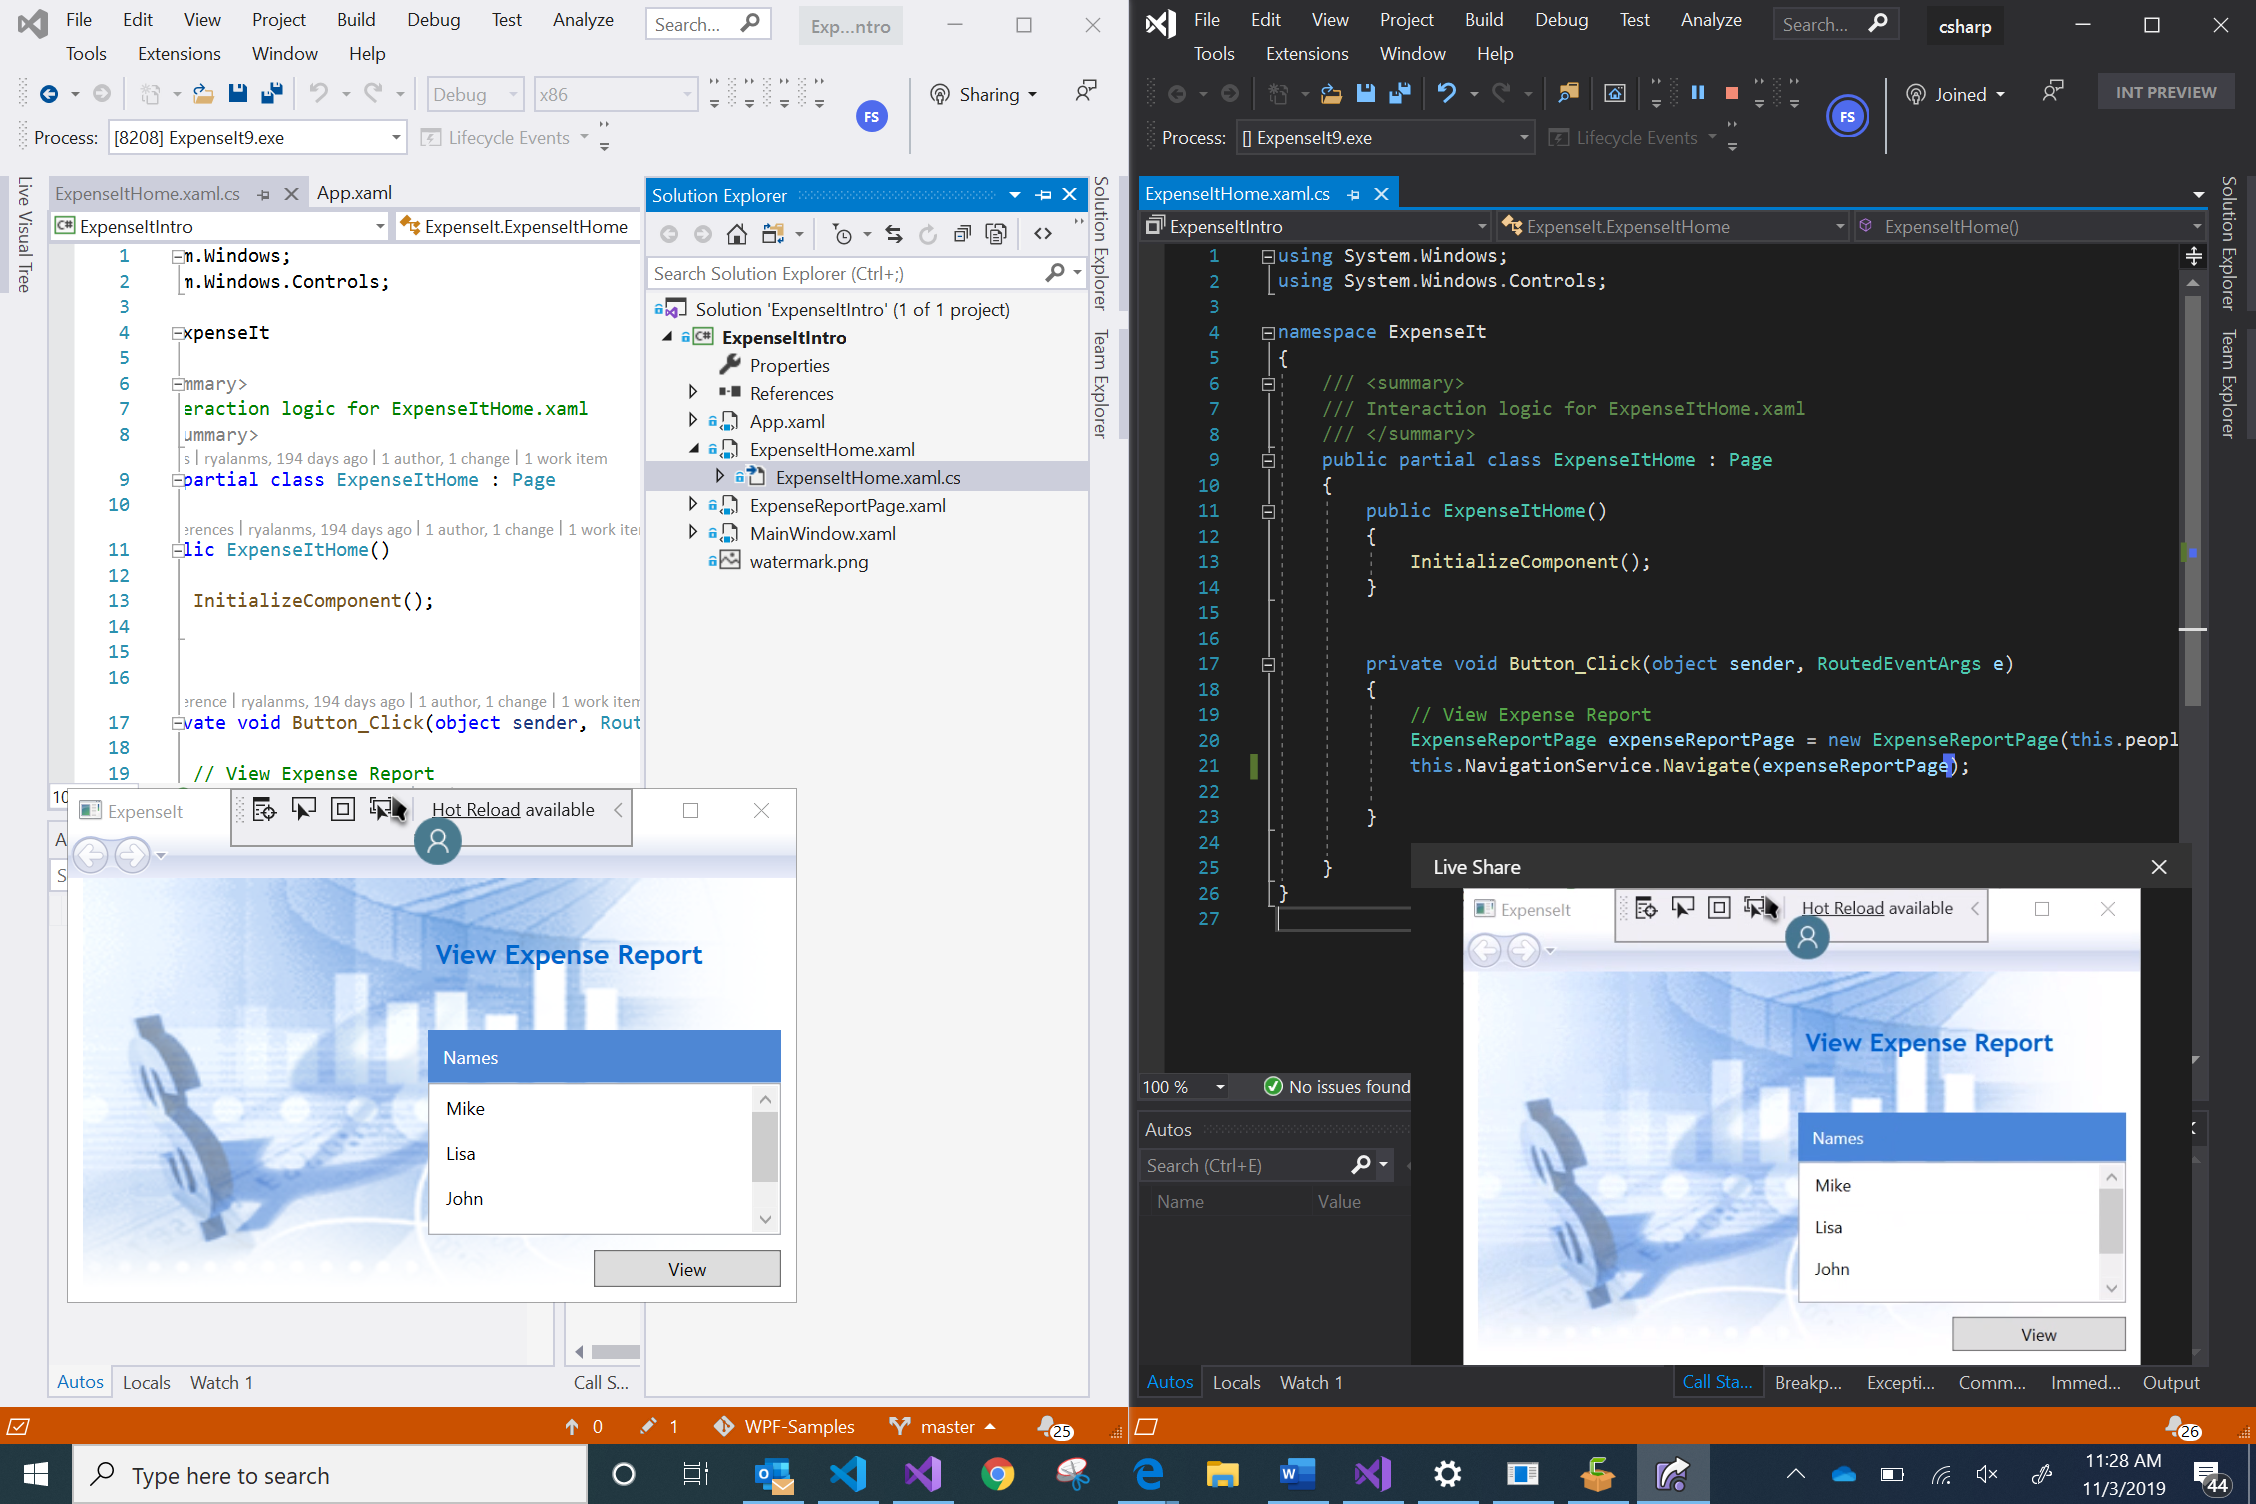
On top of all of this, Visual Studio Online’s environments come with built in collaboration tools like IntelliCode and Live Share. IntelliCode helps enhance individual productivity by instilling AI-assisted intelligence into the editor. It does this by making things like auto-completion smarter with “implicit collaboration” based on an understanding of how APIs are used across thousands of open-source GitHub repositories. Live Share directly facilitates real-time collaboration by enabling developers to edit and debug together, even if they aren’t all Visual Studio Online users, or prefer a different editor.

And More to Come!

Visual Studio Online is in public preview at Ignite. That means that now is a great time to try it out and share your feedback. We’re eagerly looking forward to working with the community to understand the best ways to make Visual Studio Online even better.

I want to thank all the users who have submitted feedback already – you’re the ones who have made the service as great as it is today – and I can’t wait to hear from so many more of you.

Next Steps

If you’d like to learn more, head over to our product page or “What is Visual Studio Online?” documentation.

To try the service, follow along with our Visual Studio Code or browser-based experience quickstarts.

As mentioned above, if you’re interested in Visual Studio IDE support and Windows based environments, sign up for our private preview and we’ll do our best to grant you access as soon as possible.

Finally, feel free to report any feedback you have in our issue tracker on GitHub.

We can’t wait to hear what you think!

Thanks,
Nik Molnar & the entire Visual Studio Online team 👋

The post Announcing Visual Studio Online Public Preview appeared first on Visual Studio Blog.

Re-imagining developer productivity with AI-assisted tools

$
0
0

TL;DR:

Harnessing the wisdom of the community, Visual Studio IntelliCode is revolutionizing developer productivity. We started with AI-assisted IntelliSense and are now expanding the application of artificial intelligence to significantly accelerate learning, radically improve development agility, and increase code quality by means of two exciting new capabilities: whole line completions and refactoring.

Technology is evolving so fast that every developer is constantly learning, whether you’re adopting a new programming language, API, or architecture (e.g. microservices). Amidst this rate of technological change, existing tools are no longer sufficient for achieving agility as development teams are trying to accelerate their time-to-market  and increase code quality. As a result, development tools need to radically evolve to satisfy the productivity demands of modern teams.

At Microsoft Ignite, we showed a vision of how AI can be applied to developer tools. After talking with thousands of developers over the last couple years, we found that the most highly effective assistance can only come from one source: the collective knowledge of the open source, GitHub community. This is exactly what IntelliCode provides.

AI-assisted suggestions + whole-line code completions

IntelliCode now provides whole-line code completion suggestions mined from the collective intelligence of your trusted developer knowledge bases. This is like having an AI-developer pair-programming with you, providing meaningful, suggestions and whole-line code completions without disrupting your flow. To generate accurate suggestions and provide completion assistance as you code, IntelliCode extends the GPT-2 transformer language model for our machine-learning models to learn about programming languages and coding patterns.

The GPT model architecture, originally developed by OpenAI, has demonstrated strong natural language understanding, including the ability to generate conditional synthetic text examples without needing domain-specific training datasets. For our initial language-specific base models, we adopted an unsupervised learning approach that learns from over 3000 top GitHub repositories. Our base model extracts statistical coding patterns and learns the intricacies of programming languages from GitHub repos to assist developers in their coding. Based on code context, as you type, IntelliCode uses that semantic information and sourced patterns to predict the most likely completion in-line with your code.

Suggested whole-line completions in Visual Studio Code editor
AI-assisted whole-line completions in Visual Studio Code editor


IntelliCode has now extended our machine-learning model training capabilities beyond the initial base model to enable your  teams to train their own team completions. Team completions are useful if your development team uses internal utility and base class libraries or domain-specific libraries that aren’t commonly used in open-source GitHub repositories. If you’re using code that isn’t in that set of GitHub repos, those recommendations aren’t as useful to you. By training on your team’s code, IntelliCode learns patterns from your code to make more accurate suggestions. This enables your  team to accelerate  learning and take advantage of the knowledge of your team and broader community.

AI-assisted Refactoring

IntelliCode watches code changes as they occur in the IDE and locally synthesizes, on demand, edit scripts from any set of repetitive pattern changes. It uses these edit scripts to produce suggestions, enabling you to apply repetitive changes quickly or create a pull request to apply the suggestion(s) for team review without distracting your current work. IntelliCode refactorings take the time-intensity and error-proneness out of routine tasks, such as introducing a new helper function. To do so, IntelliCode uses an AI technology called program synthesis, and more specifically, programming-by-examples (PBE).

Quick action menu in Visual Studio IDE showing available actions for IntelliCode refactorings. Available actions are take the repeated edit, ignore the suggestion, or submit a new PR with the suggestion.
IntelliCode refactorings based on repetitive code edits in Visual Studio IDE


PBE technology has been developed at Microsoft by the PROSE team and has been applied to various products to enable users to streamline repetitive tasks after providing a few examples. You’ve seen PBE in action in Flash Fill in Excel and webpage table extraction in PowerBI. IntelliCode advances the state-of-the-art in PBE by allowing patterns to be learned from noisy traces as opposed to explicitly provided examples, without any additional steps on your part. You can read more about this in this earlier post. We’re planning to broaden this capability to more languages, as well as enabling your team easily benefit from the patterns that you find.


Display of IntelliCode refactoring suggestions in Visual Studio IDE
IntelliCode refactorings in Visual Studio IDE


What about privacy and code security?

We know that your code is a vital business asset, so we are committed to a simple principle across our developer tools and services: your code remains your code, your models are your models, and remain your models unless you choose to share them with others. You control when to utilize AI-assistance and who has access to your data.

As examples of this principle in action, when we train a team model for IntelliCode completions on your codebase, we don’t share that model with anyone but you unless you choose to share it, and we locally extract only those elements of the code that are needed to create a model for recommending completion values. We also make it easy for you to ensure that access to your model follows the same security access rules as your code repo when shared, with no extra configuration. You can read more about this in the documentation.

Our PROSE-based models work entirely locally, so your code never leaves your machine.

When it is necessary for us to use a service-based model to deliver a feature, we ensure all appropriate security is in place to secure any information (including code) that is transmitted over the network – the documentation has more information.

What’s next? 

Our ambition is to contribute to developer-assistance across the whole developer lifecycle. We’re particularly interested in making learning and retrieving typical code snippets whilst learning a new API or re-learning an old one, a lot easier. We continue to listen hard to our developer community about where we can best contribute to assist with your daily development challenges.

Get the latest Visual Studio 2019 previews; there, you can try much of this out for C# already. Watch the Visual Studio blog for more announcements as we make progress.

You can also sign up for regular updates and invitations to future private previews.

Try it now

You can try out IntelliCode team models and refactorings in Visual Studio for C# by downloading our latest Visual Studio Preview.

We also support a variety of languages in Visual Studio and Visual Studio Code:

  • Visual Studio: C#, C++, JS/TS, XAML
  • Visual Studio Code: Python, JS/TS, Java, SQL


Happy coding!

The post Re-imagining developer productivity with AI-assisted tools appeared first on Visual Studio Blog.

Join the Visual Studio for Mac ASP.NET Core Challenge

$
0
0

In September, we shared Visual Studio 2019 for Mac v8.3 with you – this was our biggest release yet for .NET developers working on a Mac. Today, we’d like to invite you to take part in a new community challenge in which you can interact directly with our team to improve Visual Studio for Mac, explore some great looking ASP.NET Core samples, and earn prizes!

Taking the ASP.NET Core Challenge

Are you ready to jump in? There are just three simple steps to enter:

Download the Visual Studio for Mac 8.3 release or update to it from within the IDE using the Stable channel in the Updater.

Now, create or modify an ASP.NET Core site with a web UI using Visual Studio for Mac; you can use the samples from the control libraries mentioned below, or build your own. We only ask that you try our new HTML/CSHTML, CSS, or JavaScript/TypeScript editors.

Finally, send us a Tweet of the UI that you build, using the @VisualStudioMac handle on Twitter along with the hashtags #vs4macChallenge #sweepstakes. Include a screen shot of your running app and an example of the source code you used, running in Visual Studio for Mac! We’ll reply with a survey you can take to share your experience. The survey will also allow you to share your contact information with us if you’d like to be entered for a chance to get swag.

Swag!

To thank you for your time submitting and filling out our follow-up survey, we have some fun swag giveaways for you! Each submission is entered into a random drawing for 1 of:

  • 3 grand prizes: A product license from GrapeCity, Syncfusion, or Progress. Or,
  • 100 first prizes: A $15.00 voucher for the .NET Foundation Store, to purchase a shirt or stickers.

To be eligible, you’ll need to share your email address with us in the survey mentioned earlier.

For more details on eligibility, please read the Official Rules for this sweepstakes.

ASP.NET Core Samples to help you out

To give you some interesting new samples to explore in this challenge, 3 great ASP.NET Core control libraries for you to check out. Each of them has been a great help pulling together some Mac-based instructions to help you get started:

If you have other favorite libraries you prefer to use, that’s great! Just let us know what you used as part of your contest submission.

Go forth and code!

This challenge starts today, November 5th and goes until November 19th, and we’ll share out the end results by November 22nd.  As you work with Visual Studio for Mac and build out your app, feel free chat with us on Twitter via @VisualStudioMac. Now, go have fun and code!

The post Join the Visual Studio for Mac ASP.NET Core Challenge appeared first on Visual Studio Blog.


Re-imagining collaboration for Visual Studio with Live Share app casting and contacts

$
0
0

The power of Visual Studio for desktop and mobile development is unmatched in the industry, and we wanted to ensure that the best in class also had the best collaboration story. Live Share is reimagining this collaboration story by reducing the barriers to collaboration, increasing the fidelity of the collaboration experience while building desktop apps, and enhancing this workflow.

One of the barriers to collaboration for Visual Studio desktop, mobile and console application development was the inability to effectively share your progress while working on an app with your peer. With the VS16.4 release you will now be able to share your application from within a collaboration session.  With the cumbersome process of creating and sharing links to start a collaboration session, collaboration did not feel as intuitive. To solve this problem and make collaboration as low-touch as possible, we now have contacts in Live Share that are auto-populated with your recent and contextual collaborators, who can be directly invited to a collaboration session. With all of these new changes, we have also enhanced the interactiveness of a Live Share session with in-built audio calling.


Application casting with contacts can enhance your collaboration workflow, whether it is for your scheduled pairing session, or for debugging a bug with someone with expertise on your team. You don’t need to lose the comfort of your IDE to make progress on blockers in your code. We know that good code takes multiple eyes on it, and with direct invitations to your contacts you easily collaborate with your team.

Getting started with app casting and contacts

To use Live Share with app casting and add contacts, make sure you have Visual Studio 16.4 or higher. Once you have this version of Visual Studio, your Live Share extension will come with app casting when you choose to be an insider. To become an Insider, go to: Tools > Options > Live Share > General > Features and set it to Insiders, as seen in the screenshot below.

With Insiders enabled, you will receive all the coolest new features of Live Share. Live Share is now enabled with not just app casting and contacts, but also VS Live Share Audio. You can jump on a quick call from within a Live Share session without context switching to any other application, thereby extending  your coding productivity time.

Directly invite your peers

Contacts will appear automatically once you are an Insider under your contacts pane and are under two categories,

  1. Recent Contacts

These are developers you have previously collaborated with using Live Share. In practice, most developers frequently collaborate with the same people, and therefore, the recent list enables a more repeatable means of working with your team/classroom/etc.

  1. Suggested Contacts

These are developers that have contributed to your currently open project within the last 30 days. In practice, these are the folks you are likely to want to collaborate with, and therefore, we suggest them in order to make it easier to get started.

All your contacts can be invited directly to a Live Share session from within your editor. They’ll get a toast notification that gives them the option to join the session or not. This removes the need to exchange session URLs entirely.

Share your status

With contacts, comes the ability to signal your availability for collaboration. Live Share contacts allow you to set your status to Available, Do Not Disturb, Away or Offline. The idea is to provide you the ability to choose the level of interaction you would like to have with your peers without the need to context switch. Its not only easy to directly invite contacts now, but also to let them know that you are not available to collaborate. You can read up more on how contacts and statuses work here.

Just hit F5

To share the desktop app, you are working on with your peer from within a Live Share session, just start a debug session with F5 . The screenshot below shows an Expense Reporting WPF application being worked on during a Live Share session.

When the host of the session presses f5 to start a debugging session, the app auto launches, and the guest can view the application on their side as well. All participants in the session can interact with the application (and  ) and modify it together without committing any changes .

App casting currently works for UWP, WinForms, Win32 C++ apps, C++ and CMake console apps with many more to come!

Call from within your IDE

Now you have app casting working and can share your entire working picture with your peer, but sometimes you really need to talk over the fine details. For this, Live Share has in-built audio calling from within your session! The ability to do an audio call from within your IDE allows you to be productive without context switching out of your focus mode while developing.

Let us know what you think!

With app casting your debugging sessions can be a powerful place to do real-time collaboration and make progress on hard bugs. With direct invitations and status sharing with contacts you now have a new ease to your collaboration process.

We love hearing from you, so tell us what you think about this new feature, and how else you plan to use it alongside audio calling, by leaving feedback here.

You can follow Live Share’s newest offerings through our GitHub release notes, and file for feature requests to let us know what you would like to see us offer next.

The post Re-imagining collaboration for Visual Studio with Live Share app casting and contacts appeared first on Visual Studio Blog.

Visual Studio for Mac: Take Control of Your IDE with Keybindings

$
0
0

The great debates in computing all have one common theme. Whether it is tabs vs. spaces or Vi vs. Emacs, the thread linking all these debates together is keyboard efficiency. The truth is, we spend tons of hours working in an application, and keyboard shortcuts become automatic to us, the same muscle memory that great pianists or sports players have. If you suddenly give a virtuoso pianist a piano where the keys are half as wide and the sharp/flat keys are below as opposed to above the natural keys, they will struggle to make even the most basic melodies while they learn the new arrangement. Likewise, when it comes to keyboard shortcuts in your favorite IDE, any change can be disorienting quickly. Luckily, Visual Studio for Mac offers a ton of customizations to key bindings that will allow you get configure your key combinations to your liking.

First Run

New users to Visual Studio for Mac will notice right away that the IDE offers support for many different key mappings. The first time Visual Studio for Mac is launched on a computer, you will receive a prompt directing you to pick your favorite key mapping.

Here, you can select from four different key mappings to help you be as productive as possible from the first line of code you write. But what if you want even more customizations? Well, Visual Studio for Mac has you covered there as well!

More Customizing

While setting a default keymap is certainly handy, it doesn’t solve all circumstances. There may be custom mappings that you’ve used in other IDEs, or specific commands that are outside the bounds of the array of preconfigured options. With the Key Bindings selection window, you can map every possible command within the IDE to a specific key. To see the Key Binding options, select Visual Studio > Preferences > Environment > Key Bindings.

There are several features that I want to point out in this window, and I will take you through them one by one. The most immediate option you see is that there is a dropdown available for various “Schemes” which map to the options that new users see when they first install the IDE. Here you can select from many different pre-packaged key bindings, such as Visual Studio, VS Code and Xcode.

But what if you want even more control? What if you really, really want “Find Derived Symbols” to be mapped to Control-Option-D? Setting custom keybindings is super easy in Visual Studio for Mac. To get started, you can either scroll through the list of available commands, or search for the command in the search box. The list of available commands is organized by type of command and can be collapsed for easier navigation. Once you find the command you would like to map, you can select it and then type the desired key binding in “Edit Binding” followed by clicking “Apply”. In the below GIF, I set the binding for “New Breakpoint” to Control-Shift-B.


You can also edit an existing breakpoint in a very similar manner. In the below GIF, you can see how to edit the “New File” command to map to Control-Shift-N from the default Command-N. You’ll notice that all I need to do is type in the command I prefer and click apply. If you want to add multiple bindings, simply click “Add” instead of “Apply”.


Finally, with so many commands to remember, it can sometimes be hard to keep track and avoid duplicates. To ensure that each key binding is unique, Visual Studio for Mac checks against all configured commands and warns you of a duplicate if one is detected. It will also check for command duplication, so you can either replace the original or your newly created binding. The GIF below shows what happens when mapping the “New Breakpoint” command to the “Command-C” keyboard binding which conflicts with “Copy”.


Now that you know how to edit the key mappings in any way you see fit, you can fully customize the IDE and get to writing code the way you love! If you want to see more key binding information, please check out our Toolbox video on the subject on Channel 9

If you have any feedback or suggestions, please leave them in the comments below. You can also reach out to us on Twitter at @VisualStudioMac. For any issues that you run into when using Visual Studio for Mac, please Report a Problem.

The post Visual Studio for Mac: Take Control of Your IDE with Keybindings appeared first on Visual Studio Blog.

AI-assisted IntelliSense for your team’s codebase

$
0
0

Visual Studio IntelliCode uses machine learning to offer useful, contextually-rich code completion suggestions as you type, allowing you to learn APIs more quickly and code faster. Although IntelliCode’s base model was trained on over 3000 top open source C# GitHub repositories, it does not include all the custom types in your code base. To produce useful, high-fidelity, contextually-rich suggestions, the model needs to be tailored to unique types or domain-specific APIs that aren’t used in open source code. To make IntelliSense recommendations based on the wisdom of your team’s codebase, the model needs to train with your team’s code.

Earlier this year, we extended our ML model training capabilities beyond our initial Github trained base model to enable you to personalize your IntelliCode completion suggestions by creating team models trained on your own code.

Team completions shared and automated easily!

Your team completions become part of your normal developer workflow just by associating a model to your repo. Anyone with access to your repository, automatically gets team completions – no extra configuration steps are required!

Once you’re ready, you can keep your completions up-to-date with our new Azure DevOps task that can retrain your models on CI. When a change is made to your codebase, the model is automatically trained and shared with your team.

2 steps to team completions


Setting up IntelliCode team completions with IntelliCode training service in Azure Dev Ops

Set up and share

Repository-associated models are automatically shared with others working in the same codebase as long as users have enabled automatic acquisition of team models in Visual Studio. To enable automatic acquisition by going to Tools > Options > IntelliCode > Acquire team models for completion. Access to the repository is access to the model. Be sure you are at least Visual Studio 16.4 preview 4 to enable these preview features.

When training, we collect some information about the checked-out commit where the training took place. Anyone who requests that model must have the same commit in their repository and be able to produce the same information that was collected during training to receive the team model.

Please note that you’ll need to be on at least Visual Studio 2019 version 16.4 preview 5 to try out these updates to the IntelliCode team completions experience.

See more details on how to acquire and share team completions here.

Automate

Once you’re happy with the team completions on you repo, you should set up to automatically retrain as part of your continuous integration (CI) pipeline in Azure Pipelines. When code changes are pushed to your repository, the build task runs and your team completions are retrained and made available to the repo. In parallel, Visual Studio checks for updates to team completions  and will update automatically .

Install the Visual Studio IntelliCode Team Model Training task from Visual Studio Marketplace to your Azure DevOps organization or Azure DevOps Server (formerly TFS).

See more details about how to configure and automate the build task here.

Tell us what you think!

We’d love to understand your current experience with IntelliCode and where we can improve. Try out sharing team completions and automating updates today and tell us what you think of the new experience. Please note that you’ll need to be on at least Visual Studio 2019 version 16.4 preview 5 to try out these updates to the IntelliCode team completions experience.

Please raise issues and comments Visual Studio “report a problem”.

We’re interested to hear feedback about the recommendations themselves, the performance of the feature, or any capabilities you might be missing.

To keep up with the future of AI-assisted development, sign up for our Insiders newsletter.

The post AI-assisted IntelliSense for your team’s codebase appeared first on Visual Studio Blog.

Azure IoT Tools November Update: standalone simulator for Azure IoT Edge development and more!

$
0
0

Welcome to the November update of Azure IoT Tools!

In this November release, you will see the new standalone simulator for Azure IoT Edge development, the support of Vcpkg for IoT Plug and Play development and more new features.

Deploy Event Grid module on Azure IoT Edge

Event Grid on IoT Edge brings the power and flexibility of Azure Event Grid to the edge for all pub/sub and event driven scenarios. There are several ways to deploy Event Grid module in VS Code.

1. When adding a new module to your new or existing IoT Edge solution, now there is a new option to choose Azure Event Grid

2. When adding a new module to your new or existing IoT Edge solution, select Module from Azure Marketplace, you can see Azure Event Grid on IoT Edge.

3. In VS Code command palette, type and select Azure IoT Edge: Show Sample Gallery. You can open a new sample with pub/sub Functions along with Event Grid module.

Click here to learn more about Azure Event Grid on IoT Edge.

Standalone simulator for Azure IoT Edge development

For Azure IoT Edge developers, we have Azure IoT EdgeHub Dev Tool to provide a local development experience with a simulator for creating, developing, testing, running, and debugging Azure IoT Edge modules and solutions. However, the Azure IoT EdgeHub Dev Tool runs on top of Python environment. Not every Azure IoT Edge developers especially those using Windows as development environment has Python and Pip installed. Therefore, we have shipped a standalone simulator for Azure IoT EdgeHub Dev Tool so that developers who use Windows as development environment no longer need to setup Python environment. The standalone simulator has already been integrated in the latest release of Azure IoT Tools for Visual Studio Code. When you use Azure IoT Tools for Visual Studio Code,

Support Vcpkg for IoT Plug and Play development

Vcpkg is a cross-platform library manager that helps you manage C and C++ libraries on Windows, Linux and MacOS. With the support of Vcpkg for IoT Plug and Play development, developers could easily leverage the Vcpkg to manage the Azure IoT C device SDK as well as other C/C++ dependencies.

Previously, source code is the only way to include the Azure IoT C device SDK. Now, developers could generate device code stub of IoT Plug and Play via both Vcpkg and source code.

For more details with the step-by-step instructions, you can check out this tutorial to see how to create an IoT Plug and Play device via Vcpkg.

Configure an Embedded Linux C project using containerized device toolchain

We release the preview experience of containerized toolchain months ago aiming to simplify the toolchain acquisition efforts for device developers working on C / C++ project for Embedded Linux that requires the cross-compiling toolchain, device SDK and dependent libraries set up properly. Instead of doing this on local machine, which could lead to a messed-up environment, we provided a couple of common container images for devices with various architectures (e.g. ARMv7, ARM64 and x86).

And now you can further use this feature by configuring an existing C / C++ project you have to be able to compile in the container, and then deploy to the target device you use. If you want to further customize the container, we provided with extra device libraries and packages that are required for your device.

Check the tutorials to learn how to use it for your existing code base.

Try it out

Please don’t hesitate to give it a try and if you’re new to Azure, remember you can sign up for a free Azure account to get $200 free Azure credit and access to over 25 always free services (including Azure IoT Hub)! If you have any feedback, feel free to reach us at https://github.com/microsoft/vscode-azure-iot-tools/issues. We will continuously improve our IoT developer experience to empower every IoT developers on the planet to achieve more!

The post Azure IoT Tools November Update: standalone simulator for Azure IoT Edge development and more! appeared first on Visual Studio Blog.

‘Tis the Season for the Visual Studio 2019 v16.4 Release

$
0
0
Giving Tree
Giving Tree on Microsoft Campus

Here in Redmond, glimpses of holiday cheer are filling our campus buildings as the season shifts to twinkling lights and frosty temperatures The Visual Studio team is seizing this time as an opportunity to celebrate the comradery needed to respond to developer needs and suggestions. Equally, we are reflecting over what we can improve in the upcoming year as well as plan product features to deliver.

What is more notable is the generosity flowing within our various Microsoft locations. One primary means of meeting community needs is through our annual Giving Tree program. There are festive trees in every building decorated with ornaments of wish list items for a variety of charitable organizations.  Teams and individuals are able to pick favorite tag item and gift them. To increase the impact, Microsoft matches the dollar amount for an additional gift to the charity! With giving in mind, we are anticipating this release of Visual Studio 2019 version 16.4 will fill your wish list item of a more stable, productive development environment. Since we started working on this release in August, we have implemented hundreds Developer Community suggestions and bug fixes.  Let’s take a look at what you’ll find in this release.


GitHub publishing directly from Team Explorer

We know GitHub integration brings value to your developer experience.  Therefore, we are excited to announce a previous extension making its way into the Visual Studio 2019 product. The ability to have GitHub publishing done directly from Team Explorer has been a favorite because of its seamless communication with GitHub repositories.  For this reason, local repositories can be synchronized by clicking the Publish to GitHub button on the Team Explorer Synchronization page.  This functionality has been a high priority of our teams, so we are eager to hear what you think.

Publish to GitHub from Visual Studio 2019 v16.4


XAML Hot Reload for Xamarin.Forms

Next, XAML Hot Reload for Xamarin.Forms enables you to make changes to your XAML UI and see them reflected live without requiring another build and deploy. This feature significantly speeds up development to make it easier to build, experiment, and iterate on your user interface. Best of all is how much time you can save since you no longer have to rebuild your application for every tweak.

Because your application is compiled using XAML Hot Reload, it works with all libraries and third-party controls, and is available for iOS and Android. Consequently, it works on all valid deployment targets including simulators, emulators, and physical devices. In the event that you are more curious, check out the XAML Hot Reload for Xamarin.Forms documentation detailed by the team members themselves.


Container Tools window

Another addition that started out as an extension in the Visual Studio Marketplace is the Container Tools window. This new tool window enables you to list, inspect, stop, start, and remove Docker images and containers on a local machine. As a result, you can view folders and files in running containers and open a terminal window.

Container Tools Window in Visual Studio 2019 v16.4
Container Tools Window in Visual Studio v16.4


XAML tooling improvements for WPF and UWP desktop developers

Furthermore, we are continuing to invest in productivity improvements for desktop developers building WPF and UWP applications. New features include IntelliSense support for XAML snippets, a “Just My XAML” filter for the Live Visual Tree, and a merge resource dictionary feature. Also included, is the ability to pop up the code editor view separate from the XAML designer.


Pinnable Properties Tool

We are continuing to improve debugging capabilities in this release. With this in mind, we are delighted to announce how identifying objects by their properties while debugging has just become easier and more discoverable with the new Pinnable Properties tool. In short, hover the cursor over a property you want to display in the debugger of the Watch, Autos, and Locals windows.  Click the pin icon. Next, you will see the information you are looking for at the top of your display!

Pin Properties in Debugger in Visual Studio 2019 v16.4
Pin Properties in Debugger shown in Visual Studio 2019 v16.4


Additionally, to help make debugging asynchronous code easier, we have added new features to Parallel Stacks for Tasks, a window that visualizes Tasks in .NET.


.NET Productivity

We added the new Go To Base command to navigate up the inheritance chain. The Go To Base command is available on the context (right-click) menu or you can type (Alt+Home) on the element you want to navigate through the inheritance hierarchy.

Go To Base Command in Visual Studio 2019 v16.4
Go To Base Command shown in Visual Studio 2019 v16.4


Also, you can configure the severity level of a code style rule directly through the editor. Place your cursor on the error, warning, or suggestion and type (Ctrl+.) to open the Quick Actions and Refactorings menu. Next, select ‘Configure or Suppress issues’. Finally, select the rule and choose the severity level you would like to configure. This will update your existing EditorConfig with the rule’s new severity. If you do not currently have an .editorconfig file, one will be automatically generated.


Vertical Tabs in Preview

Ever find yourself needing to see more of your document tabs or more lines of code? Now you can take advantage of the horizontal real estate of your widescreen monitors by using vertical document tabs.  To learn how to preview this feature, the details are in the vertical document tabs blog.

Vertical Tabs in Visual Studio 2019 v16.4


C++ Tooling

We have made three major improvements in the C++ development experience: the Clang-tidy integration in the editor, Address Sanitizer experimental support, and C++ Build Insights support for the MSVC compiler toolset. In addition to the improvements outlined below, this release also brings C++/CLI support in .NET Core 3.1 and several new enhancements to the CMake integration.  These include debug target selection, overview pages and easier customization of environment variables.

Clang-tidy Integration

C++ Code Analysis now natively supports Clang-Tidy for both MSBuild and CMake projects, whether you’re using a Clang or MSVC toolset. clang-tidy checks can run as part of background code analysis, appear as in-editor warnings (squiggles), and display in the Error List.

Clang-Tidy Integration in Visual Studio 2019 v16.4
Clang-Tidy integration in Visual Studio 2019 v16.4


Address Sanitizer support in MSVC (experimental)

You can now enable Address Sanitizer (ASAN) for your Windows C++ projects compiled with MSVC Compiler toolset. ASAN is a fast memory error detector that can find runtime memory issues such as use-after-free and perform out of bounds checks. This support is still experimental as we are actively working on further improving support in upcoming updates.

Address Sanitizer support in MSVC (Experimental) in Visual Studio 2019 v16.4
Visual Studio 2019 v16.4 Experimental Address Sanitizer support in MSVC

C++ Build Insights

You also have access to a collection of ETW-based tools that allow you to analyze your C++ builds and make decisions tailored to your own build scenarios. Consequently, there should be improvements to your build times. To learn more, check out the first in a series of blogposts on this topic: Introducing C++ Build Insights.

C++ Build Insights
C++ Build Insights Demonstration in Visual Studio 2019 v16.4


Visual Studio now supports “FIPS compliance mode”

Starting with version 16.4, Visual Studio 2019 now supports “FIPS 140-2 compliance mode” when developing apps and solutions for Windows, Azure, and .NET.  As an important note, there are some scenarios which may not use FIPS 140-2 approved algorithms.  These include developing apps or solutions for non-Microsoft platforms like Linux, iOS, or Android as well as third-party software included with Visual Studio or extensions that you choose to install. Finally, development for SharePoint solutions does not support FIPS 140-2 compliance mode.

To configure FIPS 140-2 compliance mode for Visual Studio, install .NET Framework 4.8 and enable the Windows group policy setting: “System cryptography: Use FIPS compliant algorithms for encryption, hashing, and signing.”


Extended support for Visual Studio 2019 version 16.4

Visual Studio 2019 version 16.4 is the second supported servicing baseline for Visual Studio 2019. Consequently, Enterprise and Professional customers needing to adopt a long term stable and secure development environment are encouraged to standardize on this version.  As explained in more detail in our lifecycle and support policy, version 16.4 will be supported with fixes and security updates for one year after the release of the next servicing baseline.

In addition, now that version 16.4 is available, version 16.0, our last released servicing baseline, will be supported for an additional 12 months. It will go out of support in January 2021. Note as well, versions 16.1, 16.2, and 16.3 are no longer under support. These intermediary releases received servicing fixes only until the next minor update released.

You can acquire the latest most secure version of Visual Studio 2019 version 16.4 in the downloads section of my.visualstudio.com.  For more information about Visual Studio supported baselines, please review the support policy for Visual Studio 2019.


End of Support reminders for prior versions of Visual Studio and Expression 4

The following products are nearing their end of support lifetime, which means that we will no longer be issuing security updates for these products.  These dates are all available on the Microsoft Lifecycle Policy site.

  • Visual Studio 2017 version 15.0 – support ends on Jan 14, 2020
  • Visual Studio 2010 suite of products – support ends on July 14, 2020
  • Expression 4 suite of products – support ends on Oct 13, 2020


Happy Developing into the New Year!

In whatever way you celebrate the season and the new year, we hope these features will keep you producing your best projects until the time comes to unplug and enjoy the festivities. We love to hear inspiring ideas of ways to improve Visual Studio 2019. Please take all questions and suggestions to Developer Community as this is where teams interact the most. Thank you for all you do to contribute to the community, and we wish you all of the best!

What’s new in XAML developer tools in Visual Studio 2019 for WPF & UWP

$
0
0

Since the launch of Visual Studio 2019 we’ve released many new features for XAML developers working on WPF or UWP desktop applications. With this week’s release of Visual Studio 2019 version 16.4 and 16.5 Preview 1 we’d like to use this opportunity to do a recap of what’s new throughout the year. If you missed our previous releases or simply have not had a chance to catch-up, this blog post will be the one place where you can see every major improvement we’ve made throughout 2019.

XAML Live Debugging Tools:

  • XAML C# Edit & Continue is now known as XAML Hot Reload (v16.2): XAML C# edit & continue for WPF/UWP customers is now known as XAML Hot Reload, this new name is intended to be better aligned with how the feature actually works (since no pause is required after a XAML edit is made) and match the similar functionality in Xamarin.Forms.
  • XAML Hot Reload available/unavailable (v16.2): The in-app toolbar has been updated to indicate if XAML Hot Reload is available/unavailable and link to the related documentation. Before this improvement customers had no way to know if XAML Hot Reload was working without trying to first use the feature, which was leading to confusion.
  • In-app toolbar now themed (v16.2): The in-app toolbar is now styled according to the Visual Studio selected theme colors.
In-app toolbar now themed (v16.2)


  • In-app toolbar element selection behavior changes: We’ve updated the behavior of the in-app toolbar feature “Enable selection” for selecting elements within the running app. With this change the selector will stop selecting elements after you have selected your first element. This brings it in line with similar tools such as F12 browser tools and is based on customer feedback.
  • XAML Hot Reload now supports x:bind (UWP) – v16.0: XAML Hot Reload (previous called “XAML Edit & Continue”) now supports editing data bindings created with x:bind for paths containing public properties, element name, indexed property paths (collections), attached properties, and cast properties. Other changes are not supported. This enhancement is available to any app where the minimum and maximum versions target Windows 10 SDK version 1809 (build 10.0.17763) or higher.
  • XAML Hot Reload support added for WPF resource dictionaries changes (v16.3): XAML Hot Reload now supports updating WPF Resource Dictionaries for real-time updates in the application. Previously this feature was only available to Universal Windows Platform (UWP), but is now supported for WPF .NET Framework, WPF .NET Core and UWP apps. Supported actions include adding a new Resources section definition and adding, deleting and updating resources new/existing sections.
  • Just My XAML in Live Visual Tree: The Live Visual Tree is a feature that is available to both UWP and WPF developers when they run their application in debug mode and is part of the live editing tooling related to XAML Hot Reload. Previously the feature would display the full live visual tree of the attached running application with no filter possible to see just the XAML you’ve written in your app. This made for a very noisy experience and based on customer feedback we’ve added a new default called “Just My XAML” which will limit the tree to just controls you wrote in your application. While this is the new default it is still possible to go back to the previous behavior through either the button within the Live Visual Tree itself or through a new setting (found under: Options > Debugging > General > Enable Just My XAML).
Just My XAML in Live Visual Tree


  • In-app toolbar now movable (v16.3): The in-app toolbar has been enhanced so that it is movable within the running WPF/UWP application, enabling developers to drag it left or right within the app to unblock app UI. Note that position to which the toolbar is moved is not stored between sessions and will go back to the default position when your app is restarted.
In-app toolbar now movable (v16.3)


  • XAML Binding Failures panel (standalone VSIX early alpha preview): To help developers when data binding failures occur in their application, we’ve got a new feature in development that brings a dedicated XAML Binding Failures panel to visual studio. While this feature will eventually work for all XAML developers (WPF, UWP and Xamarin.Forms) in this first preview the new panel will make it easier to identify binding failures for those customers building WPF application.
XAML Binding Failures panel (standalone VSIX early alpha preview)


This feature means that developers will no longer have to use the output window to detect binding failures and make them more discoverable to newer developers.

This feature is still very early in development and not included in Visual Studio, if you wish to start testing it today you can do so by downloading our alpha VSIX.

XAML Designer

  • WPF Designer now fully available (GA) for WPF .NET Core Projects (v16.3): The XAML Designer for WPF .NET Core applications is now generally available (GA) to all customers without the need for preview feature flag. The XAML Designer for WPF .NET Core applications is slightly different in some behaviors and functionality then WPF .NET Framework Designer, please note this is by design. Given the difference we’d like to encourage customers to report any problems or limitations that you might be running into using Visual Studio feedback feature.
WPF Designer now fully available (GA) for WPF .NET Core Projects (v16.3)


  • XAML Designer zoom/position now defaults to Fit All (v16.4): Based on customer feedback we’ve reevaluated the default XAML Designer zoom behavior that occurs when you open a XAML window/page/control/etc. The previous experienced stored the zoom level and position for each file across Visual Studio sessions which caused confusion when customers were coming back to a file after some time had passed. Starting with this release we will only store the zoom level and position for the duration of the active session and go back to a “fit all” default once Visual Studio is restarted.
  • Create Data Binding Dialog (v16.4): Visual Studio has had a data binding dialog available to WPF .NET Framework developers from the right-click of the XAML Designer and Property Explorer, and this dialog was also previously available to UWP developers. In this release we’re bringing back this experience to UWP developers and adding support for WPF .NET Core applications. This feature is still in development and will continue to improve in the future to bring back feature parity with .NET Framework dialog capabilities.
  • XAML Designer Suggested Actions (v16.5 Preview): In this release we’ve made available a new preview featured called Suggested Actions that enables easy access to common properties when a control is selected within the XAML Designer. To use this feature first enable it through Options > Preview Features > XAML Suggested Actions. Once enabled click on a supported control and use the lightbulb to expand and interact with the Suggestion Actions UI. In this release supported controls include: Border, Button, Canvas, CheckBox, ComboBox, Grid, Image, Label, ListBox, ListView, StackPanel, TextBlock, TextBox. While in preview this feature is also only available for WPF .NET Core applications and doesn’t support extensibility, nor is it feature complete.
XAML Designer Suggested Actions (v16.5 Preview)


(Please note that this feature is under active development and might change significantly before final release, so your feedback is crucial, and we hope to hear from you through the Visual Studio feedback tool.)

XAML Editor

  • IntelliCode Support for XAML (v16.0): IntelliCode is an AI-assisted IntelliSense for multiple languages that predicts the most likely correct API for the developer to use instead of just an alphabetical list of members. IntelliCode supports languages such as C#, C++, XAML and others.
  • Improvements to #regions IntelliSense (v16.4): Starting with Visual Studio 2015 #region support has been available for WPF and UWP XAML developers and more recently for Xamarin.Forms. In this release we’ve fixed an IntelliSense bug, with this fix #regions will now show properly as you begin to type <!.
  • Snippets in XAML IntelliSense (v16.4): IntelliSense has been enhanced to support showing XAML snippets, this will work for both built-in snippets and any custom snippets that you add manually. Starting with this release we’re also including some out-of-the-box XAML snippets: #region, Column definition, Row definition, Setter and Tag.
  • Pop up XAML editor as a separate window from designer (v16.4): It is now possible to easily split the XAML Designer and its underlying XAML editor into separate windows using the new Pop up XAML button next to the XAML tab. When clicked the XAML designer will minimize its attached XAML tab and pop open a new window for just the XAML editor view. You can move this new window to any display or tab group in Visual Studio. Note that it is still possible to expand the original XAML view but regardless all XAML views of the same file will stay synchronized in real-time.
Pop up XAML editor as a separate window from designer (v16.4)


  • Displaying resources for referenced assemblies (v16.4): XAML IntelliSense has been updated to support displaying XAML resources from a referenced assembly (when source is not available) for WPF Framework and WPF .NET Core projects.

XAML Islands:

  • Improved XAML Island support (v16.4): We’ve added support for XAML Islands scenario for Windows Forms and WPF .NET Core 3 apps making it easier to add UWP XAML control into these applications. With these improvements a .NET Core 3 project can a reference to UWP project that contains custom UWP XAML controls. Those custom controls can be used by the WindowsXamlHost controls shipped within the Windows Community Toolkit v6 (Microsoft.Toolkit.Wpf.UI.XamlHost v6.0). You can also use the Windows Application Packaging project to generates MSIX for you .NET Core 3 with Islands. To learn how to get started visit our documentation.

Resources & Templates

  • Merge Resource Dictionary:It is now possible to easily merge an existing resource dictionary within your UWP/WPF project with any valid XAML file using the new feature available through the solution explorer. Simply open the XAML file in which you want to add the merge statement, then find the file you wish to merge in and right-click on it in solution explorer. In the context menu select the option “Merge Resource Dictionary Into Active Window”, which will add the right merge XAML with path.
Merge Resource Dictionary


  • Edit Template now works with controls from 3rd party controls: It is now possible to create a copy of a controls template even when it’s not part of your solution as source code. With this change the “Edit Template” feature will now be available and work as it does for 1st party elements where the source is available today. Note that this feature is applicable to both 3rd party control libraries and 1st party where source isn’t available.

Packaging and Signing

  • Signing Certificates for UWP apps (v16.3): Brought back the ability to create and import signing certificate files (.pfx) through the Manifest Designer. We’ve also introduced the ability to create and import signing certificates through the Packaging Wizard to streamline the signing process.
Signing Certificates for UWP apps (v16.3)


Related News

Recently there were also other announcements that are relevant to desktop developers, if you missed any of these here is a consolidated list for your consideration:

  • Visual Studio App Center now support .NET desktop applications including WinForms, WPF and UWP. This includes apps powered by .NET Framework or .NET Core and supported features include deployment, health monitoring (crash reporting) and real-time insights (custom telemetry). For full details check out their recent blog post.
  • Windows has announced WinUI 3, with both the alpha release and long-term roadmap announced. With WinUI 3 developers will be able to use the power of modern XAML to build both desktop and UWP applications powered by .NET Core or C++. To learn all the details see their roadmap.
  • Windows UI Library 2.3 is now available, which continues to add more controls for UWP developers. For all the details see their release notes.
  • Ignite 2019 XAML conference sessions are now available as free on-demand videos, if you missed Ignite this year their worth checking out.

Conclusion

These features are also just some of the things we’ve been working on, with many more still in development and we hope to share more information with you when their ready.

For now, please keep your feedback coming as many of the above items were created based on customer input, as your input is a critical part of how we improve Visual Studio.

Finally, you can also see demos for many of the above features in our latest Visual Studio Toolbox video:

Pinnable Properties: Debug & Display Managed Objects YOUR Way

$
0
0

A few months ago, I wrote a blog post about the DebuggerDisplay attribute. This is a managed attribute that lets you customize how you view objects in debugging windows by “favoriting” specific properties. Since that post, we’ve streamlined DebuggerDisplay’s behavior with Pinnable Properties, a new managed feature available for Visual Studio 16.4!

Native developers: Fear not, Pinnable Properties will also be available for C++ in a later update!


Pinning a property in the Locals window
Pinning a property


How does the Pinnable Properties tool work?

The Pinnable Properties tool is located in DataTips and the Autos, Locals, and Watch windows at debug time. To use the tool, hover over a property and select the toggle-able pin icon that appears or select the “Pin Member as Favorite” option in the context menu. You will immediately see your selected members bubble to the top of your property list and appear in the Values column of any of the debugger inspection windows, replacing the default object type that is typically displayed. Now you can quickly identify and scan through your countless objects, greatly increasing your productivity.


Pinning properties in DataTips


The properties you pin will persist across all your future debugging sessions until you decide to unpin them. Also, you can filter unpinned properties and hide property names via the Watch window toolbar or a DataTip context menu.


Filter out unpinned properties


Toggle property names on and off with pinned properties
Toggle pinned property names


Why does the Pinnable Properties tool exist?

Your feedback determined that there was high demand for quickly identifying objects in debugger windows via specific properties. Though DebuggerDisplay and Natvis can accomplish this task, they have several drawbacks that we observed and learned from you and other developers, including:

  • having to modify your code to use the attribute
  • the inability to use the attribute dynamically at debug time
  • the lack of discoverability (I have been asked many times if DebuggerDisplay is a Visual Studio 2019 exclusive feature when it’s been out for many, many years now…)

We created the Pinnable Properties tool to reduce these issues and provide with you with an easier, more intuitive, and real-time method to customize your object inspection experience without having to modify your code or override your ToString() method.


Try out Pinnable Properties and give us even more feedback!

Pinnable Properties would not have been possible without your enthusiasm and feedback for improving the existing DebuggerDisplay and Natvis behavior.  We encourage you to try it out and share your thoughts on how we can make this tool even better in the comments or via this survey!


Visual Studio 2019 for Mac version 8.4 Preview 4 is now available

$
0
0

Today, we released Visual Studio 2019 for Mac version 8.4 Preview 4. This preview version of Visual Studio for Mac brings support for the latest stable version of .NET Core, Scaffolding support for ASP.NET Core projects, and additional improvements to overall product accessibility. Developers using Xamarin Pair to Mac should also look at the additional information in this blog post related to our release schedule.

To try out the preview, you’ll need to download and install the latest version of Visual Studio 2019 for Mac, then switch to the Preview channel in the IDE.

For more information on the other changes in this release, look at our release notes.

Stay on the latest and greatest with support for .NET Core 3.1

With this release, Visual Studio for Mac adds official support for the newly released .NET Core 3.1. While this release of .NET Core brings with it a small series of improvements over .NET Core 3.0, it’s important to note that .NET Core 3.1 is a long-term supported (LTS) release. This means it will be supported for three years.

Updating to Preview 4 will install the .NET Core 3.1 SDK. If you previously installed Visual Studio for Mac without selecting the .NET Core target in the installer, you’ll need to take the following steps to get started developing .NET Core in Visual Studio for Mac:

Demonstration of the .NET Core target being checked in the Visual Studio for Mac installer

The .NET Core 3.1 release notes contain a full list of changes introduced by this update.

Use assistive technology more reliably

We’re committed to empowering all Mac developers with the ability to bring their thoughts to life using Visual Studio for Mac. In order to do so, we realize the need to support various assistive technologies. We’ve continued to make improvements to accessibility over the entire surface area of the IDE. Some of these efforts include:

  • Refining focus order when navigating with assistive technologies
  • Increasing color contrast ratios for text and icons
  • Eliminating keyboard traps that hinder navigation of the IDE
  • More accurate VoiceOver reading and navigation
  • Rewriting inaccessible components of the IDE with accessibility in mind

Despite the work we’re doing to make Visual Studio for Mac accessible to all, we know there’s still a long journey ahead of us and no end of the road when it comes to making the IDE a delightful experience for all. This has been and will continue to be a top priority for our team and we welcome any and all feedback from our users that will assist in guiding this work. Please reach out directly to me via dominicn@microsoft.com if you’d like to engage with us directly on our accessibility work. I’d look forward to learning from those of you who reach out.

Speaking about feedback from our community, let’s move on to ASP.NET Core Scaffolding…

Speed up your web app development with ASP.NET Core Scaffolding

A top ask from our community has been to add ASP.NET Core Scaffolding to Visual Studio for Mac. We’ve taken that feedback and have now enabled Scaffolding for ASP.NET Core projects in Visual Studio for Mac. Scaffolding makes ASP.NET Core app development easier and faster by generating boilerplate code for common scenarios.

To use the new Scaffolding feature in Visual Studio for Mac, click on the New Scaffolding entry in the Add flyout of the project context menu. The node on which you opened the right-click context menu will be the location where the generated files will be placed.

You’ll then see a Scaffolding wizard to help you generate code into your project. In the image below, I’m using one of our ASP.NET Core sample projects – a movie database app – to demonstrate scaffolding in action. I’ve used the tool to make pages for Create, Read, Update, and Delete operations (CRUD) and a Details page for the movie model.

Scaffolding wizard for ASP.NET Core project in Visual Studio for Mac

Once the wizard closes, it will add required NuGet packages to your project and create additional pages, based on the scaffolder you chose.

If you’re new to Scaffolding ASP.NET Core projects, take a look at our documentation for more information.

Xamarin Pair to Mac considerations

Developers using Visual Studio 2019 for Mac version 8.3 with Visual Studio 2019 version 16.4 for iOS development with Xamarin will see the following warnings in Windows:

Xamarin Pair to Mac warning messages

If you agree to continue, the Mono and Xamarin.iOS SDKs on your Mac will be updated to the latest versions. While we recommend updating to Visual Studio 2019 for Mac 8.4 Preview 4 to avoid version mismatches when working with Xamarin on Windows, updating by clicking through the warnings shown above will allow you to continue to work without moving from the Stable channel on Mac.

We plan to release Visual Studio for Mac version 8.4 to Stable in early January and appreciate your patience with this experience and the workaround until then.

Give it a try today!

Now that we’ve discussed the major additions to Visual Studio for Mac version 8.4 Preview 4, it’s time to download and install the release! To do so, make sure you’ve downloaded Visual Studio 2019 for Mac, then switch to the Preview channel.

As always, if you have any feedback on this, or any, version of Visual Studio for Mac, we invite you to leave them in the comments below this post or to reach out to us on Twitter at @VisualStudioMac. If you run into issues while using Visual Studio for Mac, you can use Report a Problem to notify the team. In addition to product issues, we also welcome your feature suggestions on the Visual Studio Developer Community website.

The post Visual Studio 2019 for Mac version 8.4 Preview 4 is now available appeared first on Visual Studio Blog.

Modernizing Find in Files

$
0
0

Find in Files is one of the most commonly used features in Visual Studio. It’s also a feature that gets a substantial amount of feedback, and due to the age of the code, has been very costly to improve. Earlier this year, we decided to reimplement the feature from the ground up in order to realize significant performance and usability improvements.

We’ve released the new find in files experience in Visual Studio 2019 version 16.5 Preview 1 and we’re looking for feedback from the community. We expect this experience to be the one our developers will use and love in the future, so we want to make sure we’ve prioritized the right features. We still have more improvements coming that we’re not quite ready to talk about yet, but before we deprecate the old experience, we want to make sure the new version is meeting the needs of our users.

A screen capture of the new Find in Files dialog.

The new experience is available by searching for “Find in Files” or “Replace in Files” in Visual Studio search (Ctrl+Q by default). You can also get to these commands with Ctrl+Shift+F and Ctrl+Shift+H respectively. The new experience is pictured above and should be easily recognized by the more modern look and consistent color theming.

If you’re not seeing the new version, you can search for “Preview Features” in Visual Studio search (Again, Ctrl+Q by default). On that page, make sure “Use previous Find in Files” is unchecked. Conversely, if you’re having problems with the new experience, you can toggle this option to enable the old one. If you do find that you need the old Find in Files experience, we’d love to hear why. Please feel free to supply any feedback you might have over in Developer Community.

Performance

We took the previous implementation of Find in Files and reimplemented it completely in managed C#. This allows us to avoid unnecessary interop calls and gives us much more room for improving the experience. The memory consumption is smaller, and our performance is much faster.

In our internal testing on directories containing 100k+ files, we saw searches that took over 4 minutes with the old implementation be done in 26 seconds. The biggest gains are in searches that use regular expressions, but searches without regular expressions generally cut the search time in half.

Specifying Paths

Using the new experience should feel comfortable for most folks since we’ve gone with an experience that matches many other common find experiences. There are a few nuances that are worth calling out.

A screen capture of the Find in Files dialog that is cropped to only show the Look in and File types fields along with the options to include miscellaneous and external items.

The “Look in” box has a new option, “Current Directory”, which will search the folder that contains the currently open document. When searching a solution, there are checkboxes to include miscellaneous files (files that you’ve opened but aren’t part of the solution) as well as external items (files like “windows.h” that you might reference but aren’t part of the solution).

The three dots button next to the “Look in” box work like any other browse option to specify a directory to look in, but if you’ve already specified a directory, this button will append the new directory instead of replacing. For instance, if your “Look in” value was “.\Code”, you could click the three buttons and navigate to a folder named “Shared Code”. The “Look in” would now show “.\Code;.\Shared Code” and when the Find command is executed, it will search both of those folders.

The File types folder now also can exclude files. Any path or file type prefixed with the “!” character will be excluded from the search. For instance, you can add “!*\node_modules\*” to the file types list to exclude any files in a node_modules folder.

Multiple Searches

One of the more frequent requests we’ve gotten is the ability to keep the results from one search while doing other searches. This makes it easy to compare results and see them side-by-side. This feature has been in Visual Studio for a while, and the new experience still supports it.

In the screenshot above, the Keep Results button has been enabled. Now, when a new search is executed, the results will be shown in a new tab. The screenshot above shows three searches that have already completed. Currently, this feature supports up to five searches. If you’ve already got five search results showing, the next search will reuse the oldest search result tab.

The Keep Results button is available for Find in Files as well as the Find All References feature.

Regular Expression Builder

A screen capture of the Find in Files dialog with a regular expression being used.

With Visual Studio 2019 version 16.5 preview 2, the Regular Expression builder will be available. The “Use regular expressions” checkbox will enable you to specify a regular expression as a pattern for a match. Checking this box with Visual Studio 2019 version 16.5 preview 2 (or later) will also bring up the Regular Expression builder, which is useful for creating regular expressions. Regular expressions can allow searches for strings that span multiple lines. For instance, the expression “.*Hello.*\r\n.*World.*” will match any occurrence of the string “Hello” that has an occurrence of the string “World” anywhere on the next line.

When the “Use regular expressions” checkbox is checked, the regular expression builder will appear next to the Find field. Clicking this will give some examples for building regular expressions as well as a link to the documentation.

What’s Next

Now that the Find in Files experience has been reimplemented to use the newer patterns of Visual Studio, we’re going to be able to provide more of the features we get asked for. We’d love to hear your experiences with the new dialog. We’re always watching Developer Community, and we’ve got a survey specifically for collecting feedback on the new experience that you can answer here. We know there are features that aren’t available today and your feedback is how we’ll prioritize the rest of the features. If you’re running into problems or you think the new dialog isn’t working correctly, please send us feedback with the Give Feedback button in Visual Studio.

The post Modernizing Find in Files appeared first on Visual Studio Blog.

Achievement Unlocked: Visual Studio for Mac ASP.NET Core Challenge Completed

$
0
0

Last month, we kicked-off a challenge for our developer community to build a solution using ASP.NET Core and the new .NET Core features in Visual Studio for Mac. We were delighted to hear from so many of you and we were excited to receive many projects built from scratch using some of the control libraries we highlighted. Check out some of the submissions that came our way:

Screen shots of apps built for the challenge - resume pages, a weather forecast, a mailbox sample, and other projects.

Thank you!

Thanks to all of you who took part in this challenge – we’re reaching out to get you the sweet, sweet swag that was mentioned as a perk of participating.

We’d also like to say thank you to the .NET Core component library partners that took part in this challenge by contributing licenses to the prize list and for their continued support of .NET Core developers on Mac:

More .NET Core, Coming Soon

The currently released Visual Studio for Mac v8.3 has full support for .NET Core 3.0. Our v8.4 release, now available in preview, adds support for .NET Core 3.1, Blazor, and ASP.NET Core scaffolding. You can read more about it in the announcement post from last week.

If you have any feedback on this, or any, version of Visual Studio for Mac, we invite you to leave them in the comments below this post or to reach out to us on Twitter at @VisualStudioMac. If you run into issues while using Visual Studio for Mac, you can use Report a Problem to notify the team. In addition to product issues, we also welcome your feature suggestions on the Visual Studio Developer Community website.

The post Achievement Unlocked: Visual Studio for Mac ASP.NET Core Challenge Completed appeared first on Visual Studio Blog.

Build Visual Studio extensions using Visual Studio extensions

$
0
0

What if the community of extension authors banded together to add powerful features to Visual Studio that made it easier to create extensions? What if those features could be delivered in individually released extensions, but joined by a single installation experience that allows the user to choose which of the features to install? That’s the idea behind Extensibility Essentials – an extension pack that ships community-recommended extensions for extension authors.

Extension authors are usually interested in improving their own tooling in Visual Studio – either by installing extensions created by others or by building some themselves. By banding together, we can create the best and most comprehensive tooling experience for extension authoring. So, let’s test that theory by creating a range of extensions published to the Marketplace under our own accounts, and reference them in Extensibility Essentials to provide a unified and simple installation experience.

The individual extensions can and probably should be single purpose in nature. This prevents feature-creep where additional features are added that may or may not be useful for extension authors. If additional features are not closely related to the extension, then simply create a new extension for them. That way it is up to the individual extension author to decide if they wish to install it. It is also crucial that the extensions follow all the best practices.

Once the individual extension is stable, it can be added to Extensibility Essentials.

The extension pack Extensibility Essentials doesn’t do anything by itself. It is a barebone extension pack that just references the individual extensions. When installing the extension pack, the user can choose which of the referenced extensions to install. At the time of this writing, there are 9 individual extensions.

How the individual extensions are listed before installing

Ideas for new extensions can be centralized to the GitHub issue tracker. By collecting ideas in a central location, it provides a single location to comment on and potentially design features ahead of implementation.

The issue tracker is for both bugs and suggested features

It would be cool if…

So next time you’re sitting in Visual Studio working on an extension, think about what feature you’d like that would make you more productive. If you can’t think of a feature, but feel there is a scenario that is particularly problematic, then open a bug on the GitHub issue tracker and let other people try to figure out how an extension could perhaps solve the issue.

Thinking “it would be cool if…” is the first step to make it possible and with the Extensibility Essentials, it might be closer to becoming reality than imagined.

Does this idea resonate with you? Let me know in the comments.

Mads Kristensen, Senior Program Manager
@mkristensen

Mads Kristensen is a senior program manager on the Visual Studio Extensibility team. He is passionate about extension authoring, and over the years, he’s written some of the most popular ones with millions of downloads.

Q# – a Wish List for the New Year

$
0
0

In previous blog posts you have read about some of the ideas behind Q#, how it came into existence, and its development over the past year. You have read about quantum computing, quantum algorithms and what you can do with Q# today. With the end of the year approaching, there is only one more thing to cover: What is next?

This blog post is about our aspirations for the future and how you can help to accomplish them. It contains some of our visions going forward, and we would love to hear your thoughts in the comment section below.

Community

One of the most exciting things about Q# for us is the growing community around it. Being rooted in the principles of quantum mechanics, quantum computing tends to have this air of unapproachability to the “uninitiated”. However, quantum computing builds on the notion of an idealized quantum system that behaves according to a handful of fairly easy to learn principles. With a little bit of acquired background in linear algebra, some persistence, and patience when wrapping your head around how measurements work it is possible to get knee-deep into quantum algorithms reasonably quickly!

Of course, a couple of good blog posts on some of these principles can help. We strive to actively support you in the adventure of exploring quantum algorithms by providing materials that help you get started, like our growing set of quantum katas. Our arsenal of open source libraries provides a large variety of building blocks to use in your quest of harnessing the power of quantum. One of the main benefits of open source projects is being able to share your work with all the people brave enough to explore the possibilities that quantum has to offer. Share your progress and help others build on your achievements! Whether in kata or library form, we welcome contributions of any size to our repositories. Let us know how we can help to make contributing easier.

Exchange among developers is one of the most important aspects of software development. It is omnipresent and vital to building a sustainable environment around a particular toolchain and topic. Thankfully, modern technology has made that exchange a lot easier than when the first computer programmers started their careers. We intend to make full use of the power of the internet and give a voice and a platform for discussions on topics related to Q# and quantum computing to developers around the world. The Q# dev blog is part of this effort. Contact us or comment below if you have an idea for a blog post or would like to hear more about a specific topic related to Q#. Establishing good feedback channels is always a challenging endeavor and in particular for a small team like ours. We would like this place to become a source of knowledge and exchange, a place where you can find the latest news and voice your take on them.

Growth

This brings us back to our plans for Q#. We have built Q# to make quantum development easier and more accessible. Of course, there were also a couple of other considerations that have played into that decision. For instance, we are anticipating the need to automate what is largely done in manual labor today, e.g. qubit layout and gate synthesis that are often still done on a case-by-case basis for each program and targeted hardware. When is the last time you worried about how error correction works on the hardware your code gets executed on? With qubits being an extremely scarce resource, and the long-term ambition to use quantum computing to address the most computationally intensive tasks that cannot be tackled with current hardware, the optimization of large-scale quantum programs needs to be a priority. We chose to develop our own language in order to have full control and flexibility over what information is represented how, and when it is used during compilation in order to be able to support a modular and scalable software architecture for executing quantum programs. But that’s a tale for another time. What is important is that these considerations are key factors in how we design and develop the language going forward.

A programming language is more than just a convenient set of tools for expressing an algorithm. It shapes the way that we think and reason about a problem, how we structure it and break it down into tasks when building a solution. A programming language can have a tremendous impact on our understanding of existing approaches, as well as how to adapt and combine them for our purposes. Particularly so when venturing into new territory.

Our goal is therefore to build a shared understanding of what it is we strive to accomplish, and to evolve Q# into the powerful language needed to drive progress in quantum programming. Our goal is to leverage the expertise of a community of language designers, compiler veterans, quantum physicists, algorithms and hardware experts, and a variety of software developers to shape a new kind of computing architecture. And we want you to be part of it.

Transparency

Since our 0.3 release at the beginning of November we have been eagerly working on not just the next release, but on defining and preparing the next steps in 2019. While we are in the middle of formulating our plans for the future, I want to give you a brief insight into some of our considerations.

As I am sure you have noticed, the support for data structures in Q# is minimal. While we do provide quite a few high-level language features for abstracting classical and quantum control flow, we intentionally omit some of the more object-oriented mechanisms such as classes. We anticipate remaining heavily focused on transformations that modify the quantum state, expressed as operations in Q#, as well as their characteristics and relations in the future. However, basic bundling of data and manipulations of such is of course an important aspect of many programs and we want to provide suitable mechanisms to express these in a way that allows to make abstractions, is convenient, and is resistant to coding errors. User defined types in the current setting have limited power besides an increased type safety. The “black box approach” to type parameterization currently restricts their usefulness; we do not provide a mechanism for dynamic reflection and it is not possible to apply operators or other type specific functionalities to argument items whose type is resolved for each call individually. In that sense, these items are “black boxes” that can merely be passed around. We want to do as much of the heavy lifting as possible statically in particular since debuggability of quantum devices is a huge challenge. There are several mechanisms one might consider alleviating the consequences of these decisions. On one hand, type constraints are a common mechanism used in several popular languages. In a sense, they can be seen as “specializations based on the properties of a type”. One could also pursue the stricter path of specializing based on the concrete type itself, de-facto adding a form of overloading that we currently explicitly prevent from being used. Either way, by clearly separating user defined types from tuples in the type system we have made a first step towards extending their power.

If you are curious to hear more about possible ideas for Q#, their benefits and caveats, or want to share some thoughts of your own, comment below! Contribute to the discussion and post your speculations to the question: What makes a quantum programming language “quantum”, i.e. what makes it particularly suited for quantum computing?

Join us

I hope you join us into a new year of pushing the boundaries of computation by participating in our coding competitions, contributing to our open source repositories, commenting on or writing blog posts and sharing your ideas and experiences!

How about a new year’s resolution of your own? Let us know what you expect to accomplish and how we can help you achieve your new year’s resolution around quantum programming in Q#!

Bettina Heim, Senior SDE, Quantum Software and Application
@beheim
Bettina Heim is a quantum physicist and software engineer working in the Quantum Architectures and Computation Group at Microsoft Research. She is responsible for the Q# compiler and part of the Q# language design team. Prior to joining Microsoft she worked on quantum algorithms, adiabatic quantum computing, discrete optimization problems, and the simulation and benchmarking of quantum computing devices.
Viewing all 1143 articles
Browse latest View live


<script src="https://jsc.adskeeper.com/r/s/rssing.com.1596347.js" async> </script>