Quantcast
Channel: Visual Studio Blog
Viewing all 1144 articles
Browse latest View live

Using GitHub Copilot as your Coding GPS

$
0
0

In this series, we delve into GitHub Copilot in Visual Studio, showcasing how it aids coding. GitHub Copilot functions as a coding GPS, guiding you through software development in Visual Studio. In our new short video, Bruno Capuano shows how this smart coding assistant boosts coding efficiency and quality.

GitHub Copilot: an assistant, not a replacement

Bruno says GitHub Copilot improves your coding in Visual Studio, not replaces developers. Microsoft agrees, saying AI should help humans, not replace them. CEO Satya Nadella says AI should boost productivity without replacing people.

Developers should check the code GitHub Copilot suggests. Sometimes it may suggest wrong code, called “hallucinations.” Though GitHub Copilot is usually accurate, however, reviewing its suggestions is important to be sure.

First, install GitHub Copilot. You can find setup help in GitHub Copilot documentation or our Microsoft Learn tutorial for installing GitHub Copilot Chat in Visual Studio.

Using LLMs for a new way of interaction

GitHub Copilot uses Large Language Models (LLMs) for its core. LLMs bring a new way to interact with computers. They use probabilities and lots of data to generate responses from natural-language prompts, making coding feel like a conversation. This interaction covers more than text; it includes images and videos as well.

Illustration with an overview of AI capabilities, including computer vision, voice recognition, image recognition, and more.

Because LLMs can vary, developers need to oversee this, ensuring consistency in their results.

Embracing the Future with GitHub Copilot

As AI becomes more common in industries, developers should adapt. Tools like GitHub Copilot can help by making coding more efficient and adaptable. To keep up, it’s important to learn about AI tools, their strengths, and their limits. Check out our resources and full-length video tutorial for more about GitHub Copilot and how to use it in your projects!

Additional Resources:

The post Using GitHub Copilot as your Coding GPS appeared first on Visual Studio Blog.


Mastering Slash Commands with GitHub Copilot in Visual Studio

$
0
0

GitHub Copilot, the AI-powered coding assistant, revolutionizes coding in Visual Studio with its advanced features. In this series, we delve into the efficiency and convenience offered by Slash Commands, elevating your coding workflow.

Introducing Slash Commands

Slash Commands are predefined actions within GitHub Copilot, accessible through the prompt interface. Bruno Capuano, in his latest video, elucidates these commands, accessible via the Slash button in the Copilot Chat window or by typing a forward slash in the message box.

Slash Commands menu by clicking the Slash button in the Copilot Chat window

Alternatively, you can also access the Slash Commands by typing a forward slash in the message box.

Image LBugnion 1 1712226760337

Key commands include:

  • doc: Insert a documentation comment in the current cursor position.
  • exp: Start a new conversation thread with a fresh context.
  • explain: Provide an explanation for the selected code.
  • fix: Suggest fixes for code errors and typos.
  • generate: Generate new code snippets based on your input.
  • optimize: Recommend code optimizations to improve performance.
  • tests: Create a unit test for the current code selection.
  • help: Access help and support for GitHub Copilot.


A Practical Example with /fix

Demonstrating the power of Slash Commands, the /fix command automatically suggests corrections for typos and errors, enhancing code quality and efficiency.

In the video, Bruno demonstrates how GitHub Copilot can automatically suggest corrections for typos and other issues. This command can be used in the main chat window, and it’s also accessible in the inline chat by pressing Alt-Slash (Alt-/) or through the right-click context menu.

As you can see, these Slash Commands can significantly improve your productivity in Visual Studio. Learn how to Install GitHub Copilot in Visual Studio.

Additional Resources

To learn more about GitHub Copilot and Slash Commands, check out our resource collection here. You can watch the full video here. For ongoing updates, stay tuned to this blog and consider subscribing to our YouTube channel for more insights and tutorials.

The post Mastering Slash Commands with GitHub Copilot in Visual Studio appeared first on Visual Studio Blog.

Get Ready for Visual Studio at Build 2024: Join Thousands Online!

$
0
0

MICROSOFT BUILD 2024

Watch it Live! or On-Demand – Starting Next Tuesday!

Next week, from May 21st, I’ll be diving into Microsoft Build 2024, and I invite you to come along for the ride—virtually! We’ll explore cutting-edge developments in Visual Studio, Azure, and AI development from wherever we are, no travel required. It’s your chance to join live discussions and connect with tech enthusiasts from around the world, all from your home or office.

This year, I’m particularly excited about charting new paths with AI and copilots. Whether you’re looking to boost your efficiency, secure your projects, or simply expand your tech horizons, the keynotes and breakout sessions are set to deliver. And if you have questions, the experts—yes, the real wizards behind Microsoft’s innovations—will be there to answer them in the session chat rooms.

To give you a head start, I’ve shared a few of the sessions I plan to attend below. Hopefully, they’ll inspire your own choices as you start building your ‘Session Planner’ today.

Banner for Microsoft Build 2024

Must See Sessions at Build 2024:

  • Microsoft Build Opening Keynote: Join Satya Nadella, Rajesh Jha, and Kevin Scott on Tuesday, May 21, from 9:00 AM to 11:00 AM PDT. Learn how this era of AI will unlock new opportunities, transform how developers work, and drive business productivity across industries.
  • Next Generation AI for Developers with the Microsoft Cloud: Join Scott Guthrie and leaders across Microsoft on Wednesday, May 22, from 8:30 AM to 10:00 AM PDT. Learn how to build secure and responsible AI solutions with the foundation of the Microsoft Cloud. Featuring a fireside chat with John Lambert and Julia Liuson to learn what you can do to create secure solutions in today’s threat landscape.
  • Maximize Joy, Minimize Toil with Great Developer Experiences: Join Amanda Silver and friends on Tuesday, May 21, from 1:00 PM to 1:45 PM PDT. At Microsoft, enhancing the developer experience is central to our mission. In this session, delve into the latest advancements in developer tools and learn about our collaborative efforts across the technology spectrum. Discover how these innovations are shaping the development of modern, intelligent apps.

Visual Studio at Build 2024:

Browse all the Build sessions online, but here’s a sampling of some of the Visual Studio sessions that will offer an in-depth look into what we’re currently developing and enhancing, with a strong technical focus:

  • What’s New in GitHub Copilot and Visual Studio: Explore enhancements in AI-assisted coding with Damian Brady and Filisha Shah on Wednesday, May 22, from 6:00 PM to 6:45 PM PDT. GitHub Copilot is your AI coding assistant, and when paired with Visual Studio, so much more! We’ll take you through tips and tricks, special integrations, and other recent enhancements to make sure you’re getting the most out of GitHub Copilot, including things that you can only do with Visual Studio.
  • Build Apps from the Cloud with Microsoft Dev Box, Visual Studio & More: Dive into cloud-native development with Anthony Cangialosi and Denizhan Yigitbas on Tuesday, May 21, from 2:15 PM to 3:00 PM PDT. Learn how to unify ready-to-code development environments with best-in-class dev tools to deliver an unparalleled coding experience for building intelligent applications and more. Give developers the flexibility to use the tools they want within IT guardrails and enable self-service by integrating Microsoft Dev Box with top-tier developer tools like Visual Studio and GitHub Copilot. Plus, streamline test environment provisioning with Azure Deployment Environments.
  • Demystify Cloud-Native Development with .NET Aspire: Damian Edwards and David Fowler will introduce you to .NET Aspire on Wednesday, May 22, from 1:00 PM to 1:45 PM PDT, focusing on tools and components for building intelligent cloud services. Explore the groundbreaking .NET Aspire technology stack designed for cloud-native development. We’ll explore the Orchestration, Components, Tooling and more. We’ll even show you how to integrate the Azure Open AI component to add intelligent functionality to your distributed services.
  • .NET Aspire Development on Any OS with the Visual Studio Family: Discover the flexibility of .NET Aspire with Wendy Breiding and Brady Gaster on Wednesday, May 22, from 2:15 PM to 3:00 PM PDT, including seamless Azure integration. Explore the core features of .NET Aspire and how it enhances the developer experience for building cloud-native applications. This session will demonstrate building .NET Aspire apps with Visual Studio and VS Code, so you can choose the best tool for your workflow. We’ll then cover Azure Developer CLI (AZD) integration and the “azd up” experience, showcasing how .NET Aspire and AZD work together to seamlessly move your locally-running app to the cloud!
  • What’s New in C# 13: Mads Torgersen and Dustin Campbell will reveal the latest features in C# 13 on Thursday, May 23, from 8:30 AM to 9:15 AM PDT. Join Mads and Dustin as they show off a long list of features and improvements coming in C# 13. This year brings long-awaited new features like extensions and field access in auto-properties, as well as a revamped approach to breaking changes to ensure cleaner language evolution in years to come. Additionally, we take collection expressions to the next level by facilitating dictionary creation and opening params to new collection types.
  • Infusing Your .NET Apps with AI: Practical Tools and Techniques: Join Vin Kamat, Luis Quintanilla, and Stephen Toub on Thursday, May 23, from 11:00 AM to 11:45 AM PDT. Learn how to incorporate AI into your .NET applications using tools, libraries, and best practices. This session will demonstrate practical examples of leveraging Azure AI services and the .NET AI ecosystem to create “intelligent apps.” Ideal for developers looking to enhance their apps with advanced AI capabilities.
  • Diagnostic Techniques for .NET Running on Linux and Within Containers: Join Mark Downie and Sam Spencer for a pre-recorded session available on Monday, May 21, from 8:30 AM PDT. Learn the essential tips and tricks for diagnosing .NET applications running on Linux and within container environments such as Kubernetes. From local diagnostics in WSL to debug sidecars, this session will unveil how .NET has tools designed to help you tackle the trickiest diagnostic challenges. Discover diagnostic techniques that enhance your ability to maintain robust, efficient applications across diverse environments.

Profile picture of Scott Hanselman

For Hanselman Fans

  • Scott and Mark Learn AI: Join Scott Hanselman and Mark Russinovich on Wednesday, May 22, from 3:30 PM to 4:15 PM PDT. Learn how to use AI tools to make smarter apps on Windows. You will learn how to use AI in your app, consume models both local and in the cloud, and how to use LLMs to make your apps even more awesome for users. They may even clean up Scott’s messy desktop that has been bothering Mark for some time now.
  • “Highly Technical Talk” with Hanselman and Toub: Don’t miss Scott Hanselman and Stephen Toub for a 100% LIVE demo session on Thursday, May 23, from 12:30 PM to 1:15 PM PDT. With zero slides and just code, they’ll dive deep into the internals of .NET, tackling performance issues and optimizations live on stage. This session is perfect for advanced developers looking to level up their debugging and performance skills using Microsoft’s own tools.
  • Level Up Your Dev Box, How Devs at Microsoft are Productive on Windows: Join Scott Hanselman, Vicky Harp, and Maddy Montaquila on Wednesday, May 22, from 6:00 PM to 6:45 PM PDT. Discover how Microsoft developers enhance their productivity through custom setups and tools. This session will showcase a variety of tips, including using aliases, the best VS Code extensions, customizing the Windows Terminal, and efficient ways to set up new computers. Learn valuable shortcuts, apps, and systems to optimize your development workflow.

In-Person Only Demos – These demos are available only in Seattle and will not be recorded.

For those of you joining us in Seattle, you’ll want to catch these live demos in the Demo Theaters on Level 5.

  • Tips & Tricks for Visual Studio and GitHub: Join Harshada Hole and Jessie Houghton for an exclusive demo session on Tuesday, May 21, from 4:45 PM to 5:00 PM PDT. Discover how to unlock the full potential of Visual Studio with expert tips and tricks. Learn to enhance your workflow by integrating powerful community extensions for peak efficiency.
  • What’s New for Copilot in Visual Studio 17.10: Catch Rhea Patel on Thursday, May 23, from 9:00 AM to 9:15 AM PDT for a demo on enhancing your Copilot chat experience in Visual Studio. This session will showcase cutting-edge generative AI applications, including a new interaction model and context improvements in Copilot Chat. Note:
  • VisualStudio.Com – Unlocking Your Benefits & Diamond:  Jacqueline Widdis will show you the power of using My.VisualStudio.com to unlock free benefits for Visual Studio developers on Wednesday, May 22, from 5:45 PM to 6:00 PM PDT. Learn about all the benefits included in your Visual Studio Subscription through a demo-filled tour. Discover how to easily access Azure credits, software downloads, training resources, and support to maximize your development potential.
  • Customize Dev Box for You and Your Team: Join Dhruv Muttaraju and David Obando on Wednesday, May 22, from 3:30 PM to 3:45 PM PDT. Learn how to configure and deploy customized Dev Boxes, tailored to the specific needs of individual teams, at scale using config-as-code templates and leveraging package management.
  • Microsoft Dev Box for Accessibility: On Wednesday, May 22, from 5:00 PM to 5:15 PM PDT, explore how to build Dev Boxes that cater to accessibility needs. This session will introduce the new config-as-code customization starters that showcase all the accessibility options available, ensuring your Dev Box is as comfortable and familiar as your local environment.

Ready to join thousands of developers at Build 2024? Don’t miss out on these exciting sessions and more! Click the link below to register today and secure your spot to experience Build 2024 virtually, alongside a global community of developers. Embrace the opportunity to learn, connect, and grow at this incredible event!

Register for Build 2024 and Join Us Online for Free!

Follow Us at Microsoft Build on TikTok!

The Visual Studio TikTok team will be going Live! from Build. Check out @VisualStudio on TikTok

The post Get Ready for Visual Studio at Build 2024: Join Thousands Online! appeared first on Visual Studio Blog.

Improve your code quality with GitHub Copilot in Visual Studio

$
0
0

In our previous post, we discussed GitHub Copilot’s Slash Commands, which allow you to trigger specific actions within Visual Studio with simple text-based inputs. Now, let’s explore the /optimize command and its potential to improve code quality in Visual Studio.

Refactoring with /optimize

In a recent exploration by Bruno Capuano, we see the transformative capabilities of GitHub Copilot’s /optimize command. Bruno demonstrates its prowess by refactoring a code snippet, showcasing how simple text-based inputs can yield significant improvements in code structure and performance.

One of the prime examples showcased by Bruno involves the conversion of a traditional for loop utilizing numerical indices into a more readable and intuitive foreach loop. While foreach loops in .NET might seem more verbose, they often offer better readability, a crucial aspect in maintaining code quality and ease of understanding.

Here’s a glimpse of the original for loop snippet:

for (int i = 0; i < chatHistory.Count; i++)
{
    var message = chatHistory[i];
    var msg = new ChatMessage();
    msg.role = message.Role.ToString().ToLower();
    msg.content = message.Content;
    root.messages.Add(msg);
}

To provide context to Copilot, Bruno selects the entire loop. He then initiates the inline chat dialog by typing “Alt-/”.

GitHub Copilot Chat dialog showing selected code with instructions to enhance code quality using the /optimize command in Visual Studio's chat interface

To guide Copilot in refactoring the code, Bruno types a Slash ‘/’, which opens the previously discussed dialog. He chooses the Optimize command from the menu and sends the command to Copilot.

Copilot responds with several optimization suggestions:

  • The ChatMessage instance can be initialized during construction, enhancing efficiency.
  • A foreach loop is utilized.

The refactored code appears as follows:

foreach (var message in chatHistory)
{
    var msg = new ChatMessage
    {
        role = message.Role.ToString().ToLower(),
        content = message.Content
    };
    root.messages.Add(msg);
}

Learn from Copilot: Give it a Try!

The most effective way to comprehend a tool’s functionality is to use it firsthand. I find it fascinating to apply the /optimize command to my production projects. At times, the modifications are minor, affirming the quality of my original code. However, there are instances when Copilot suggests ingenious alterations, often introducing me to new syntaxes.

Validating the output of GitHub Copilot is also crucial to ensure it hasn’t introduced any errors or regressions. Unit tests can serve as a safety net for these changes, just as they do during the refactoring of any piece of code.

Additional Resources

We offer a wealth of resources to further your understanding of GitHub Copilot for Visual Studio. We encourage you to explore this collection, you can watch the full video here and regularly visit this blog for more content.

The post Improve your code quality with GitHub Copilot in Visual Studio appeared first on Visual Studio Blog.

Visual Studio 2022 17.10 and GitHub Copilot: Your Coding Partner for Faster and Smarter Development

$
0
0

Today, as we kick off the //BUILD 2024 conference, we’re thrilled to share the general availability of Visual Studio 2022 17.10! This release features a new, single GitHub Copilot extension, marking a significant leap forward in AI-assisted development by embedding the power of advanced AI directly into strategic parts of your Integrated Development Environment (IDE). 

With the integration of GitHub Copilot directly into Visual Studio, we’re offering you a coding partner with improved context, providing smart suggestions and code completions that help you stay focused and productive. While GitHub Copilot is implemented as an extension, it’s not acquired through the Visual Studio Marketplace or Extension Manager. Instead, it’s available directly from the Visual Studio installer as a recommended component—meaning it’s installed by default, though you can choose not to install it if preferred. We’ve updated the familiar features to use the latest AI models with the goal of keeping you in the creative flow for longer. To enable these AI experiences, activate your GitHub Copilot subscription today by signing in to GitHub and starting a free trial.

Today’s post will focus on GitHub Copilot, but over the next few weeks we will continue to provide additional details on the improvements in the 17.10 release, which includes the General Availability of .NET Aspire, further expanding Visual Studio’s capabilities into cloud-native application development. For a complete list of our latest enhancements check out the Release Notes. We invite you to try out Visual Studio 2022 17.10 GA and discover these new features and improvements for yourself.

Accelerating your coding experiences with GitHub Copilot

GitHub Copilot’s latest experience is integrated into Visual Studio and combines the features of GitHub Copilot’s code completion capabilities and GitHub Copilot Chat into one convenient package, eliminating the need to install two separate extensions.

Image Copilot Badge

This AI-driven inline companion understands your code, offering real-time suggestions and intelligent code completions. Additionally, GitHub Copilot chat presents the opportunity for a sustained, threaded conversation in which you build context and background for the problems you are investigating. It’s like having a coding partner that speeds up your development process, allowing you to focus on innovation rather than getting bogged down by the basics.

Onboarding developers to new teams and projects comes with the challenge of knowledge sharing, but when code commits are moving faster than documentation the most important source of truth becomes the code itself. GitHub Copilot Chat provides convenient slash commands and references to get better answers that are scoped to your specific solution and projects.

In the following example we ask GitHub Copilot to explain (/explain) a method from a specific class by including a reference to the class file using the # symbol:

/explain the AddItemToBasket method in #file:BasketService.cs 

Or in this example we ask it to fix a problem in a method:

/fix the HashThisData method in #file:StringExtentions.cs

Slash commands allow you to quickly set the intent for many common development tasks (e.g. /doc, /explain, /fix, /optimize, /generate, etc.). While references allow you to be more specific about the information you want GitHub Copilot to consider when answering your question (e.g. #solution, #locals, #file.cs, etc.).

Debugging faster

With GitHub Copilot debugging and validating code in Visual Studio becomes a less daunting task. For example, one of the most common bugs developers are forced to investigate comes from exceptions. Now when an error is caught the AI-powered Exception Helper can assist you through the troubleshooting process. The Exception Helper uses a combination of the exception type and call stacks to help form a context rich question from diagnostics data available to Visual Studio’s best in class debugger.

We are also supporting rubber ducking techniques where we invite you to articulate the problem in your natural written language while the debugger is paused. By including the local’s reference (#locals) you can ask direct questions about the state of a variable. For example, I might ask:

Why is the value of InterestRate NaN? #locals

Our newest set of debugging features include a deadlock detection helper that identifies blocking states in your running application, and more importantly, it can also suggest solutions for the underlying code. We have also integrated GitHub Copilot into our breakpoint workflows, allowing you to easily define your break point conditions, giving you the opportunity to strategically pause the debugger at key moments of an investigation.

Scaffold tests and summarize code commits

GitHub Copilot can also assist you in both the generation and resolution of unit tests, helping teams conserve code coverage and health. While scaffolding these kinds of tests is necessary work, it can also be a time consuming and repetitive task. In this example we create a set of tests for a selected class:

/tests #file:StringExtentions.cs

The outcome of GitHub Copilot assistance is a more productive development process, where time spent on crafting unit tests and error resolution is minimized, and code quality is consistently high.

We know that you can grow frustrated with the time you spend maintaining a healthy code base. It can be hard to recall and condense the hours of design and development into notes and documentation that communicate the appropriate intent to your team. GitHub Copilot enables smart PR and commit suggestions, it’s easier than ever to maintain clarity and consistency across your developer projects.

We found that 80% of developers find the generated PR description suggestion helpful enough to use. In all, GitHub Copilot helps developers complete their code faster, reduce their mental effort, while allowing them to focus on more enjoyable work.

As we wrap up our exploration of Visual Studio’s latest enhancements with GitHub Copilot, it’s clear that this integration creates an important opportunity to help you achieve more. Whether you’re a seasoned developer or just starting out, the latest updates to Visual Studio are designed to help you be more productive. We invite you to download the latest version of Visual Studio, activate your GitHub Copilot subscription today and start a free trial to enjoy the latest AI experiences.

Share your feedback and stay connected with Visual Studio!

We appreciate the time you’ve spent reporting issues and submitting suggestions and hope you continue to give us feedback when using Visual Studio on what you like and what we can improve. Your feedback is critical to help us make Visual Studio the best tool it can be! You can share feedback with us via Developer Community: report any bugs or issues via report a problem and share your suggestions for new features or improvements to existing ones.

Stay connected with the Visual Studio team by following us on YouTube, Twitter, LinkedIn, Twitch and on Microsoft Learn.

On behalf of the entire Visual Studio team, thanks for reading and Happy Coding!


The post Visual Studio 2022 17.10 and GitHub Copilot: Your Coding Partner for Faster and Smarter Development appeared first on Visual Studio Blog.

Maximizing joy and minimizing toil with great developer experiences

$
0
0

The future always starts with developers. They determine the speed of innovation, and never has that been more true than today, in the era of Generative AI. We’re already seeing GenAI have a profound impact on the way that we build applications and collaborate with our colleagues. More developers will be empowered to create with technology by having access to a coach to guide you through each stage of your learning journey. And user expectations are evolving quickly so that today’s end-users expect their apps already know about their context and history, and even anticipate their next step.

There’s a lot of change on the horizon! But it can be hard to find the time to learn when we’re overwhelmed and bogged down with technical debt. Developers continually have to context switch between tools, which impacts their cognitive load and ability to focus. We know that even on a good day, developers only spend about 2 hours a day coding, and it takes them 23 minutes to regain focus after context switching. This, combined with randomizing meetings to assemble resources you need can make you feel exhausted at the end of the day and frustrated by inefficiencies. All this can take the joy out of work and make developing software feel like toil.

But we know there’s a path to developer happiness—where devs can focus more on coding and less on ops; where they can innovate at the speed of their creativity; and where they can get going fast, without having to worry about managing the infrastructure their apps depend upon.

Dev happiness = staying in the flow

One of our guiding principles is to bring the best tools to you where you live—in your code editing tools—so you can stay in the flow! At Build this week we’re announcing some pretty amazing developer experiences to bring more joy and less toil to your life as a developer.

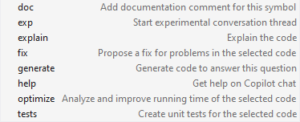
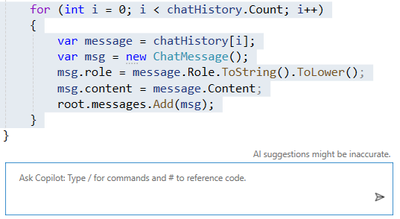
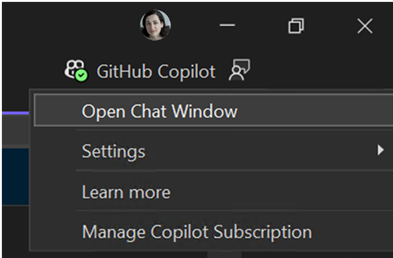
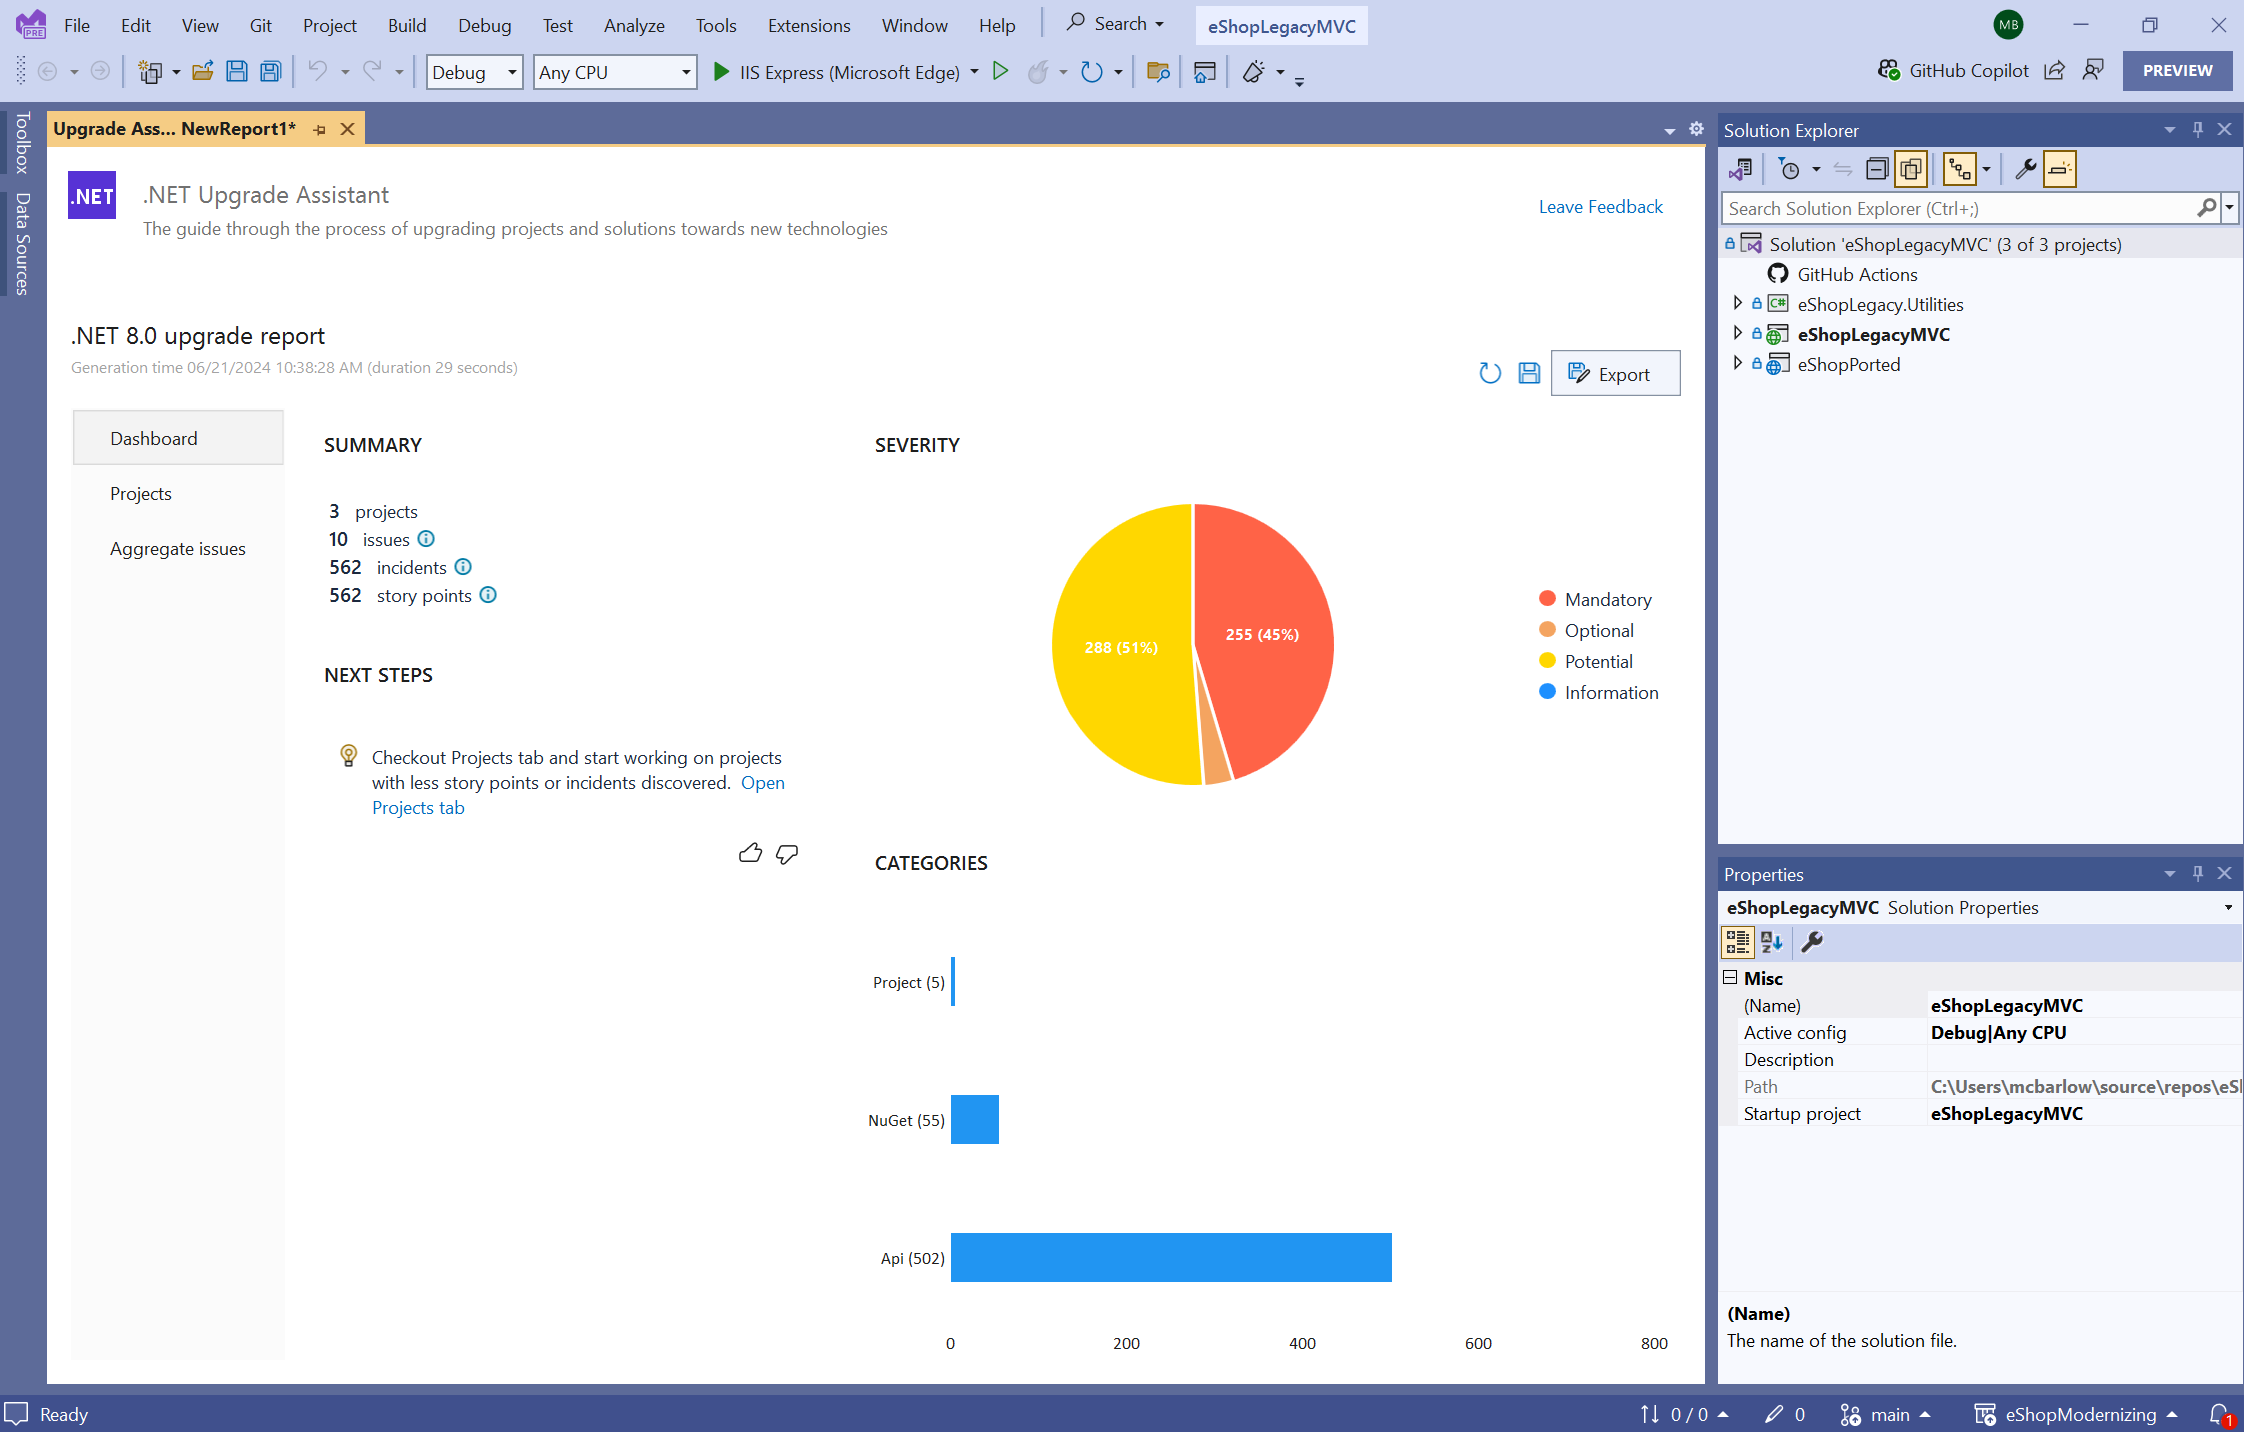
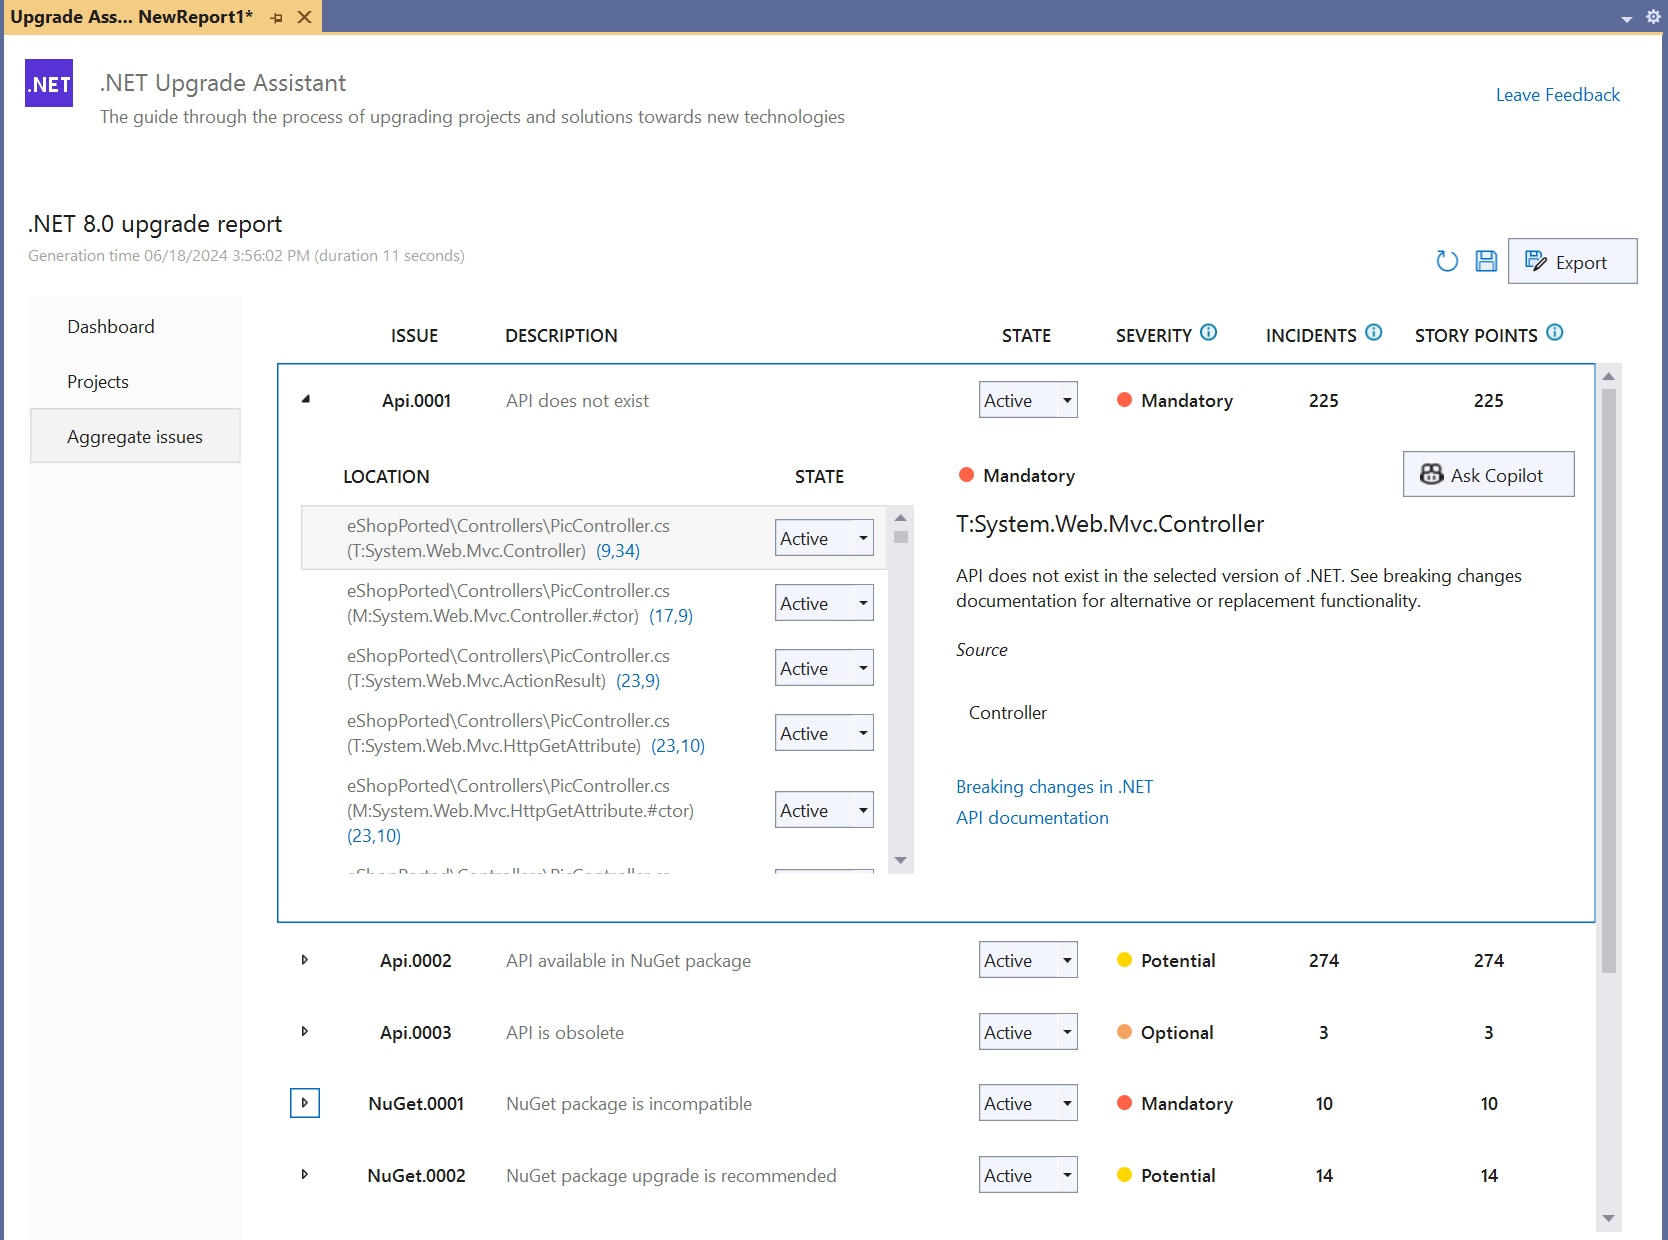
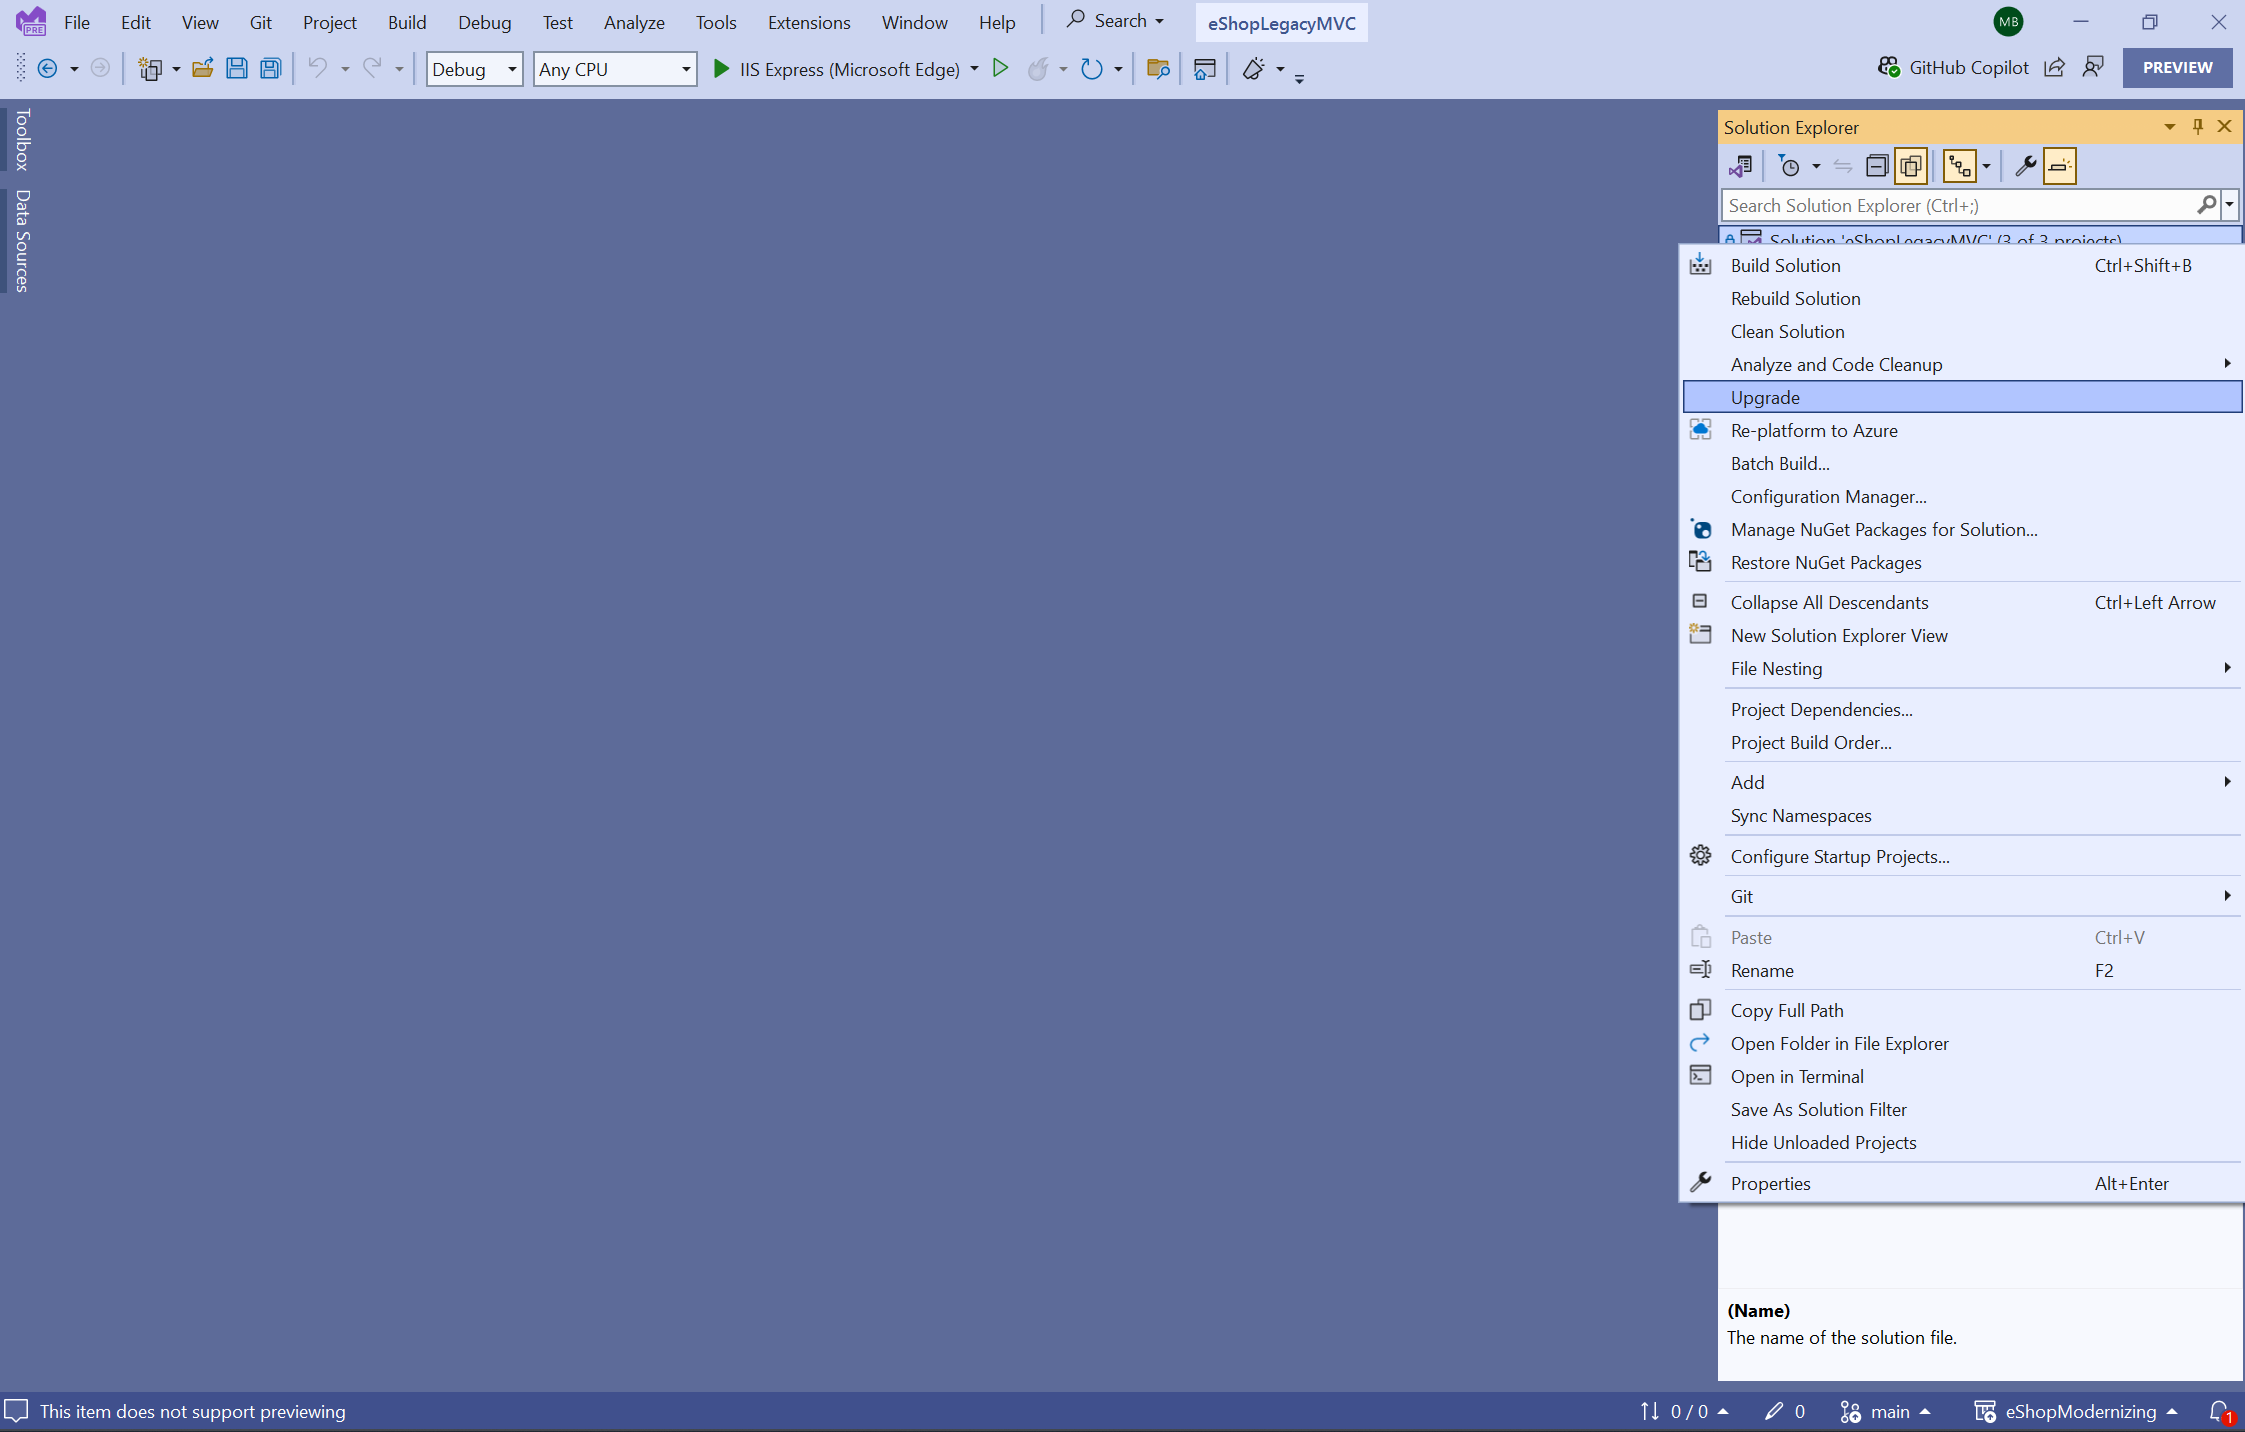
For starters, we’re announcing the general availability of Visual Studio 17.10. In this version. We’ve plugged GitHub Copilot everywhere throughout the IDE, so it changes how you write, learn, test, search, and fix code in your apps.

Image Copilot in the IDE

We’re also announcing the preview of GitHub Copilot for Azure, an extension that integrates seamlessly with GitHub Copilot chat in Visual Studio Code and Visual Studio, bringing Azure expertise right to your fingertips! Using GitHub Copilot for Azure, you can learn about Azure resources and best practices; explore and manage Azure resources; and troubleshoot issues and locate relevant logs and code. GitHub Copilot for Azure is built atop a general extensibility surface area we’ve introduced into GitHub Copilot. Soon you won’t have to context switch as all your favorite tools will be integrated into your code! More on that in a bit…

.NET Aspire is now generally available

.NET Aspire codifies the best practices for cloud-native development with tools for multi-project management, built-in HTTP resiliency, health checks, OpenTelemetry, and easy multi-node deployment via Visual Studio, VS Code, and the Azure Developer CLI. .NET Aspire makes it easy to get started with templates and a set of curated components based on our opinionated stack inside Microsoft and co-developed with the .NET community.

Using .NET Aspire, it’s easy to build and debug using service discovery and a completely new developer dashboard to see real-time telemetry and metrics, and to get a foothold on diagnosing issues. You can run and deploy with a single command to launch and run multiple services. Being able to express app topology in C# makes cloud deployment easy to any cloud destination.

Lots of great innovations to bring the best of all your tools into where you live—your favorite code editor tools—so you can stay in the flow!

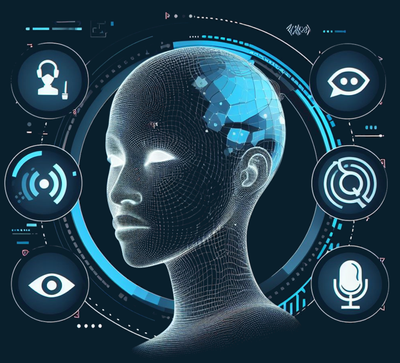
Building intelligent apps

Over the past year we’ve witnessed the birth of one of the most pivotal technological innovations in history: Generative AI (GenAI). It has changed user expectations for every experience and continues to shape how businesses think of technology as an enabler for rapid growth.

We refer to any app that uses artificial intelligence for all or some of its functionality as an “intelligent app.” The way intelligent apps change experiences and operations are what can become competitive differentiators. It starts by thinking about the use cases where your data can provide actionable insights that can improve your processes or your customer experience. This is a massive paradigm shift—it’s changing user expectations for how we all interact with technology. Natural language is the new user interface; we simply talk to it. I can ask it questions and it already has the context of my account or my history and it can even anticipate my needs. And these apps continually improve by learning while in production. What that means is that the traditional developer inner and outer loop also evolves to facilitate the evaluation cycle and continuous learning once deployed to production.

Whether you’re using a foundational model like GPT3, Phi-3, building your own custom machine learning, or augmenting an existing model with fine-tuning, these apps go beyond an algorithm recommending content based on what you click, tap, listen to, or watch. Intelligent apps learn from the user’s inputs and data to continually get better over time, while observing responsible AI best-practices.

For our developer tools and application building blocks, our goals are to…

  • Make building GenAI apps more approachable
  • Reduce the effort required to build, manage, and evolve GenAI apps
  • Support the end-to-end app development lifecycle, including the new tasks necessary to build intelligent apps — like evaluating models and prompts and preparing data
  • All while maintaining enterprise-grade security, scalability, compliance, and governance according to our DevOps and platform engineering best practices

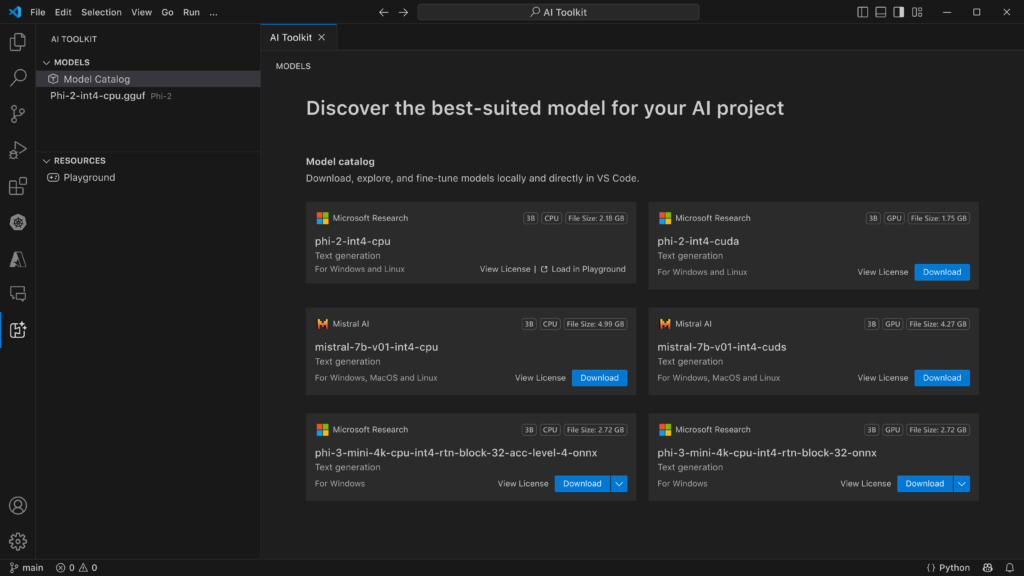
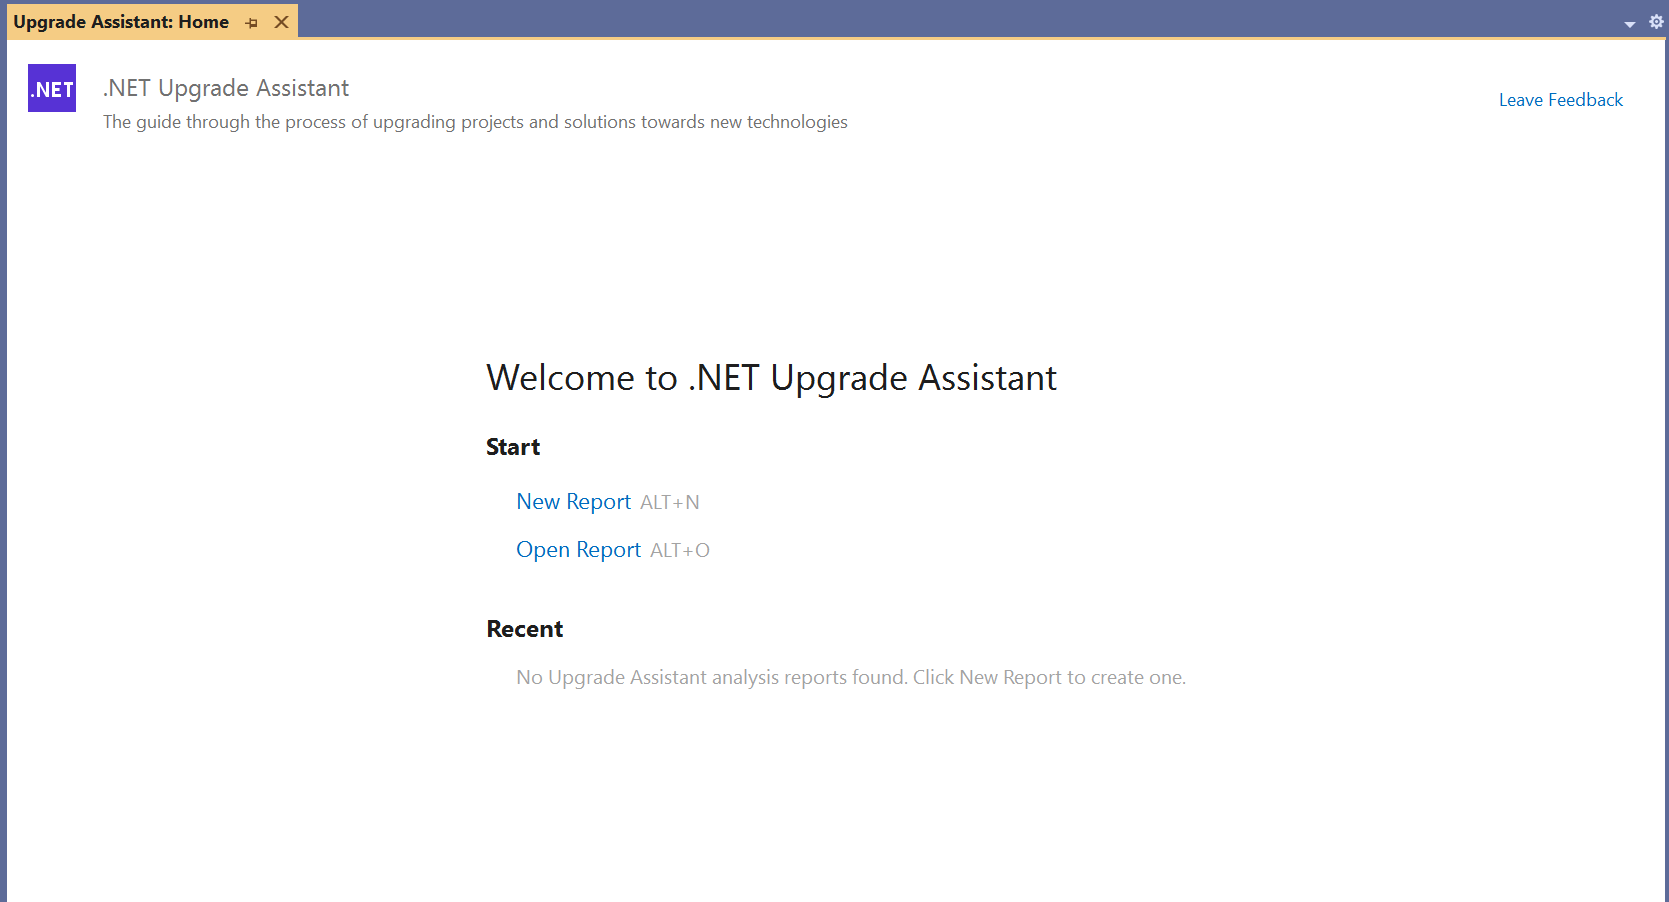
Today, we’re announcing the AI Toolkit for Visual Studio Code. This toolkit helps AI engineers develop and deploy intelligent apps by enabling them to explore, acquire, evaluate, and integrate small and large language models within VS Code. You can use your local hardware to try, run, and evaluate state-of-the art small language models—or SLMs—like Phi-3. It takes advantage of the deep investments we’ve made in the ML stack on Windows to provide a turnkey experience to run any model seamlessly on your laptop, Dev Box, or Azure AI compute. While it runs best on Windows today, MacOS support is coming soon!

Image Model catalog

Intelligent apps: Better on Azure

In addition to providing a platform to host your apps, the Azure App Platform provides the essential building blocks you need to accomplish the different tasks that you typically do to build and operate a GenAI application, including leveraging Azure OpenAI and hosted models in your apps; building enhanced copilots; experimenting and optimizing; and hosting custom models and fine tuning them with your data.

All the capabilities are integrated with one another, and you can use them together seamlessly. For example, you can incorporate experimentation and use Vector DB add-ons for your GenAI apps running on any of our App Platform services.

Here are just a few of the ways that Azure is evolving for the era of AI:

  • When you start growing your application portfolio, you will likely want to track token usage across multiple applications, or to make sure that a single app doesn’t consume the whole TPM quota. Azure API Management has introduced new capabilities to enhance the scalability and security of Generative AI deployments. These include the Azure OpenAI token limit policy for fair usage and optimized resource allocation, one-click import of Azure OpenAI endpoints as APIs, a load balancer for efficient traffic distribution, and a circuit breaker to protect backend services.
  • API sprawl poses significant challenges in API governance, security, compliance, and reuse. Without a centralized inventory, APIs can become isolated, leading to poor API reuse, lack of alignment with organizational API design and organizational processes, as well as increased vulnerability to security breaches. And most GenAI apps consume LLMs via APIs – so the era of GenAI is the era of API-first development. The Azure API Center provides centralized API inventory for seamless discovery, reuse, and governance regardless of API type, lifecycle stage, or deployment location.
  • Azure Container Apps now include secure sandboxes at scale: When you build applications that run code or commands from untrusted sources, you have to ensure that the code runs in its own isolated environment. If an LLM is generating the code you need to evaluate, what is the best way to execute that code? Dynamic sessions provide secure, ephemeral sandboxes called “sessions” for running potentially malicious code. Each session runs in its own Hyper-V virtualization boundary — ensuring complete isolation from other sessions and resources.

You can read about all these Azure announcements and more in the Build Book of News.

Developer productivity comes from team agility

So, we’ve covered new tools and experiences that help you stay in the flow and get into building intelligent applications. Now let’s talk about how the practice of platform engineering can help organizations stay secure and compliant and developers focus on their code.

Developers want to be able to self-serve environments, workflows, and infrastructure with the confidence they’re adhering to the best practices and requirements of their organization. It’s just one more aspect of staying in the flow.

Last November we launched our guidance on platform engineering. On a very basic level, platform engineering is a set of patterns and practices helping to modernize enterprise software delivery. These patterns and practices, if executed right, can become the glue between development and operations teams—creating more cohesion and flow amongst teams throughout the product-making lifecycle.

At its best, Platform Engineering empowers teams to achieve scale and reduce the time it takes to deliver business value—all while eliminating toil, promoting self-sufficiency, and reducing the cognitive load required to meet broader operational and organizational standards.

With policy enforcement, security monitoring, and observability, organizations can govern their app estate to get better cost control and reduce risk while delivering a great developer experience.

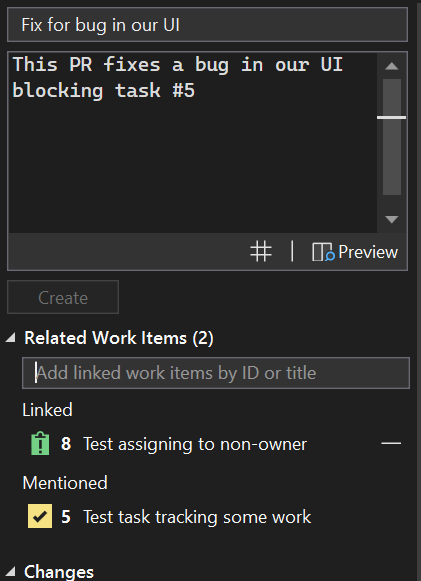
And GitHub Copilot is now the perfect platform to deliver an unparalleled developer experience for platform engineering. With the new extensibility capabilities, GitHub Copilot can be augmented and grounded with your product catalog that you define in GitHub repos with Templates, Workflows, APIs, and samples that provide start-right automation and policy enforcement to your developers who can discover and deploy them with natural language user interfaces in Copilot Chat.

New features in Microsoft Dev Box and Azure Deployment Environments

Microsoft Dev Box, an Azure service that gives developers self-service access to preconfigured, project-specific developer workstations, has been a key part of our approach to platform engineering. Used by companies like GM and Siemens Healthineers China (and by over 25k Microsoft developers), Dev Boxes reduce environment setup from days to minutes, encouraging collaboration and experimentation. With pre-installed tools and source code, developers can onboard and start coding quickly.

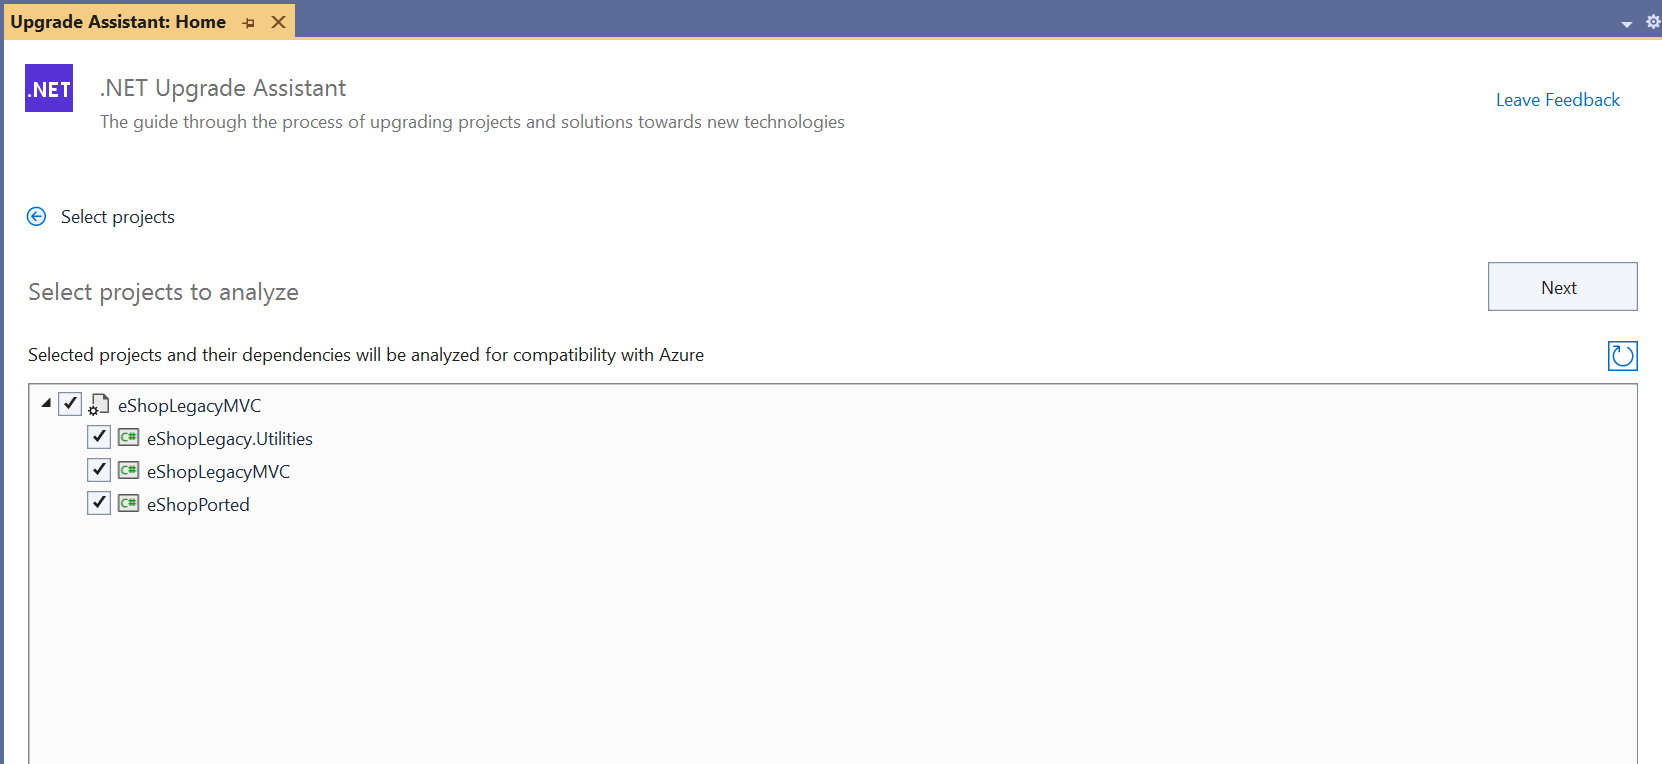
For development teams, we’ve recently added standardized templates with project-level catalogs specific to each project. We also have a new Dev Box imaging service where teams can create and maintain custom image using config-as-code to make sure their entire team has a consistent environment.

Image Microsoft developer portal

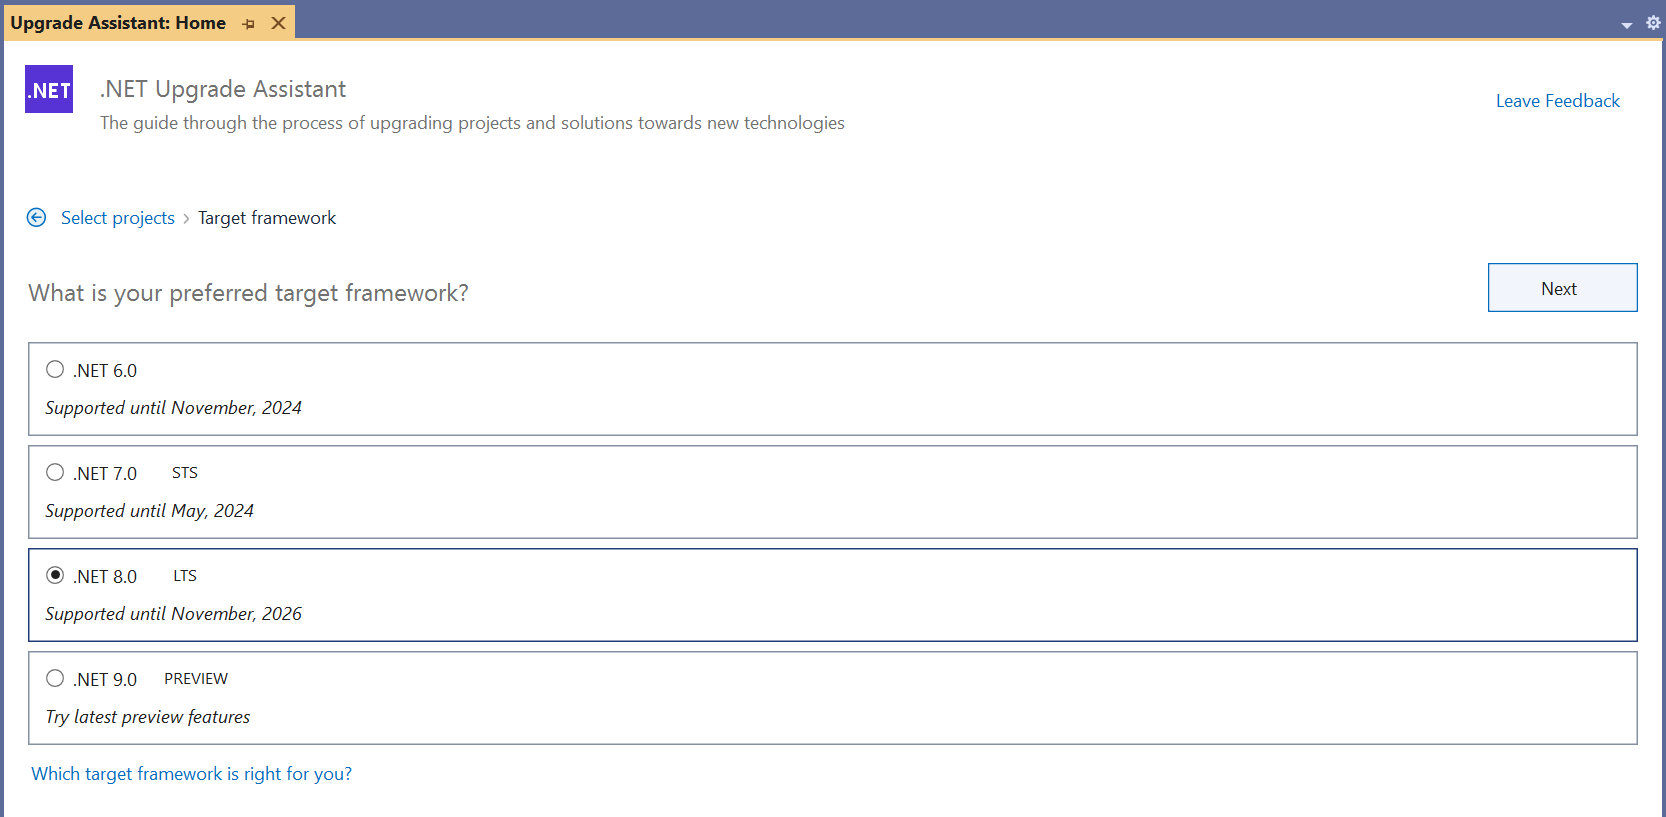
And Azure Deployment Environments now delivers more seamless experiences to customers, enabling them to leverage popular Infrastructure-as-Code (IaC) frameworks quickly and easily with its new extensibility model and to perform or customize deployments based on their organizational needs.

Image Microsoft developer portal 8211 deployment

These capabilities give development teams more control to customize environment templates for their team-specific needs and provide platform engineers with additional ways to build templates in their preferred IaC format.

But consistent environments across teams doesn’t mean that the experience can’t be personalized to developers.

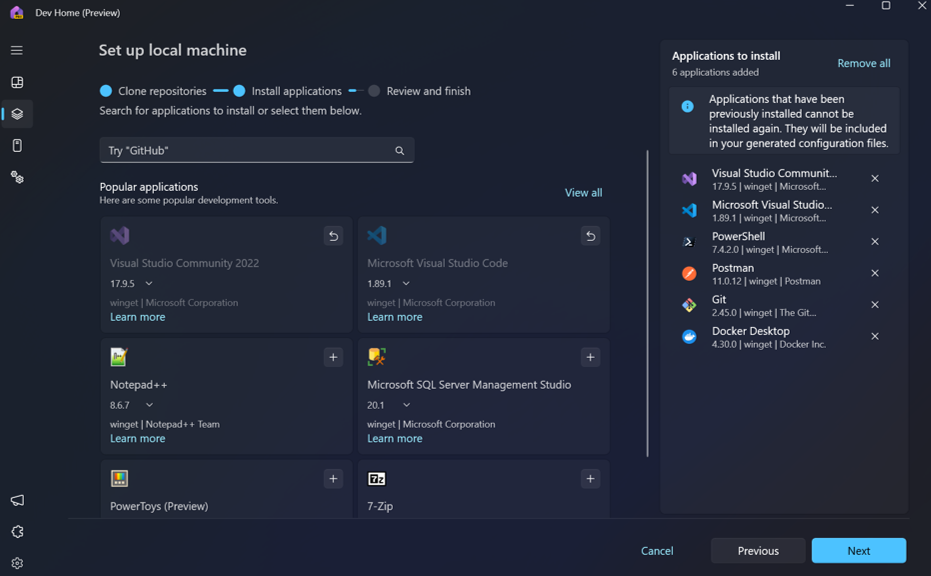
The new Dev Home capabilities in Windows make it easy to create a personalized, consistent environment that works beautifully with Microsoft Dev Box. It’s simple to create, connect, and customize Dev Boxes, pin frequently used Dev Boxes to your taskbar or start menu, and add tools onto your config or the one you’re building for the team.

Image Dev Home 3

Close

Our mission is to empower developers to achieve more. Our vision is to enable them to set up a complete engineering system in seconds, contribute from any device, build for any platform, collaborate with anybody, and scale with confidence. In the era of AI, developers and their teams can get into the zone, learn about new technology more quickly than ever before, explore what’s possible at the speed of their creativity, and share their expertise to accelerate the impact of their entire team.


The post Maximizing joy and minimizing toil with great developer experiences appeared first on Visual Studio Blog.

First preview of Visual Studio 2022 v17.11

$
0
0

We are excited to announce the release of Visual Studio 2022 v17.11 Preview 1, the first preview of our next update for Visual Studio 2022. This preview focuses on quality-of-life improvements for all developers and workloads. See the release notes for full list of features.

Visual Studio 2022

When you use Visual Studio, you want to feel empowered and productive. That’s why quality-of-life features are so important: they make coding a smooth and enjoyable experience, free of unnecessary hassles and headaches.

You’ll also find hundreds of user-reported bugs and issues fixed and lots of tweaks to existing features. All of it to make you more productive and the Visual Studio developer experience the best one yet.

We hope you enjoy this preview of Visual Studio, and we look forward to hearing what you think. You can share feedback with us via Developer Community, by reporting issues via report a problem and share your suggestions for new features or improvements to existing ones.

You can download the preview from our website or update it from within the IDE. Please note that you should not use this preview in production environments, and some extensions or workloads may not be compatible with it.

For more details on what’s new in this preview, please check out our release notes. Thank you for using Visual Studio and happy coding!

The post First preview of Visual Studio 2022 v17.11 appeared first on Visual Studio Blog.

Developing cloud native apps with Aspire

$
0
0

We’re excited to introduce the general availability of .NET Aspire, a comprehensive stack aimed at simplifying the way .NET cloud-native apps are built and managed. .NET Aspire offers developers like you an improved, opinionated framework for constructing distributed applications, ensuring a seamless and consistent development experience.

This new stack brings together a collection of tools, patterns, and special NuGet packages known as .NET Aspire Components designed specifically for the orchestration, component integration, and tooling required in modern cloud-native development. Whether you are on day-zero or well into your cloud native journey, Visual Studio provides the most natural way to deliver projects to Azure.

If you’re a distributed application developer .NET Aspire brings something you’ve always wanted: –

  • The ability to select F5 and have all the dependencies start up or be provisioned.
  • Your projects are automatically configured between significant, distributed changes in the app.
  • Deployment of these multi-node apps into a live development or test environment are a one-click gesture.
  • .NET Aspire’s built-in service discovery capabilities enable your front-end apps to find your back-end APIs with less friction and almost zero configuration.

Getting started with .NET Aspire

Download the latest Visual Studio build today to get started. If you don’t already have .NET Aspire installed, open the Visual Studio Installer, select Modify, and choose the ASP.NET and web development workload, and then select .NET Aspire SDK. Alternatively, you can run dotnet workload install aspire from a command line. Then, you’ll start to see new .NET Aspire project templates in Visual Studio and at the .NET CLI. Once you see the templates, try creating your first cloud-native .NET Aspire app by selecting the .NET Aspire Starter Application template.

Image 17 10 aspire create new project

If you’ve ever had to build a front-end app that accessed a REST API back end and needed caching to enhance the app’s performance, you’ll recognize the topology of the app right away. Once you select F5 to start the debugger, the familiarity will end and the excitement will start – without needing to configure anything in your project or set startup order, the whole application will start up.

Image 17 10 aspire dashboard

The .NET Aspire Dashboard opens and from there you’ll have access to deep telemetry, metrics, and distributed traces where you can see how the entire app is working end-to-end.

Image 17 10 aspire dashboard traces

Deploying to Azure Container Apps

If you’re an Azure customer, you’ll be happy to know we’ve applied this same sort of one-click joy to our publishing experience, too. From within Visual Studio, you can right-click-publish an entire multi-node app to Azure Container Apps in one click. With “whole-app provision-and-publish” capabilities provided by the Azure Developer CLI (azd), from right within Visual Studio you can create new development environments in Azure Container Apps with one click.

Image 17 10 aspire publish to aca

This makes it easier than ever to spin up – and down – whole new copies of your application in isolated environments in your Azure subscription. Within minutes, your projects – and the dependencies they require to run – are all deployed successfully to Azure Container Apps.

Image 17 10 aspire deployment succeeded

We’re happy to announce the general availability of .NET Aspire, which extends Visual Studio’s capabilities for cloud-native application development. .NET Aspire provides a framework and tools that have an opinionated approach, making distributed .NET applications easier to build, deploy, and manage. This integration aims to make the development of cloud-native apps more straightforward and productive.

We are hearing great things from our .NET Aspire customers! They appreciate how Aspire simplifies deployment and refactoring, and how it provides a rich telemetry dashboard that gives them valuable insights in any environment. With the help of .NET Aspire, developers are improving their workflow, spending more time on innovation and less time on the complexities of operations.

We appreciate the time you’ve spent reporting issues/suggestions and hope you continue to give us feedback when using Visual Studio on what you like and what we can improve. Your feedback is critical to help us make Visual Studio the best tool it can be! You can share feedback with us via Developer Community: report any bugs or issues via report a problem and share your suggestions for new features or improvements to existing ones.  

Stay connected with the Visual Studio team by following us on YouTube, Twitter, LinkedIn, Twitch and on Microsoft Learn

The post Developing cloud native apps with Aspire appeared first on Visual Studio Blog.


VisualStudio.Extensibility 17.10: Debug your extensions with the Diagnostics Explorer

$
0
0

Imagine creating extensions that run faster and smoother than ever before! If you haven’t been following along lately, we’ve been working on improving the VisualStudio.Extensibility SDK. VisualStudio.Extensibility helps you build extensions that run outside the main IDE process for improved performance and reliability. With it comes a sleek and intuitive .NET 8-based API and comprehensive, well-maintained documentation to help you develop awesome extensions.

This 17.10 release builds on our previous releases, and it brings with it a brand-new debugging experience to make it easier for you to get your extensions running just the way you’d expect. We’ve also enhanced our remote UI features, added a new way to prompt users, and continued to add features to our project query API.

Please visit https://aka.ms/VisualStudio.Extensibility for the latest up-to-date docs and installation instructions. We encourage you to report bugs and suggest features via the issue tracker on our GitHub repo, where you can also find extension samples to help you get started.


What’s new for VisualStudio.Extensibility?

Do you want to develop and debug your extensions more quickly and more easily than before? Our 17.10 release adds the following features to help you do just that:


Debug your extension using our new Diagnostics Explorer

We’ve created a powerful new tool for debugging your extensions called the VisualStudio.Extensibility Diagnostics Explorer, available here in the Visual Studio Marketplace. With it, you’ll be able to see extensions the way that Visual Studio sees them to help ensure that you’ve configured yours correctly.

This tool, which itself was written as an in-process VisualStudio.Extensibility extension, can help you answer questions like “why isn’t my command showing up where I expect it to be in the IDE?” or “why isn’t my extension being activated when I expect it to be?”

Inspect configuration

VisualStudio.Extensibility has already made it easier for you to configure your extensions by eliminating the need for you to manually maintain separate metadata files. Now, we’re building on that with the Diagnostics Explorer, which lets you see exactly which extensions and components were discovered by Visual Studio, along with the configuration of each discovered item.

For example, if you weren’t seeing your command in the IDE, you could use the Command tab Diagnostics Explorer to view any commands that have been contributed to Visual Studio. If it’s not present in the list, that’s a hint to double check your configuration to make sure it gets discovered. If it’s present, but not enabled or visible, you may want to check your activation constraints. And if it’s marked as enabled and visible, you could use the dropdown menu to view command placements to make sure you’ve placed it correctly.

A screenshot of the Commands tab of the VisualStudio.Extensibility Diagnostics Explorer. It shows one command associated with the ToolWindowSampleExtension, along with the metadata for that command.

Using the Commands tab, you can inspect commands, command sets, groups, menus and toolbars, command placements, and dynamic command anchors. Other tabs let you inspect components for other feature areas including tool windows, document types, text views, and more. As we add features in future releases, you’ll be able to inspect any new components alongside these in the Diagnostics Explorer.

View live event log

We know that extension developers like you sometimes develop extensions that may need to handle events throughout the IDE, such as a command being executed, a tool window being opened, or a TextView being created, so we’ve added a live event viewer to enable you to observe these events and their properties in real time:

A screenshot of the Events tab of the VisualStudio.Extensibility Diagnostics Explorer, which shows several events related to executing a command and hiding/showing tool windows.

Create better activation constraints

The Activation Constraints tab in the Diagnostics Explorer gives you the current state for each of the values available to you when creating an activation constraint. Using this tab, you can get the IDE into the state that you want to use for your activation (such as building a project or opening a markdown file), and then you can inspect the values for each of the available expressions to help you create your constraint.

A screenshot of the Activation Constraints tab of the VisualStudio.Extensibility Diagnostics Explorer, which shows current information about the state of the IDE.

For example, suppose you wanted a command to be visible only if there’s a C# file open in the editor. With the Diagnostics Explorer, you could open a C# file and use the Activation Constraints tab to help you to determine which of the expressions you’ll need to craft your constraint:

EnabledWhen = ActivationConstraint.ClientContext(ClientContextKey.Shell.ActiveEditorContentType, "CSharp").


Leverage XAML Resources in your UI

XAML resources accelerate your UI development by letting you define objects like colors, brushes, or styles that you can leverage throughout your project. With this release of VisualStudio.Extensibility, we’re adding support for XAML resources to help you develop great UIs for your extensions!

Consistent with our other remote UI features such as UI controls, you’ll define any XAML files with ResourceDictionaries as embedded resources in your .csproj file:

<ItemGroup>
    <EmbeddedResource Include="\XamlResources.*xaml" />
    <Page Remove="XamlResources.*xaml" />
</ItemGroup>

Once defined, it’s easy to include your resources in other components so that they can be referenced in your XAML throughout your project:

ResourceDictionaries.AddEmbeddedResource("XamlResources.xaml")

You can even localize your resources: see the Modal Dialog sample for more information and let us know what you think!


Let your extension users pick files or directories

Building on our previous support for user prompts and custom dialogs, we’ve added the ability to display file and directory picker prompts from your extensions. For example, you can use the ShowOpenFileDialogAsync() method to prompt users to select a single file to open:

VisualStudioExtensibility.Shell().ShowOpenFileDialogAsync(options, cancellationToken);

Using the new APIs, you can prompt users to:

  • Select a single file to open
  • Select one or more files to open
  • Select a single file to Save As
  • Select a directory to open

As always, if there are other types of user prompts that are important for your extensions, please let us know through our Issues Tracker.


Track project changes with an improved query API

Our 17.10 release adds three new features to the project query API.

Track changes to query results

The TrackUpdatesAsync() method can be used in your project system queries to create an IObserver object to track changes to the state of the projects or solutions in your query. For example, if you want to track when updates made to the files in a project, you could use:

var query = await myProject
    .Files
    .With(f => f.FileName)
    .TrackUpdatesAsync(new TrackerObserver(), CancellationToken.None);

In this example, the TrackerObserver implements IObserver<IQueryTrackUpdates<IFileSnapshot>>, so you can use your own custom logic to handle the update events.

Query project rules

Each project in the project query API now contains a RulesResults attribute, which includes a rule name and a list of items. You can access these rules by calling RuleResultsByName() for a given configuration.

var results = await querySpace
    .Projects
    .With(p => p.Path)
    .With(p => p.ActiveConfigurations
        .With(c => c.RuleResultsByRuleName("CompilerCommandLineArgs")
            .With(r => r.RuleName)
            .With(r => r.Items
                .With(i => i.Name))))
        .ExecuteQueryAsync();
Skip results in a query

We’ve added the Skip() method to enable you to skip results in your query.

var projects = await queryableSpace.Projects
    .With(proj => proj.Name)
    .Skip(1)
    .ExecuteQueryAsync();

Here, the first project is skipped, and the remaining projects are returned.


We can’t do this without you!

We need your help as we continue to develop VisualStudio.Extensibility! Please try out this preview release and let us know what you think. Check out the docs, browse the code samples, and build your first extension. You can send feedback, report issues, or request features through our issue tracker.

You can also find information about [breaking changes](https://github.com/microsoft/VSExtensibility/blob/main/docs/breaking_changes.md) and [known issues](https://github.com/microsoft/VSExtensibility/blob/main/docs/known_issues.md) at our VisualStudio.Extensibility [GitHub repo](https://github.com/microsoft/VSExtensibility).

We’re prioritizing the features that our extenders ask for, so please give VisualStudio.Extensibility a try and share your thoughts with us!

The post VisualStudio.Extensibility 17.10: Debug your extensions with the Diagnostics Explorer appeared first on Visual Studio Blog.

A modern Extension Manager has arrived with Visual Studio 17.10

$
0
0

We’re bringing our updated Extension Manager to all users! Over the last year, we’ve made our updated Extension Manager available as an optional preview feature and have been asking you to let us know what you think. Based on your incredible feedback, we’re now ready to offer the new Extension Manager as an on-by-default preview feature starting with Visual Studio 17.10. We’ve streamlined the essential features into a modern UI to help you discover great new extensions and manage your installed extensions.

With this release, we still want to hear from you! As you use the Extension Manager in this last preview phase, please share your thoughts so we can bring you the best possible experience in our upcoming official release.


Meet the new Extension Manager

Gone are the days of leaving Visual Studio to find additional information on extensions! We created the new Extension Manager to spotlight the most important content when searching for extensions, including a large pane for viewing detailed descriptions.

A screenshot of the new Extension Manager in Visual Studio opened to the Browse tab.

The left sidebar has lets you choose between primary views:

  • Browse the Visual Studio Marketplace for new extensions
  • View and manage your Installed extensions
  • Discover and install any available Updates for your extensions
  • Install any extensions for which you have Roaming enabled

A screenshot of the primary toolbars in the new Extension Manager.


Filter your searches

You can click the filter icon to the right of the search box to show the category and subcategory menus, which you can use to filter the search results. For example, you can search for tools to help with documentation or for ASP.NET controls.

A screenshot of the category filter dropdown menus in the new Extension Manager.


Let us know what you think!

The new Extension Manager is available to all Visual Studio 17.10 users and is on-by-default.

If for any reason you want to return to the previous Extension Manager, you can disable the preview feature by navigating to Tools > Manage Preview Features and unchecking the box for the feature called Extension Manager UI Refresh. To reenable the new Extension Manager, check the box for the preview feature and restart Visual Studio.

As you use the new Extension Manager, please use this ticket on Developer Community to share your thoughts and feedback. We want to hear from you about anything that might be missing or that could be improved.

If you run into any bugs or issues, please report them so we can prioritize fixing them.

The post A modern Extension Manager has arrived with Visual Studio 17.10 appeared first on Visual Studio Blog.

Introducing the Revamped Visual Studio Resource Explorer

$
0
0

With the recent revamp of Visual Studio’s Resource Explorer, developers are in for a treat! We’re thrilled to unveil the reimagined Visual Studio Resource Explorer, and trust us, it’s a game-changer.

Developers who manage resources in Visual Studio will be delighted to learn that we have finally updated our out-of-the-box resource management experience to better accommodate the needs of the modern .NET developer. This update will make it easier and faster for developers to manage resources in their .NET applications. Here’s the lowdown:


The Pain Points We Crushed:

Let’s rewind. The old Resource Editor had its quirks – no search, no filters, and a data grid that felt like a maze. If you manage sprawling solutions with gazillions of resources, you know the struggle. And don’t get us started on the one-file-at-a-time limitation – a real buzzkill for multilingual apps. Plus, that window? Not zoom-able. Not theme-friendly. Not cool.

In the new Resource Explorer design, we have tackled these common issues and introduced several new features that will make your resource management workflows in Visual Studio much more productive. As you can see when we compare the two experiences, we’ve bridged the gaps in the old experience and sprinkled in delightful new features to boost your productivity. Get ready for a more modern and convenient resource management journey.


Feature Comparison:

Feature
NEW Resource Explorer
LEGACY Resource Editor
Grid View of Resources ✅ ✅
Add/edit/delete resources ✅ ✅
Search ✅ ❌
Single view for resources across solution ✅ ❌
Edit multiple resource files at once ✅ ❌
Edit multiple locales at once ✅ ❌
Dark mode and VS theme support ✅ ❌
string.Format pattern validation ✅ ❌
Warnings and validation of resource data ✅ ❌
Combined view for string and media resources ✅ ❌
Datagrid zoom-ability ✅ ❌


What’s new in the update?


Loading multiple files:

The cornerstone of this update is the ability to load multiple files and view all localizations at once within the same view. When you open the new Resource Explorer, you’ll find a comprehensive overview of all the resources you’ve stored alongside the locales for each file. You can even configure which locales are visible in the datagrid. This streamlined interface allows you to compare translations side by side and even edit them in place. No more toggling between different screens or hunting for specific files—the new design brings everything together, making localization management a breeze.


Screenshot of VS showing the updated grid view for the resource explorer with multiple translations loaded


Search and Filter:

One of the most highly requested features we are delighted to deliver on is search. Our search isn’t confined to a single file, either. It dances across different .resx files, highlighting every occurrence of your search term. Need that elusive translation string? Found! Want to track down a specific locale? Done! It’s like having a resource detective at your service.

You also have the option of selecting a subset of files to search. Whether it’s specific locales, resource groups, or just a corner of your project, you can ensure your search precision.


GIF demonstrating resources search functionality


Comments:

Each translation of a resource now has its own comment, all visible at once in the datagrid. Imagine this: You’re working on an app that supports multiple languages, and you stumble upon a quirky phrase that needs tweaking. With individual translation comments, you can provide context, backstory, or even a friendly reminder to your future self.

It’s also common that the translator isn’t the same person managing the app’s resources. Maybe it’s a third-party service or a colleague from another team. No need to worry about misunderstandings of translation context because comments bridge the gap. The translator can leave notes, explanations, or caveats right alongside the translations. It’s like having a virtual sticky note attached to each string, making collaboration seamless. Keep an eye out for familiar UI – we’ve borrowed a leaf from the UX playbook of other beloved apps (hello, Excel!). When you explore translations, be on the lookout for the small icon in the corner of each cell.


Screenshot of the comment functionality and iconography in the resource manager UI


Validation and Warnings:

The new Resource Explorer now warns you if you are missing translations or have issues with your placeholder values.

Missing Translation warnings: Localization just got smarter.  If your app supports multiple languages, missing translations can be a headache. Our revamped Resource Explorer now detects those gaps and issues targeted warnings. Whether it’s a label, button, or tooltip, we’ve got your back.

Placeholder Validation: Ever accidentally left a resource field blank or mis-formatted, only to discover it during deployment? Fear not! Our new placeholder validation feature ensures that you never miss a beat. As you create or modify resources, we’ll nudge you to fill in those essential details. No more surprises during runtime – placeholders keep you on track!

Screenshot of error UI for when a resource is missing a translation.


Accessibility and UI changes:

At Microsoft we understand technology – that’s why we continue to innovate, create, and design in a way that gives everyone the ability to achieve more. As part of this redesign we have made a handful of accessibility and UI changes that will be appreciated by developers of all abilities.

Accessibility and Assistive Technologies: We’ve fine-tuned every pixel to ensure compatibility with screen readers and assistive technologies. Everyone deserves an inclusive coding experience!

Zoom: No more squinting at the tiny grid view trying to decipher resource details. Our new grid view provides precision at your fingertips with the built-in zoom capabilities – simply use your mouse wheel or keyboard shortcuts to zoom in and out.

Dark Mode: Say goodbye to eye strain! Our revamped Resource Explorer now boasts a sleek dark mode that’s easy on the eyes. Whether you’re all-too familiar with late-night coding sessions or you simply prefer a more stylish interface, the dark theme sets the stage for focused productivity. Dive into your resource management tasks with confidence, knowing that your eyes are well taken care of.


What this version doesn’t include:

This first release of the revamped Resource Explorer does not include CSV import and export functionality, automatic translations, or a way to integrate your own translation engines directly into the designer. For these, and many more advanced features, we recommend ResXResourceManager. This Visual Studio extension, created and managed by a key developer community contributor, will always be the best-in-class resource management experience and includes many state of the art features outside of the scope of what we offer out-of-the-box in Visual Studio. If you already use this extension for your resource management in Visual Studio, no need to change anything – it will still work as usual with the new update.


Where to find it:

The revamped Resource Explorer is now on by default in the 17.11 Preview 2 and later versions of Visual Studio. You can open the designer either by double clicking on your Resources folder in the Solution Explorer, or by navigating to View > Other Windows > Resource Explorer.

The post Introducing the Revamped Visual Studio Resource Explorer appeared first on Visual Studio Blog.

Get Hands-On with Visual Studio and Azure: Live at Microsoft HQ this August!

$
0
0

Visual Studio LIVE! Microsoft HQ 2024

August 5-9 | Microsoft Conference Center, Redmond, WA

Join the Ultimate Developer Celebration!

Who’s ready to connect with fellow developers and Visual Studio Product Managers this August at the Microsoft Campus in Redmond? Visual Studio Live! @ Microsoft HQ celebrates the bright days of the Pacific Northwest—offering the perfect opportunity to immerse yourself in everything Visual Studio, Azure, GitHub, and the marvels of GitHub Copilot. This isn’t just a conference; it’s a celebration of innovation, learning, and community! With 35 speakers, including 20 from Microsoft, and 71 sessions spread over 13 tracks, there’s something for every developer. Dive deep into new capabilities across Visual Studio, Azure, and GitHub, and bring back cutting-edge knowledge to give your business a competitive edge.

Image Microsoft Sign for WordPress

Why August is the Perfect Time to Visit Us:

Not only will you have access to our dynamic lineup of sessions, but you can also enjoy VIP access to the Microsoft Commons—a bustling hub of retail, dining, and entertainment exclusive to Microsoft employees. Sample a variety of cuisines, shop for the latest gadgets and souvenirs, or unwind in the outdoor plaza with live music and games. As a special bonus, we’ll provide passes to the Microsoft Employee Store where you can score exclusive deals on the latest Microsoft products.

Exclusive Networking Opportunity:

Unlike larger conferences, Visual Studio Live! 2024 at Microsoft HQ is intentionally designed to be more intimate, with attendance capped at just 500. This unique setup provides you with unparalleled access to mingle directly with our speakers and product managers from Visual Studio, Azure, and GitHub. It’s a rare opportunity to connect personally with industry leaders, gaining insights and sharing your feedback on the tools you use every day. When we say you’ll “meet the Tool Makers,” we truly mean it—this is your chance to interact, learn from, and influence the experts behind the technologies driving today’s innovations!

Why Attend Visual Studio LIVE!

Take a break from your coding routine and join us at Visual Studio Live! 2024, where you can rapidly accelerate your understanding of the latest in Visual Studio, Azure, and GitHub amidst the camaraderie of fellow developers. It’s the perfect opportunity to catch up on Microsoft’s innovations in a collaborative setting, ensuring you stay ahead of the curve without falling behind on your projects.  Plus, check out these other reasons to sign-up before it is sold out:

  • Inspirational Keynotes: Don’t miss keynotes from Microsoft leaders like Scott Hunter on building cloud-native applications on Azure (08/06), and Asad Khan with Bob Ward on leveraging AI and Microsoft Fabric for modern SQL applications (08/07).
  • Comprehensive Learning: Tailored for developers, architects, and technical managers, this event offers both introductory and advanced topics to deepen your expertise.
  • Interactive Experience: Engage directly with Microsoft product leaders and industry experts through several planned networking events.
  • Networking Opportunities: Connect with Microsoft Speakers, MVPs, and Product Managers across the Visual Studio IDE and Azure services.
  • Spotlight on AI: Discover the latest in AI technology with GitHub Copilot integrated with Visual Studio and more.

Exclusive Discounts

Visual Studio Professional & Enterprise Subscribers can unlock exclusive discounts for the event by exploring your discount benefit on My.VisualStudio.com. Not a subscriber? No problem—grab the EARLY BIRD Discount on the Visual Studio Live! Event Pagehttps://na.eventscloud.com/ereg/index.php?eventid=770846 before it’s gone! Only 500 spots are available to this exclusive event, we expect it to sell out, don’t delay.

Image MyVisualStudio VS LIve 3

Don’t Miss Out!

This event is expected to sell out—secure your spot now for an unforgettable week of learning, networking, and technological innovation.

We’re excited to collaborate with Visual Studio LIVE! to bring you this comprehensive event, designed to empower the developer community’s growth and success. Join us in Redmond this August for a memorable week of learning, networking, and tech innovation.


The post Get Hands-On with Visual Studio and Azure: Live at Microsoft HQ this August! appeared first on Visual Studio Blog.

Giving our Azure marketplace images a makeover

$
0
0

We previously announced the addition of new, optimized Azure VM image offers to help you create and test your applications faster and more easily on Azure VMs and the Microsoft Dev Box service. As we continue to evolve and optimize our offers, we’re introducing more developer-optimized VM images and deprecating our older non-optimized offers. In this blog post, we’ll provide details and timelines for the additions and depreciations that will take place over the next couple of months.

Image large imageretirmentblog picture

Boost your productivity with new Azure marketplace images

We’re committed to giving you the best, most productive starting point for your Azure VMs and Dev Box definitions. That’s why our developer optimized images are tailored to meet your development needs and include the latest OS’s, tools, and developer settings. They also provide a consistent and reliable development environment that can be easily replicated and shared across teams and projects.

Today we are happy to announce two new additions to our Azure marketplace presence. First, we just added a VS 2022 Community image to the existing Visual Studio 2022 (Microsoft Dev Box compatible) VM offer.

For the second addition, which will happen later this year, we’ll create a new Azure VM offer that focuses on the latest Windows Server release.

This new offer will include images of the following Visual Studio releases:

  • VS 2019 Professional
  • VS 2019 Enterprise
  • VS 2022 Community
  • VS 2022 Professional
  • VS 2022 Enterprise

What are we deprecating?

Over the years we have published several VM images in the Azure marketplace. Although we believe this has made it easier for you to develop on your Azure VMs, many of our older VM images have either reached their end-of-life, contain unsupported components, duplicate more recent marketplace releases, or don’t offer developer optimizations.

Today we are announcing our plan to deprecate the following offers:

Offer to be deprecated Replaced by offer
Windows Client
Visual Studio 2019
Visual Studio 2022


We also plan to deprecate the VS 2015 images from the Visual Studio 2015 & 2017 offer. There will be no changes to the VS 2017 images at this point, and the offer will be renamed to “Visual Studio 2017” to reflect these changes.


What’s the timeline for these changes?

We know some of you may rely on the images that we are planning to deprecate. Because we want to make the right choices and provide you with ample time to make changes and provide feedback, we’ll make these changes gradually. We hope to gather and address your feedback along the way.

Phase Date Description
1 Starts: June 28, 2024

Completes: ~90 days after (Sept 26, 2024)

2 Starts: November 8, 2024

Completes: ~90 days after (Feb 6, 2025).

3 ~December, 2024
  • New Windows Server offer is published.


At the start date for each deprecation phase, impacted offers (Dev Box compatible plans are not impacted) will:

  • No longer be searchable in the marketplace.
  • Remain available for deployment to new VMs or scale set instances up until the deprecation date.

Here’s what will happen after the deprecation completes:

  • You won’t be able to deploy any additional virtual machine (VM) using any images within these respective offers.
  • Active VM instances won’t be affected following the deprecation date.

See the full Deprecated images FAQ to learn more.


Finally, don’t forget that you can make your own custom images using our older downloads page.


Let us know what you think!

We know that these kinds of changes might impact some in a way that we’ve not accounted for, or that the process may be too arduous to react to. Therefore, we ask you to please share your thoughts about the deprecation plan via this Developer Community ticket.

If you have feedback about the new additions, requests or suggestions to improve our Azure VM offerings, please share it via this Developer Community ticket.

The post Giving our Azure marketplace images a makeover appeared first on Visual Studio Blog.

Visual Studio 2022 – 17.10 Performance Enhancements

$
0
0

We are excited to announce the latest update of Visual Studio 2022, which brings you a range of performance enhancements across various areas of the IDE. In this blog post, we will highlight some of the most notable improvements that you can experience in version 17.10, such as faster Windows Forms designer loading, faster Razor colorization, quicker solution loading, and reduced DLL overhead.

Image Picture1

Windows Forms designer loading speed

We heard from developers and partners that Windows Forms designer in projects targeting .NET Core 3.1 and up can be slow in loading up. In those scenarios the designer is loaded inside a separate process that runs alongside Visual Studio. The time to load this process can be long depending on the project’s dependencies. The impact is exacerbated when this designer process needs to be restarted under some conditions, such as when project references change.

We are thrilled to announce that these enhancements have yielded remarkable design time performance improvements, ranging from 30% to an impressive 50% in a typical line of business application. We encourage you to explore the updated designer and share your invaluable feedback through   so that we can continue improving Windows Forms designer performance.

Razor / C# colorization speed

Colorizing C# code is a complex operation. When there is C# code inside Razor pages, Razor delegates the task of colorization of such code to the C# language service (Roslyn). Our data shows that in most cases this colorization is very fast, but about 10% of cases can run into hundreds of milliseconds.

Performance improvement of Razor editing experience is a consistent focus of our engineers; in 17.10 they focused on the slow colorization. In their analysis, they found that Roslyn performs a significant amount of work which is not really needed in the specific context of colorization of the code (e.g. determining which variables are potentially null).

Optimizations have been put in such that Roslyn does just the work that is needed in the colorization context. Based on data from 17.10 Preview builds, we have noticed about 25% reduction in colorization time in the slowest cases. If you have noticed a lag before colorization within Razor, we hope you will notice the improvement in 17.10.

Faster .NET solution load

The speed of opening a solution is something that we improve with every update of Visual Studio and 17.10 is no different. Visual Studio uses something called an evaluation cache such that on every opening of a solution, MSBuild does not have to reevaluate all the dependencies.

In 17.10, the contents of this cache were heavily tuned such that loading it is more efficient. Our measurements with OrchardCore solution showed that the cache size dropped by nearly 50%. More importantly for our users, this resulted in a 10% reduction in the time to open that solution.

Improving the fundamentals

In 17.10, in addition to improving fundamentals such as CPU and memory usage, we also reduced the number of DLLs loaded in specific scenarios. With careful refactoring and tuning of code involved in loading .NET projects, we cut down the number of DLLs loaded by 10%! Loading DLLs can be slow on lower end machines with spinning disk hard drives. Moreover, DLL loads invite overhead from anti-virus software inspecting the DLLs, so we hope these improvements will help on slower machines.

Share your feedback and stay connected with Visual Studio!

We appreciate the time you’ve spent reporting issues and submitting suggestions and hope you continue to give us feedback when using Visual Studio on what you like and what we can improve. Your feedback is critical to help us make Visual Studio the best tool it can be! You can share feedback with us via Developer Community: report any bugs or issues via report a problem and share your suggestions for new features or improvements to existing ones.

Stay connected with the Visual Studio team by following us on YouTube, Twitter, LinkedIn, Twitch and on Microsoft Learn.

On behalf of the entire Visual Studio team, thanks for reading and Happy Coding!

The post Visual Studio 2022 – 17.10 Performance Enhancements appeared first on Visual Studio Blog.

Catch up on the latest Git tooling features in 17.10 GA

$
0
0

We believe that boosting the productivity of your development and team collaboration helps you produce better software solutions. That’s why the Visual Studio Version Control team has delivered new features, streamlining your inner loop and code review experiences. You’ll get AI support writing commit messages, pull request descriptions, commit explanations, and a better pull request creation experience. Download the latest Visual Studio release to try them out and let us know what you think! 

Write less, code more with GitHub Copilot 

Starting with Visual Studio version 17.10 GA, to try out generated pull request descriptions and commit explanations, you’ll need to have an active GitHub Copilot subscription and the GitHub Copilot component installed and the Git Preview Features enabled in the GitHub Copilot Menu. 

Updates to generated Git commit messages 

We listened to your feedback and shortened the output of our generated Git Commit features. Share feedback on this change on the ticket in Developer Community. AI Generated Commit Shorter

Improve your code reviews with generated pull request descriptions

Leverage GitHub Copilot, you can now generate a first draft description for your pull request. You’ll get assistance in providing important context to your colleagues for their reviews and get the added benefit of ensuring you include all the pertinent changes in your pull request. 

Select “Add AI Generated Description” sparkle pen icon within the Create a Pull Request window to see your description.   

AI generated pull request description

Unravel your commit history

We’ve added a GitHub Copilot powered explain feature to the Commit Details window to make it easier to understand the contents of each commit. You’ll get a summary of the changes side by side with the code, highlighting the key differences and the rationale behind them. 

Double click on any commit to open the Commit Details pane in the Git Repository window. Then, select “Explain” icon to get a summary of the changes.  AI generated commit explanation

Create a pull request in Visual Studio with work item linking

We were so excited by the enthusiastic reception to the preview Create a Pull Request flow and the subsequent updates.  This is now the default experience in Visual Studio and includes the number one request from Azure DevOps, linking work items to pull requests. Now, you can use the Related Work Item section to view any items you referenced in your description and link them to your pull request on Azure DevOps.

 Pull request work item linking

Help us make the Visual Studio Version Control tooling better 

AI support can make tedious version control documentation easier to tackle. Also, smoother pull request experience helps your collaborations thrive! Try out the latest features in Visual Studio 17.10 GA and share your feedback in the following surveys: 

We appreciate the time you’ve spent reporting issues/suggestions and hope you continue to give us feedback when using Visual Studio on what you like and what we can improve. Your feedback is critical to help us make Visual Studio the best tool it can be! You can share feedback with us via Developer Community: report any bugs or issues via report a problem and share your suggestions for new features or improvements to existing ones.   

Stay connected with the Visual Studio team by following us on YouTube, Twitter, LinkedIn, Twitch and on Microsoft Learn.  

The post Catch up on the latest Git tooling features in 17.10 GA appeared first on Visual Studio Blog.


Bosch widely adopts Visual Studio for their C++ remote Linux projects

$
0
0

the logo for Bosch in red and black

The Bosch security camera team was seeking a unified development setup for their team and recently re-evaluated Visual Studio as a solution for their C++ projects and remote Linux development needs. Their experience with Visual Studio 2022 featured notable improvements relevant to their workflows such as seamless GDB integration and CMake/WSL integrations. 

The Bosch team had adapted their project to maximize Visual Studio’s capabilities but had one last barrier before being able to widely adopt Visual Studio, which was a need for increased customizability of rsync settings. 

Read more about the Microsoft C++ team’s experience with delivering this functionality to Bosch at the link below: 

Bosch widely adopts Visual Studio 2022 after experiencing performance improvements for C++ Linux cross-compilation – C++ Team Blog (microsoft.com)

Conclusion

We appreciate the time you’ve spent reporting issues/suggestions and hope you continue to give us feedback when using Visual Studio on what you like and what we can improve. Your feedback is critical to help us make Visual Studio the best tool it can be! You can share feedback with us via Developer Community: report any bugs or issues via report a problem and share your suggestions for new features or improvements to existing ones.   

Stay connected with the Visual Studio team by following us on YouTube, Twitter, LinkedIn, Twitch and on Microsoft Learn.  

The post Bosch widely adopts Visual Studio for their C++ remote Linux projects appeared first on Visual Studio Blog.

Easily navigate code delegates while debugging

$
0
0

Delegates are everywhere in modern code; a delegate is a type that represents references to methods with a particular parameter list and return type. Developers use delegates to pass methods as arguments to other methods. One example you may be familiar with is with event handlers. Handlers are methods you can invoke through delegates. Delegates remind me of C++ function pointers, but of course delegates are fully object-oriented.

There are a few ways to represent delegates, there is, for example, Func delegate. This generic delegate represents a method that takes one or more parameters and returns a value of a specified type. Here is an example (with a lambda expression):

Func<int, int> Multiplier = n => n * 5;
int val = Multiplier(5);
Console.WriteLine(val);

The most recent variation of this concept is Action, which provides a more convenient shorthand. When you use Action you do not have to explicitly define a delegate that encapsulates a method with a single parameter. Here is an example:

Action<string> outputFunc = GetOutputRoutine();
outputFunc("Hello, World!");

static Action<string> GetOutputRoutine()
{
   return MyConsoleWriter;
}

static void MyConsoleWriter(string input)
{
   Console.WriteLine("Console: {0}", input);
}

So, this is a nice lesson, but why am I mentioning all this? While I find passing methods around like parameters is convenient when writing code, I also wish it were easier to follow while debugging. You can of course easily step into these methods, but I often want to quickly navigate to the underlying code represented by the delegate before or after stepping, and with the latest updates to Visual Studio 17.10 it’s incredibly easy.

When you pause while debugging, you can hover over any delegate and get a convenient go to source link, here is an example with a Func delegate.

Visual Studio debugging func goto source

The Go to Source indicator makes it clear, in this example, that you will get redirected back to the lambda expression.

Please note this is not just for managed code situations, this also supports C++ function pointers and std::function.

We appreciate your feedback to help us improve Visual Studio and make it the best tool for you! You can share feedback with us via Developer Community: report any bugs or issues via report a problem and share your suggestions for new features or improvements to existing ones.

Please stay connected with the Visual Studio Debugger team on Twitter.


The post Easily navigate code delegates while debugging appeared first on Visual Studio Blog.

Keep Visual Studio automatically updated and secure through Microsoft Update

$
0
0

Visual Studio is coming to Microsoft Update! We’re pleased to announce that starting in August 2024, developers who are not part of an organization managed by an IT administrator can choose to receive monthly Visual Studio security updates through the Microsoft Update (MU) system on “patch Tuesdays”.  This new update option will be available for Visual Studio 2022, Visual Studio 2019, and Visual Studio 2017. It won’t be available for the Preview channel.

How to enable Visual Studio updates through MU

Open Windows Settings and go to Windows Update > Advanced Options. If you can toggle the option at the top “Receive updates for other Microsoft products”, then you control your machine’s update policies and can choose to receive updates for Visual Studio and other Microsoft products from MU. We encourage you to enroll in this capability, as it’s by far the easiest way to stay updated and secure on a monthly cadence. If this option is greyed out and you can’t toggle it, this new feature does not apply to your machine (even if it is turned on) because your administrator controls your update policies.

Image ReceiveUpdatesOn
Figure 1 – Microsoft Update policy that is controlled by the user

How it works

As with other Visual Studio update methods, Visual Studio must be closed to apply these updates. MU will never force-close Visual Studio to apply the update. Updates delivered through Microsoft Update typically happen during machine idle time at night. Once you have opted into receiving Visual Studio updates through MU, just remember to periodically save your work and close Visual Studio in the evening to make sure that the update isn’t blocked. The next morning, you can verify in the Windows Update history that the latest Visual Studio security update was successfully applied. You can also initiate the update manually on demand by closing Visual Studio and pressing the Windows Update “Check for updates” button.

Opting out of MU updates for Visual Studio

If you have chosen to receive updates for other Microsoft products, but you don’t want to receive Visual Studio updates from MU, you can set this registry key value to opt out: [HKLM\Software\Policies\Microsoft\VisualStudio\Setup] “VSthroughMUUpdatesOptOut”=dword:1

Preview the experience through July 2024

You can try out this new experience through July 2024 in advance of it rolling out in August. To opt in to the preview, toggle “Receive updates for other Microsoft products” to On, and set this registry key value: [HKLM\Software\Policies\Microsoft\VisualStudio\Setup] “PreviewAutomaticUpdates”=dword:1

Starting in August 2024, this registry key won’t be necessary.

During June and July, the updates will have a “[Microsoft Update Preview]” prefix in the title. These updates are the same update as if you manually installed it from within the Visual Studio IDE.

Image WUUpdateHistory
Figure 2 – Visual Studio security updates delivered during the Preview timeframe


Planned improvements

There are a few improvements to this experience that we’re working on.

  • If you rollback an update, you can temporarily use the registry key to opt out of MU updates for Visual Studio to prevent the update from automatically being re-applied. We’re working on a reliable experience for this.
  • We’re working to improve the error messages in the Windows Update UI, such as for the condition that the update was cancelled because Visual Studio was open.
  • If you use the “Check for Updates” button in the Windows Update UI, the progress bar will appear to be stuck at 0% until the update finishes, at which point it will immediately go to 100%. Visual Studio updates can take a while, so we ask for your patience while we improve the progress bar.

What about IT Admin managed machines?

We’ve delivered a rich set of managed update solutions via Visual Studio Administrator Updates, which allow IT administrators in organizations to deploy monthly Visual Studio security updates by using Windows Update for Business. Over 1500 organizations, including Microsoft, currently use this solution to automatically install Visual Studio security updates on hundreds of thousands of machines each month.

Conclusion

If you’re an individual user that controls your own machine’s update policies, we hope you enroll in this solution to automatically receive and install updates for Visual Studio along with other Microsoft products. We welcome your feedback on this Automatic Update experience.

We appreciate the time you’ve spent reporting issues/suggestions and hope you continue to give us feedback when using Visual Studio on what you like and what we can improve. Your feedback is critical to help us make Visual Studio the best tool it can be! You can share feedback with us via Developer Community: report any bugs or issues via report a problem and share your suggestions for new features or improvements to existing ones.

Stay connected with the Visual Studio team by following us on YouTube, Twitter, LinkedIn, Twitch and on Microsoft Learn.


The post Keep Visual Studio automatically updated and secure through Microsoft Update appeared first on Visual Studio Blog.

Code Assessment with .NET Upgrade Assistant

$
0
0

We are thrilled to announce the latest enhancements to the .NET Upgrade Assistant. .NET Upgrade Assistant helps upgrade solutions to newer versions of .NET. Whether you’re upgrading from .NET Framework to .NET 8 or just between .NET Core versions (from .NET 6 or 7 to .NET 8 or 9), .NET Upgrade Assistant can help you understand what changes will be needed. .NET Upgrade Assistant is available as a Visual Studio extension or as a command-line tool. Now as part of your upgrades to modern .NET, you’ll have access to powerful code assessment features.

Image dashboard view 2

Here’s what’s new:

Our code assessment tool scans your solution at the source code level and identifies potential issues and dependencies that could pose challenges during the upgrade process. You will be provided with a comprehensive dashboard that provides an overview of issues across your entire solution and estimates of how much effort will be required for each issue to be remediated.

Each issue in the report is categorized by severity, allowing you to prioritize your efforts. Whether it’s a mandatory issue blocking upgrade or an optional issue identifying opportunities to take advantage of features available in the latest .NET framework, you’ll know exactly where you need to focus your attention.

Example of issues page in report

Issues can provide exact locations within your source code where issues were detected, making troubleshooting and fixing dependencies a breeze. Easily navigate through projects and pinpoint areas that need attention. You can jump to a line that requires your attention, address issues and mark them as fixed, and save the current state of the issues and report so you or your coworkers can pick up exactly where you left off, making collaboration easier than ever. We also include relevant links to documentation, best practices, and community discussions to give you the guidance you need to tackle each challenge.


Install the Visual Studio Extension

Pre-requisites:
  • Windows operating system
  • Visual Studio 2022 version 17.1 or later
Installation:

If you don’t already have the .NET Upgrade Assistant installed, you can download and install the extension from the Visual Studio Marketplace or install it from inside Visual Studio.

Note: The .NET Upgrade Assistant extension now installs on a per-user basis so there’s no requirement for elevated admin permissions to install. This addresses a need voiced by some users who don’t have admin permissions on their dev machines. More information and troubleshooting suggestions may be found in this blog post. 


Install the CLI tool

Prerequisites:
  • .NET SDK

The .NET Upgrade Assistant is also available as a .NET global tool. You can install the tool with the following command:

dotnet tool install -g upgrade-assistant

Similarly, because the .NET Upgrade Assistant is installed as a .NET tool, it can be easily updated by running:

dotnet tool update -g upgrade-assistant


Analyze applications with Visual Studio

Once you have installed the Visual Studio extension, you are all set to analyze your application in Visual Studio. You can do so by right clicking on your solution in the Solution Explorer and selecting Upgrade.

Image upgrade selection in solution explorer

The tool will open a window offering you to either create a new report or open an existing one.

Image new report

To start a new report, select the projects you want to analyze on the next screen. Web projects are already checked for you, but you may change the selection by checking or unchecking the boxes next to the projects. When the tool runs its assessment, it also analyzes the dependencies for your selected projects. 

Image select projects

On the next screen you can select your preferred target framework for the upgrade. If you need help deciding which target framework is right for you, please check out this blog post.

Image select tfm

Next you will choose the components from the previously selected projects that you want to analyze. You can select just your source code and settings, or also include all your code’s binary dependencies for analysis. A custom config file may also be included to change the way that the rules for analysis work. After this selection, hit Analyze to begin the assessment of your application and receive your report

Image what to analyze in selected project


Analyze applications with the CLI

After you’ve installed the .NET Upgrade Assistant CLI tool, open a terminal window and navigate to the directory that contains the project you want to analyze. You can use the following command to see the available options the CLI provides:

upgrade-assistant --help

Run analysis on your application with:

upgrade-assistant analyze

The CLI tool provides an interactive way of choosing which project to analyze. Use the arrow keys to select an item, and press Enter to run the item. Select the project you want to analyze. Follow the prompts in the command terminal to make the same selections as outlined above in the Visual Studio extension. When the analysis is done, you will be provided with a report in the format you selected.


Interpret Results

After analysis in Visual Studio, the tool will provide you with a dashboard summary and detailed report. The report will show you information about the number of projects analyzed, issues and incidents found, and an estimate of how much effort each issue, incident, and project will take to be fixed.

Image dashboard view 2

You can view aggregate issues for the whole solution or dig into project specific views. Here you can see detailed information on each incident, get help on how to fix them, jump to their location in code, and so on. You can view these issues by type of issue or by component so that you can understand where the bulk of the issues in the report originate from.

Image project specific issues


Share results

Both the CLI tool and Visual Studio allow you to save the results of the analysis in various formats so that you may share the report with others. In Visual Studio, just click the export icon in the top right corner of the tool window and select your desired export format. 

Image white theme export

In the CLI tool, the final selection before your report is generated will be to select your desired export format. Press Enter to select, then you will be prompted to enter a name for your report. The tool will then generate your report in the format you selected. 

Image CLI export

The tool can generate reports in HTML, CSV, and JSON formats. The HTML report looks very similar to the dashboard you’ll see in the Visual Studio after the analysis is completed.

Image report dashboard

You can export these reports with various privacy modes so that you can feel confident that those who receive the reports will have exactly the right amount of information required to understand what work needs to be done without risking exposing sensitive information.

Image privacy modes


Useful Materials

For supported languages, project types, and upgrade paths, please refer to our Microsoft Learn documentation for the .NET Upgrade Assistant.

Documentation: Overview of the .NET Upgrade Assistant – .NET Core | Microsoft Learn

Install: How to install the .NET Upgrade Assistant – .NET Core | Microsoft Learn

Getting started: .NET Upgrade Assistant | Get Started (microsoft.com)


Feedback

Please give us your feedback or report any issues either by filing an issue directly in the .NET Upgrade Assistant repository, or via the Visual Studio feedback channelby choosing Help | Send Feedback in Visual Studio. Please mention “.NET Upgrade Assistant” in the title so it will get routed to our team quickly. We appreciate your input and want to build the best tools for you! 


The post Code Assessment with .NET Upgrade Assistant appeared first on Visual Studio Blog.

Let GitHub Copilot draft of your pull request description

$
0
0

Writing good pull request descriptions is essential for effective code reviews and collaboration. But it’s time-consuming and tedious, especially when you have multiple commits or complex changes. That’s why we’re highlighting a feature that will make your life better with the help of GitHub Copilot: generated pull request descriptions. GitHub Copilot examines your code changes and generates helpful summaries that you can edit and customize. Save your energy for your coding tasks and let GitHub Copilot provide extra context for your reviewers.

Starting with Visual Studio version 17.10 GA, to try these out, you’ll need to have an active GitHub Copilot subscription and the GitHub Copilot component installed and the Git Preview Features enabled in the GitHub Copilot Menu.

Get going faster with generated pull request descriptions

One of the most popular features of GitHub Copilot is the ability to generate Git commit messages based on your code changes. We’ve heard awesome feedback on this feature, so we wanted to continue saving you time and improve your collaborations by enabling GitHub Copilot-powered pull request descriptions. You can now generate a first draft for your pull request and preview the markdown output. You’ll get assistance in providing important context to your colleagues for their reviews and get the added benefit of ensuring you include the right changes in your pull request.

Select “Add AI Generated Pull Request Description” sparkle pen icon within the Create a Pull Request window to see your description.

AI generated pull request description

Help us go further

So far, we’ve heard customers are satisfied with their generated results, sharing that responses are accurate and useful, and inserting suggestions at a rate of 80%! Please share your ideas to improve this future and further power up Version Control with GitHub Copilot.

We appreciate the time you’ve spent reporting issues/suggestions and hope you continue to give us feedback when using Visual Studio on what you like and what we can improve. Your feedback is critical to help us make Visual Studio the best tool it can be! You can share feedback with us via Developer Community: report any bugs or issues via report a problem and share your suggestions for new features or improvements to existing ones.

Stay connected with the Visual Studio team by following us on YouTube, Twitter, LinkedIn, Twitch and on Microsoft Learn.

The post Let GitHub Copilot draft of your pull request description appeared first on Visual Studio Blog.

Viewing all 1144 articles
Browse latest View live


<script src="https://jsc.adskeeper.com/r/s/rssing.com.1596347.js" async> </script>