Quantcast
Channel: Visual Studio Blog
Viewing all 1144 articles
Browse latest View live

Dive into native Windows development with new WinUI workload and template improvements

$
0
0

At //Build 2024, the WinUI team announced a renewed focus on WinUI as one of the premier app development frameworks we recommend for native Windows app development. To make it as seamless and easy as possible to get into coding, we created a new Windows Dev Center page, streamlined our Getting Started with WinUI documentation, and partnered with Visual Studio to improve the developer experience with workloads and templates. Today, we’ll focus on showing you the great new changes in Visual Studio along with a little bit of our thought process behind them and links to learn more!

Windows application development workload with C# only

Getting started with the new workload

In Visual Studio 17.10, the new “Windows application development” workload is now available for developers to jump right in and get started with writing stylish, modern, and fast WinUI apps using .NET or C++ with only one click. This workload replaces the older “Universal Windows Platform development” workload with tools aimed at the latest generation of WinUI + the Windows App SDK. WinUI templates have also been given a fresh new icon and priority boost in the New Project template list, and they now include a new community-requested Unit Test template to help test WinUI apps more easily!

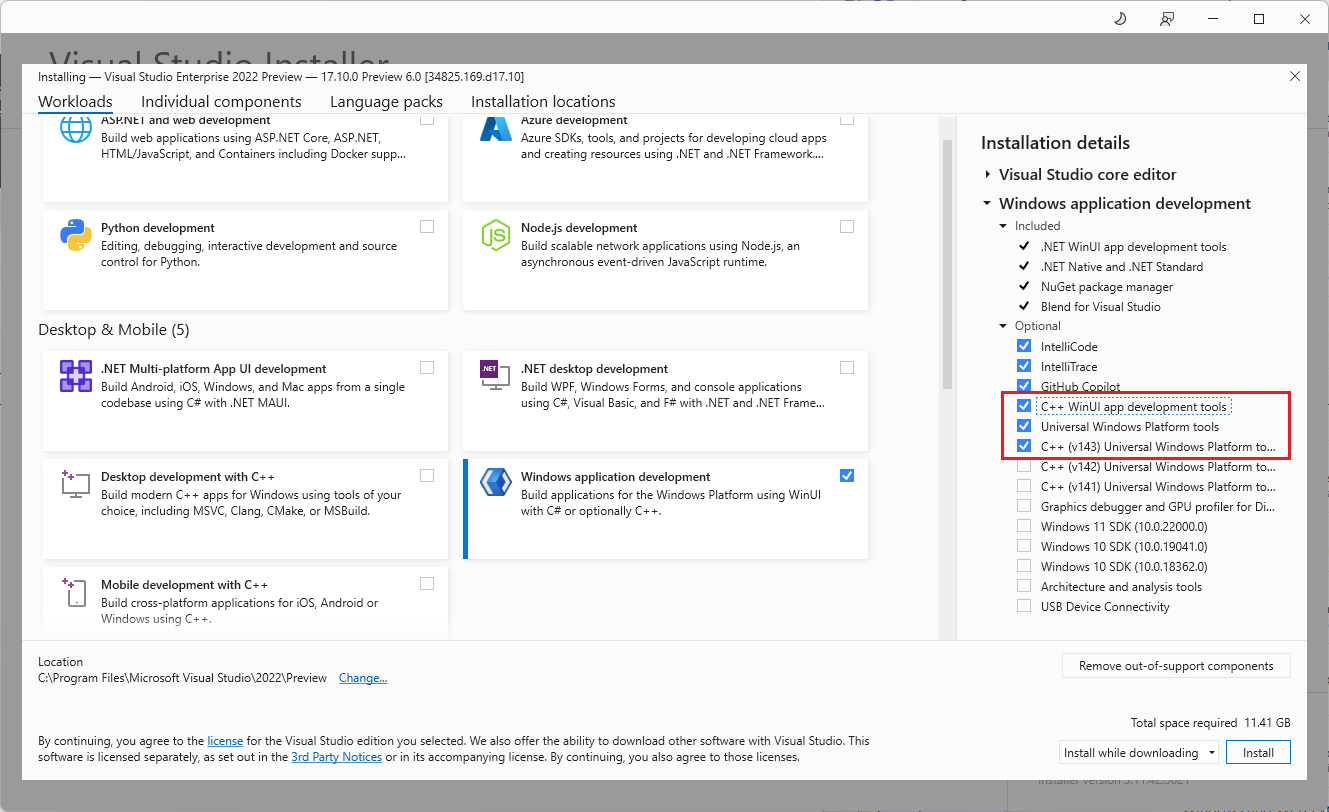
To get started with the new workload, follow these easy steps:

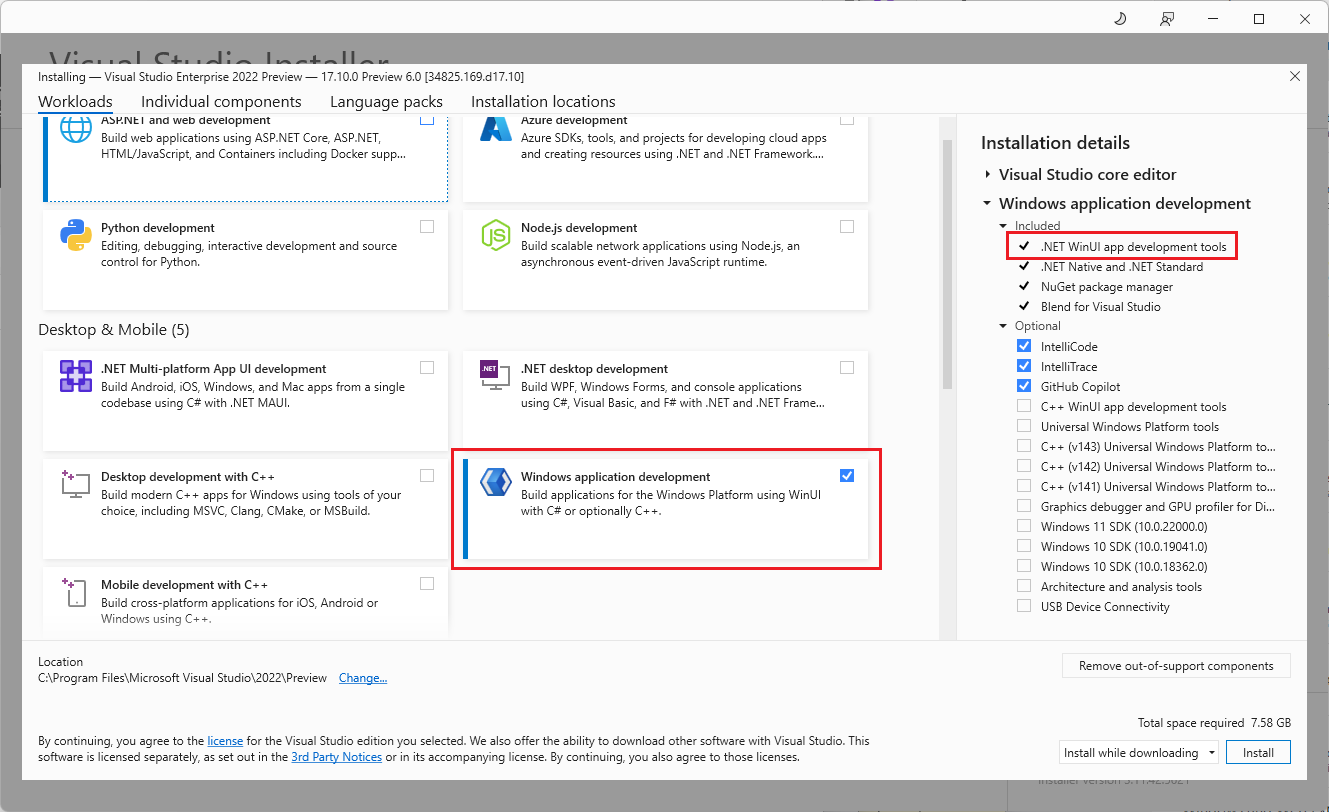
  1. Open the Visual Studio Installer.
  2. Under Workloads > Desktop & Mobile, select the “Windows application development” workload.
    • If you’re developing in C#, congrats, you’re finished! The workload includes .NET WinUI app development tools by default.
  3. If you’d like to develop in C++ or if you need the tools for Universal Windows Development, select the optional “C++ WinUI app development tools” component. This will automatically select the Universal Windows Platform tools and C++ Universal Windows Platform tools components.

Windows application development workload with C++

That’s it! In previous versions of Visual Studio, to develop with WinUI + the Windows App SDK you had to manually search for each required component in the list of optional components – and this was after reading the docs to find out what you needed! We also heard feedback that WinUI in the Windows App SDK, which represents the latest generation of WinUI that succeeds the Universal Windows Platform (UWP), was less prominent than its predecessor. With the new workload and components, we’ve addressed this feedback to make the newest tools and APIs clear, front-and-center, and available with one click!

Take advantage of WinUI template improvements

Once you have the “Windows application development” workload installed, now it’s time to start creating projects. We got some great feedback here on the New Project screen as well – the WinUI templates were far down the list, which made them seem less important than other templates, and they needed a fresh coat of paint. We heard you, so we bumped the most-used WinUI templates closer to the top and added a sparkly new icon!

Go to File > New Project to see these updates in action!

New WinUI templates and icons

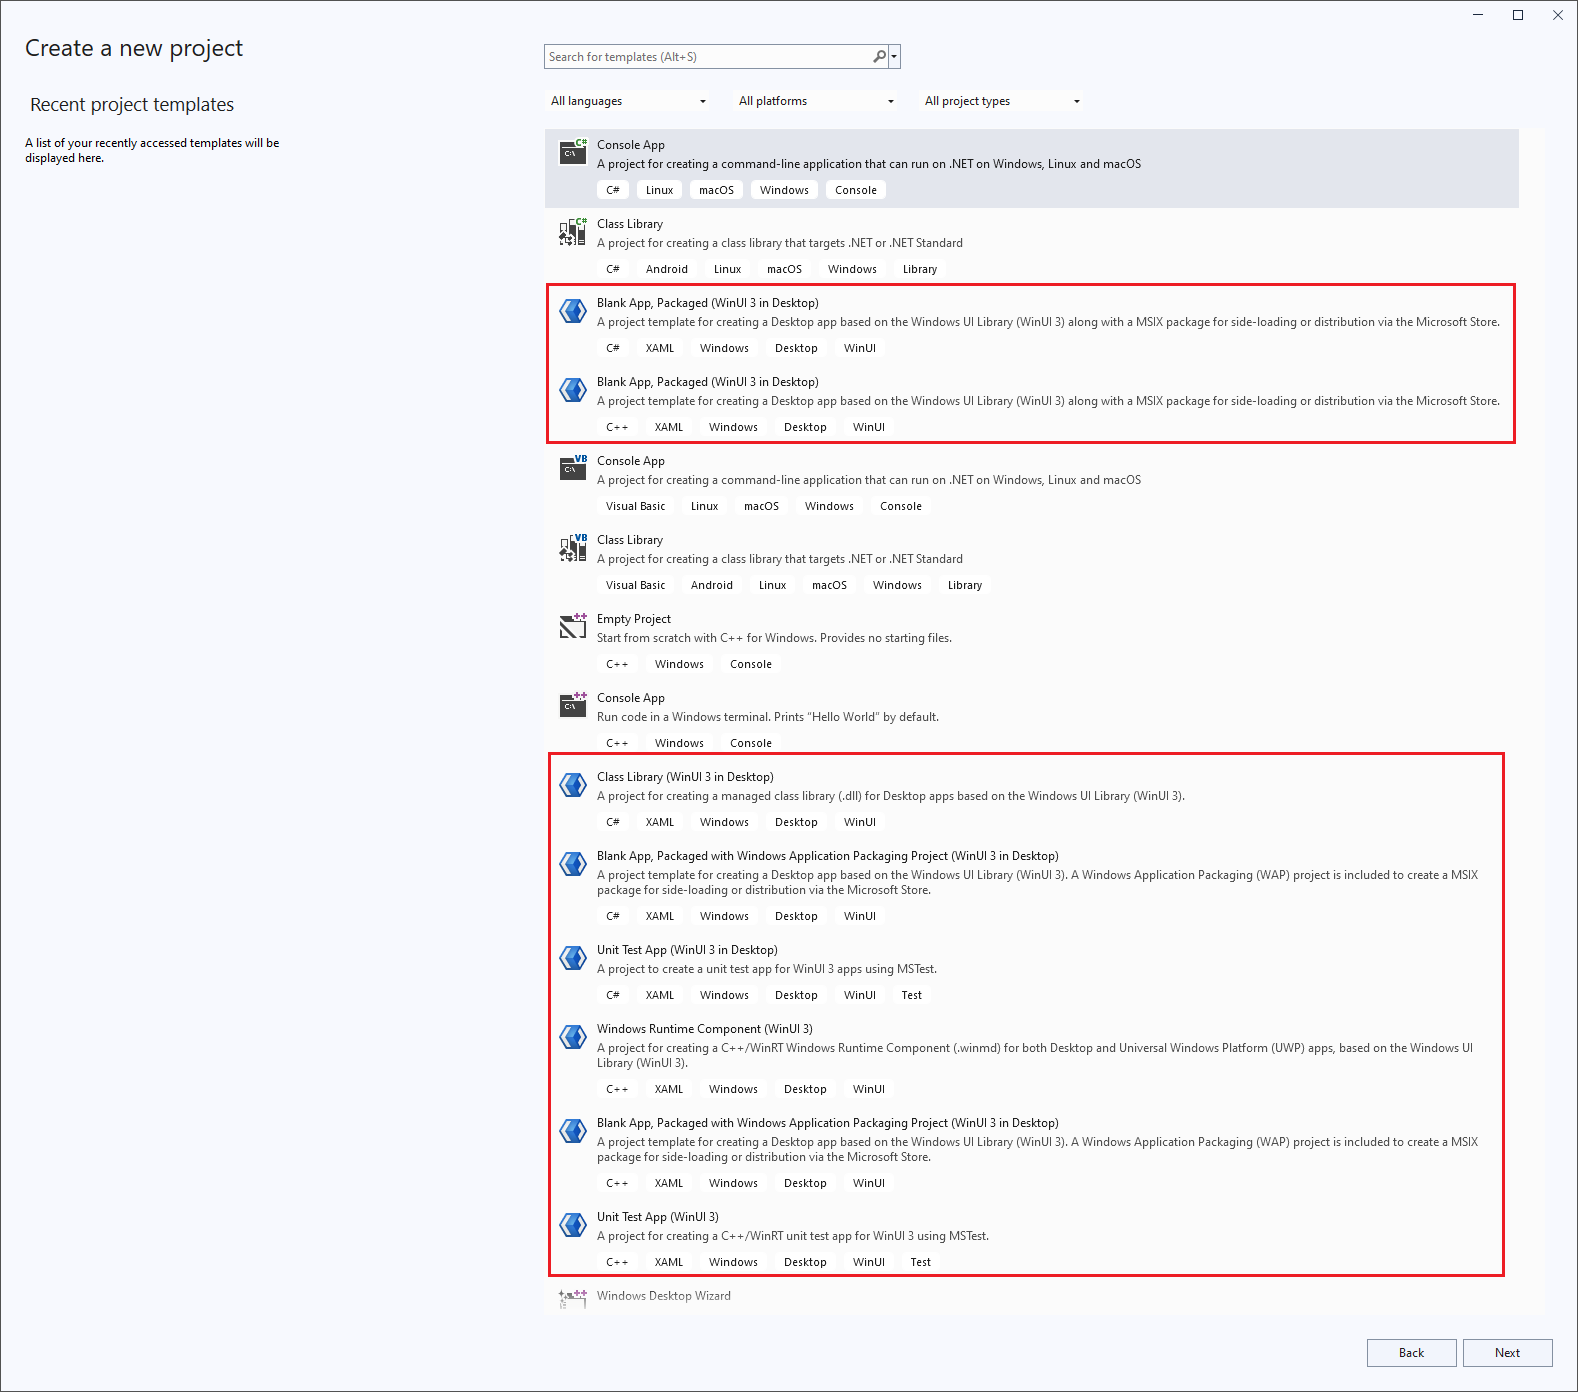
The rest of the templates aren’t much farther down, either; on most monitors, you probably won’t need to scroll to see them. In that list is one more addition we’d love to highlight – the new Unit Test template for WinUI! This was directly requested by you, the WinUI developer community, and we’re thrilled to introduce it alongside our other improvements to the WinUI workload and template experience.

Conclusion

We wanted to thank you again for all your for you. You’re helping to make it easier for new WinUI developers to embrace native app development on Windows and helping us produce the best native app development experience on Windows that we can.

To give us feedback on the platform directly, visit us on GitHub, or follow us on Twitter to stay up to date on releases and news.

To learn more about WinUI and for more info on getting started, check out our new Windows Dev Center page at https://aka.ms/windev.

If you’re interested in the full picture of what we talked about at //Build 2024 beyond our Visual Studio updates, check out these two sessions:

We appreciate the time you’ve spent reporting issues/suggestions and hope you continue to give us feedback when using Visual Studio on what you like and what we can improve. Your feedback is critical to help us make Visual Studio the best tool it can be! You can share feedback with us via Developer Community: report any bugs or issues via report a problem and share your suggestions for new features or improvements to existing ones.

Stay connected with the Visual Studio team by following us on YouTube, Twitter, LinkedIn, Twitch and on Microsoft Learn.

The post Dive into native Windows development with new WinUI workload and template improvements appeared first on Visual Studio Blog.


Demystify history with GitHub Copilot commit explanations

$
0
0

Have you ever struggled to understand what a commit was doing or why it was made? Do you wish you had more clarity and context when reviewing or collaborating on code changes? If you answered yes, then you’ll love what GitHub Copilot can do for you: generate commit explanations. GitHub Copilot can analyze your code differences and produce concise summaries that highlight the key points. No more guessing or wasting time on deciphering your Git history. You can focus on coding and collaborating with ease. And the best part is, you can also improve your communication and teamwork by having better documentation and transparency of your code changes.

Unravel your commit history with GitHub Copilot

Git history can be daunting to shuffle through, but it’s often the best way to learn about a code base or help identify the origin of a bug. We’ve added a GitHub Copilot powered explain feature to the Commit Details window to make it easier to understand the contents of each commit. You’ll get a summary of the changes side by side with the code, highlighting the key differences and the rationale behind them. Since GitHub Copilot needs to look at all the changes, this may take some time for large changesets or pull requests.

Double click on any commit to open the Commit Details pane in the Git Repository window. Then, select Explain button above the commit message to get a summary of the changes. Pro tip: use the expand option and the summary view to get a better view of the code changes with the description.

Explain commit in the Git respository window with arrows highlighting the expand buttons and summary diff

Please share your thoughts!

More folks are finding this option useful, so we wanted to highlight it here and share it broadly. We’d love to hear your thoughts for how to make commit explanations better and any other ideas to superpower Version Control with GitHub Copilot, especially with Git history.

We appreciate the time you’ve spent reporting issues/suggestions and hope you continue to give us feedback when using Visual Studio on what you like and what we can improve. Your feedback is critical to help us make Visual Studio the best tool it can be! You can share feedback with us via Developer Community: report any bugs or issues via report a problem and share your suggestions for new features or improvements to existing ones.

Stay connected with the Visual Studio team by following us on YouTube, Twitter, LinkedIn, Twitch and on Microsoft Learn.

The post Demystify history with GitHub Copilot commit explanations appeared first on Visual Studio Blog.

Get Hands-On with Visual Studio and Azure: Live at Microsoft HQ this August!

$
0
0

Visual Studio LIVE! Microsoft HQ 2024

August 5-9 | Microsoft Conference Center, Redmond, WA

There’s still time to register, join us, get your questions answered, and bring back a wealth of knowledge and excitement to your teams! We’re close to selling out for next month’s conference, which will be packed with valuable sessions and activities, hosted on campus at the Microsoft Conference Center in Redmond, WA.

Visual Studio LIVE! 2024 is not just another conference; it’s a celebration of innovation, learning, and community. Here are some key highlights and reasons why you should attend:

Discover the Latest Innovations in Visual Studio, .NET, Azure, and GitHub

Join us to dive deep into the latest capabilities across Visual Studio, Azure, GitHub, and the marvels of GitHub Copilot. This event offers an immersive experience with 35 speakers, including 20 from Microsoft, and 71 sessions spread over 13 tracks. Whether you’re a seasoned developer or just starting, there’s something for everyone.

Keynote Sessions at Visual Studio LIVE! 2024

Keynote by Scott Hunter: Introducing .NET Aspire – Cloud Native Development for .NET

One of the most anticipated sessions is Scott Hunter’s keynote on “Introducing .NET Aspire – Cloud Native Development for .NET.” .NET Aspire, which shipped during the Microsoft Build conference, transforms .NET into a modern cloud-native framework with support for Observability, Resiliency, Scalability, and Manageability. This keynote will show how to transform an existing application, demonstrate the new telemetry dashboard, create local resources and resources in the cloud, and run and deploy multi-part apps from the command line, VS Code, and Visual Studio. Don’t miss this opportunity to learn about our most exciting release in years!

Keynote by Asad Khan and Bob Ward: Building Applications with the Modern SQL Using AI and Microsoft Fabric

Another must-see session is the keynote by Asad Khan and Bob Ward on “Building Applications with the Modern SQL Using AI and Microsoft Fabric.” This session will cover the latest advancements in SQL products and services, showcasing how AI and Microsoft Fabric can enhance your applications and improve efficiency. Gain valuable insights from industry leaders on how to leverage these cutting-edge technologies to build powerful, modern applications.

Unique Networking Opportunities

Visual Studio LIVE! 2024 is designed to be intimate, with attendance capped at just 500. This setup provides you with unparalleled access to mingle directly with our speakers and product managers from Visual Studio, Azure, and GitHub. Engage in meaningful interactions and gain insights directly from the experts.

  • Meet The Experts Welcome Reception: On Tuesday (8/6) from 4:15 pm to 5:45 pm, join us for a casual expo-style event with food, beverages, and raffles. Meet Product Managers from Visual Studio, .NET, Azure, GitHub, and GitHub Copilot.
  • Meet The Visual Studio & .NET Team Reception: On Thursday (8/8) from 4:15 to 5:45 pm, connect with the actual tool makers of .NET Aspire & Blazor, GitHub Copilot Integration in Visual Studio, VS Extensibility, C# Dev Kit for VS Code, and more. Discuss specific features and get direct feedback from the developers who build these tools.

Image Blog Banner vslive

Exclusive Access and Benefits

Attendees will enjoy VIP access to the Microsoft Commons—a bustling hub of retail, dining, and entertainment exclusive to Microsoft employees. Additionally, you’ll receive passes to the Microsoft Employee Store, where you can score exclusive deals on the latest Microsoft products.

Two Full Days of Hands-On Labs

Go deeper into development topics with these excellent hands-on labs:

  • Application Building with .NET Aspire & ASP.NET Core 8 by Damian Edwards and David Fowler. Build distributed applications using the .NET Aspire stack and ASP.NET Core 8, covering new features in .NET 8 & C# 12.
  • Asynchronous and Parallel Programming in C# by Jeremy Clark. Master asynchronous programming in C# using the .NET Task Parallel Library (TPL) and learn techniques for running code in parallel.
  • Elevate Your Career with Python and AI by Eric D. Boyd. A two-day workshop starting with Python basics and advancing to AI and machine learning applications.
  • Build Modern Applications with Azure SQL Database and SQL Server by Jerry Nixon and Brian Spendolini. Deep dive into new features of Azure SQL and SQL Server, including JSON, Data API builder, REST endpoints, and ChatGPT/OpenAI.
  • Microsoft Blazor Top to Bottom by Jason Bock, Allen Conway, and Rockford Lhotka. Learn to build Blazor apps, use the Razor component model, data and event binding, and explore Blazor server, WebAssembly, and MAUI hybrid apps.

For the full list of hands-on labs, visit Visual Studio LIVE! 2024 Hands-On Labs.

Some of your favorite speakers from Visual Studio & .NET

  • Mads Kristensen: Visual Studio Tips & Tricks and Your Future is Bright with Visual Studio and AI
  • James Montemagno: What’s New & Next for .NET MAUI
  • Daniel Roth: What’s Next for ASP.NET Core & Blazor
  • Harshada Hole: Fast Focus: Visual Studio Debugging & Diagnostics: Tips & Tricks
  • Jessie Houghton: Fast Focus: Upgrade Your Git Game in Visual Studio 2022
  • Dalia Abo Sheasha: Lessons Learned Building AI-powered Features in Visual Studio
  • Rachel Kang: What’s New & Next for .NET MAUI

Click here for our complete list of amazing speakers, 31 in all!

Learn from the Best

The event will feature over 70 sessions, including hands-on labs and workshops, covering both introductory and advanced topics. This is your chance to accelerate your understanding of the latest technologies and bring back valuable knowledge to your team.

Hear from Past Attendees

Don’t just take our word for it. Here’s what past attendees have to say about Visual Studio LIVE!:

  • “The best thing about VS Live! was meeting Microsoft people.”
  • “The conference events and the reception sponsored by Microsoft were outstanding!”
  • “Learning about the direction of technology and Microsoft, and what others in the industry are doing, was invaluable.”
  • “Access to Microsoft staff and demonstrations of AI techniques by Microsoft presenters was a major highlight.”
  • “I appreciated the variety of courses and the expertise of the speakers and Microsoft reps.”

Register Now and Save

Visual Studio Professional & Enterprise Subscribers can unlock exclusive discounts by exploring your discount benefit on My.VisualStudio.com. Not a subscriber? No problem—grab the EARLY BIRD Discount on the Visual Studio Live! Event Page. Only 500 spots are available for this exclusive event, and we expect it to sell out, so don’t delay!

We look forward to seeing you at Visual Studio LIVE! 2024. Secure your spot now for an unforgettable week of learning, networking, and technological innovation.

The post Get Hands-On with Visual Studio and Azure: Live at Microsoft HQ this August! appeared first on Visual Studio Blog.

Making Visual Studio a bit more visual

$
0
0

Any web, desktop, or mobile developer works with images often. You reference them from C#, HTML, XAML, CSS, C++, VB, TypeScript, and even in code comments. Some images are local, and some exist online or on network shares, while others only exist as base64 encoded strings. We refer to them in numerous ways in code, but always as string values that don’t show us what the image looks like. Until now.

Image image hover preview hero

The feature request An option to preview images when they are hovered has gotten a lot of attention lately, so we decided to look into it. Various image previewers exist for different editors already, but they all do things a little differently. If we were to build this, we must do it in a way that feels native and natural to Visual Studio. We therefore launched a community experiment to figure it out.

The result is an editor tooltip that in the code editor. The tooltip shows the image in its original size but capped at maximum of 500 pixels wide and high. Below the preview image you’ll see the size in pixels and the file size in bytes.

Image image hover preview v1

The participants of the experiment were very excited about the feature. Here’s what some of them said:

Image Picture2  Image Picture3  

Image Picture4

We identified some important questions in need of an answer:

  1. What are the must-have image file types to support?
  2. Which image reference syntaxes and formats are most used?
  3. Which additional features could be important?

The experiment helped us answer these questions. Let’s go over them.

Supported file types

The most common image files used by participants of the experiment are (in order):

  • PNG – 53%
  • JPG – 21%
  • SVG – 15%
  • ICO – 4%
  • WebP – 4%
  • GIF – 2%
  • Other file types like BMP, TIFF, DDS

The only format not directly supported by WPF is SVG, so we must convert those to a bitmap format WPF can render. That’s why SVG support didn’t make it into the first version, but we hope to have it ready soon.

Reference syntaxes

There are various ways to reference an image and depend largely on the language and app model. The most common ones we saw from the experiment were:

  • Relative URL (./, ../, and /)
  • File path (c:\, c:/, \, and /)
  • Data URI (data:image/png;base64,…)
  • Pack URI (pack://application:,,,/Images/MyImage.png)
  • Image monikers (KnownMonikers.StatusWarning)

Additional features

The community suggested two features beyond simply showing the image preview.

  1. Zoom in on the preview This is a cool feature and one that would be great to investigate further for a future update. However, it is out of scope for now.
  2. Click preview image to open The idea is that users should be able to click the preview image to have it open in their default image viewer application. It was simple to add, so we did.

That was the story of how the image hover preview feature made it to Visual Studio. To try it yourself, install the latest version of Visual Studio 2022 (v17.10 or newer) and give it a go.


The post Making Visual Studio a bit more visual appeared first on Visual Studio Blog.

Three New Premium Visual Studio Subscriber Benefits Announced

$
0
0

A Visual Studio Subscription, whether Professional or Enterprise, delivers far more than just software usage rights; it’s a comprehensive toolkit designed to significantly boost your development capabilities and career growth. These subscriptions can save you thousands each year, offering everything from monthly Azure credits for cloud experimentation to complimentary access to premium training platforms like Pluralsight and LinkedIn Learning. You will also benefit from discounted rates on Azure Dev/Test pricing and significant savings at professional events like Visual Studio LIVE!

Before we explore the details of our three new exciting benefits, ensure you’re fully leveraging your Visual Studio Subscription. If it’s been a while, log in at my.visualstudio.com to review and activate your benefits, equipping you with all necessary tools and training to excel in the fast-paced tech environment.

Exclusive New Learning Paths for Visual Studio Subscribers

Image of new VSS Benefits 2024

Uncover special opportunities designed specifically for paid Visual Studio subscribers to keep you at the forefront of the rapidly evolving software development landscape. With the rapid emergence of AI tools like copilots, staying well-skilled is not just an option—it’s imperative.

These three new exclusive benefits are crafted to enhance your skills and ensure you’re well-equipped to leverage the latest advancements in Visual Studio, .NET, and Azure, helping your business maintain a competitive edge. Utilize these exclusive benefits to achieve annual savings exceeding $1,500, supporting your desire to stay informed of the latest advancements in technology and development practices. Here’s what’s new for you:

Dometrain Pro: Full Access to Premium Courses

  • Overview: Boost your technical expertise with Dometrain Pro. Gain unlimited access to over 380 hours of HD content covering everything from foundational programming to advanced development techniques, all curated to help you keep pace with industry changes.
  • Key Benefit: Enjoy a 50% discount on your subscription to Dometrain Pro for Visual Studio, granting you access to more than 36 comprehensive courses for a full year. This is an excellent resource for staying current and deepening your knowledge base.

Training by Tim Corey via DevPass Business Edition

  • Overview: Designed for developers at all career stages, DevPass Business Edition provides targeted, real-world training. This program, featuring renowned educator Tim Corey, includes courses that are directly applicable to daily development work and upcoming challenges in modern software practices.
  • Key Benefit: Take advantage of a 50% discount on DevPass Business and unlock all 28 courses and over 320 hours of HD training for a full year, ensuring your skills remain sharp and relevant.

Visual Studio LIVE! Events: Exclusive Subscriber Discounts

  • Overview: Engage with the latest in software development at Visual Studio LIVE! Events, available in-person and virtually. These professional development gatherings spotlight cutting-edge technologies and practical applications, with a particular emphasis on AI and cloud advancements. Gain insights that can transform how you and your business leverage new products and features to accelerate development and elevate your solutions in the market.
  • Key Benefit: Secure exclusive discounts on registrations, allowing you to gain invaluable insights from industry experts at a fraction of the usual cost. This is your gateway to learning about new features, tools, and strategies that can help your business partners achieve more.

ACCESS YOUR BENEFITS

Unlocking the full potential of your Visual Studio Subscription is straightforward and can significantly enhance your development experience. Here’s how you can start utilizing these opportunities today:

Access the Visual Studio Subscription Portal

  • Step 1: Navigate to my.visualstudio.com. This portal is your gateway to all the benefits available through your subscription.
  • Step 2: Log in using your Visual Studio credentials. If you’re uncertain about your account details, consult your subscription administrator at your company.

Understanding Your Subscription Level

  • Community: Ideal for individual developers, the Community edition provides access to essential tools and services to kickstart your development projects. Note, however, that access to premium benefits are not included.
  • Professional: Designed for professional developers, this subscription tier includes a more comprehensive array of tools and services. As a Professional subscriber, you’ll discover numerous benefits designed to enhance your productivity and broaden your skill set.
  • Enterprise: The most extensive subscription tier, tailored for teams and organizations aiming to leverage the full power of Visual Studio. Enterprise subscribers enjoy access to exclusive benefits, including advanced tools, services, and training opportunities that can make a significant impact on your business outcomes.

Some benefits are reserved for paid subscription levels, which includes: Visual Studio Enterprise (Standard), Visual Studio Enterprise subscription with GitHub Enterprise, Visual Studio Enterprise (Annual cloud), Visual Studio Professional (Standard), Visual Studio Professional subscription with GitHub Enterprise, and Visual Studio Professional (Annual cloud).

Explore Your Benefits

  • Each subscription tier offers unique benefits, varying significantly in terms of access and scope. Once logged in, dedicate time to explore the specific benefits associated with your subscription level. From software licenses and Azure credits to training modules and partner offers, each benefit is crafted to support different facets of your development work.

Take Action Today

  • We encourage all our subscribers to log in and explore their benefits today, while you’re thinking about it. By fully understanding and utilizing your benefits, you ensure that you are not only keeping pace with the latest technological developments but also securing a competitive edge in your projects and career.

Check out your full list of benefits, based on your subscription type by visiting my.visualstudio.com

The post Three New Premium Visual Studio Subscriber Benefits Announced appeared first on Visual Studio Blog.

Visual Studio tip: Using Ctrl-L to delete a line with and without Clipboard backup

$
0
0

Here is one Visual Studio tip from my colleague Gwyn Peña-Siguenza which I didn’t know about! Yes, even after 26 years using this fantastic tool, I am still discovering new features. So thanks to Gwyn for this!! This is all about deleting lines, and using the Windows Clipboard for support.

You can see the short video on our YouTube channel, and there is also a longer video with 20 must-know shortcuts here. Don’t forget to subscribe if you want to learn more tips!

Using the Clipboard History in Windows

One of my favorite tools on Windows is the Clipboard History. This feature was introduced in Windows 10 and is seriously adding productivity to my day-to-day. If you haven’t been using it, you need to enable it in the Windows settings. Simply follow the steps:

  • Go to the Windows Settings
  • Search for Clipboard settings
  • Enable “Clipboard History”

Image 2024 07 23 13 37 20
Windows Clipboard settings

To test that this works, try the following:

  • Copy one piece of text using Ctrl-C
  • Copy another piece of text using Ctrl-C again.
  • Press the Windows key and the V key together (Win-V)
  • This brings up a new window where you should be able to see the two entries you just copied at the top.

This enables you to copy multiple pieces of content in a document without having to always Ctrl-Tab back and forth between the original document and the target document. And the cool thing is that it even supports images!

Image 2024 07 23 13 44 48
Windows Clipboard history with two items of text and one image

Deleting a line with clipboard support

So why am I bringing this up? Well another thing that we do quite often in code is deleting lines. There’s even a joke that the best developers are not the one writing a lot of lines of code, but those who delete a lot of lines of code 🙂

In order to delete a whole line, most people would follow these steps:

  • Place the cursor on a line of code.
  • Move the cursor to the top of the line with the Home key.
  • If the line was indented, press Home once again to ensure that the cursor is really on column 0.
  • Press the Shift key.
  • With the Shift key pressed, move the cursor at the end of the line with the End key.
  • With the whole line selected, press the Delete button.
  • Probably you will also have to press Delete once more to delete then empty line.

This is a lot of steps for a simple operation that we do a LOT in a developer’s day. Thankfully you can simplify it.

  • Place the cursor on a line of code.
  • Press Ctrl-L.

That’s it. The line is deleted and there is no empty line remaining where it was. but the best part is, this line was saved in the Clipboard! To test this, simply press Win-V and you should see the line you just deleted on top of the history. Of course this also works for multiple lines.

Deleting a line without clipboard support

Now, sometimes you don’t want the deleted line(s) to be saved to the Clipboard history. In this case, follow these steps:

  • Place the cursor on a line of code.
  • Press Ctrl-Shift-L.

This way you can keep your Clipboard history tidy.

More tips about Visual Studio

Hopefully these tips help you to be more productive! And if you want to learn more about key shortcuts in Visual Studio, you should watch Gwyn’s 5:30 minutes video on the Visual Studio YouTube channel.

The post Visual Studio tip: Using Ctrl-L to delete a line with and without Clipboard backup appeared first on Visual Studio Blog.

Sign VSIX packages with Sign CLI

$
0
0

You can now leverage Sign CLI for a more secure, modern way to sign your Visual Studio extensions. Signing your VSIX packages improves security, prevents tampering, and builds trust with your users. This integration makes it easier and more convenient to sign your packages than ever before!

Screenshot of the VSIX Installer with the digital signature highlighted.

Sign CLI replaces the older VSIXSignTool with a modern, general purpose sign tool that’s actively maintained and kept up to date with the latest security standards. It supports cloud and local signing from a variety of sources and can also fit seamlessly into your CI pipeline for easy integration. Continue reading to learn how to enhance your extension publishing workflow by using Sign CLI!

Obtain a code signing certificate

To sign your VSIX, you’ll need a valid EV or standard certificate from a public certificate authority that utilizes SHA 256, SHA 384, or SHA 512 digest algorithms. Windows supports certificates from many popular certificate authorities, such as Certum, Comodo, DigiCert, GlobalSign, SSL.com, and more.

For a full list of trusted partners, please see https://aka.ms/TrustCertPartners.

Get ready to sign your extensions

To start using Sign CLI to sign your extension packages, you’ll first need to install it. It’s available as a dotnet tool on the nuget.org Gallery. To install, open Visual Studio’s integrated terminal using View > Terminal (or use the Ctrl+` shortcut), then use the commands below. Note that if you’re working outside of Visual Studio, you can access the Developer PowerShell by selecting Start in Windows then typing in “developer PowerShell”.

Install Sign CLI

The Sign tool is still a prerelease version, so you’ll need to include the `–prerelease` flag when you install to get the latest:

dotnet tool install sign --prerelease --global

To install a specific version, visit the versions tab on the Sign CLI page on nuget.org to find the version you’re interested in and use the following syntax:

dotnet tool install sign --global --version <version>

Offline installation

In the event you’re working in an isolated environment, you can download the Sign CLI NuGet package you want and install it using:

dotnet tool install --global --version <version> --add-source <path to folder> sign

Sign your VSIX using Sign CLI

Sign CLI supports cloud signing with Azure Key Vault or local signing using certificates and private keys stored in:

Once installed, you can use Sign CLI from a Visual Studio’s integrated terminal (View > Terminal).

For example, to sign a VSIX using a PFX file with a certificate and a private key, use a command like the following:

sign code certificate-store -cfp <SHA-256 fingerprint> -cf "D:\Certs\my.pfx" -d "VSIX Signature" -u "http://timestamp.acs.microsoft.com/" "C:\Users\Contoso\Downloads\FingerSnapper2022.vsix"

Or to sign a VSIX using the Microsoft Certificate Manager:

sign code certificate-store -cfp <SHA-256 fingerprint> -d "VSIX Signature" -u "http://timestamp.acs.microsoft.com/" "C:\Users\Contoso\Downloads\FingerSnapper2022.vsix"

For more detailed instructions, please visit our Signing VSIX Packages article where you can also find a breakdown of all of the command-line options for Sign.

Let us know what you think

As you use Sign CLI to sign your extensions, please use the Issues tracker on the Sign CLI GitHub repo to report any issues or bugs you experience. If you want to provide general feedback on extension signing or to suggest additional features, please create a feedback ticket at the Visual Studio Developer Community.

We’re excited to hear from you!

The post Sign VSIX packages with Sign CLI appeared first on Visual Studio Blog.

Introducing the revamped Attach to Process experience

$
0
0

One of the most powerful and frequently used features of Visual Studio is the Attach to Process dialog, which enables you to debug processes running on your machine or on a remote machine. For anything you could develop using Visual Studio, the Attach to Process dialog allows you to quickly attach the debugger to the processes you want to inspect and troubleshoot. While this feature has been around for a long time, its current design has room for modernization to better fit the latest versions of Visual Studio. Thus, we used this opportunity to improve the Attach to Process experience introducing a revamped and refreshed UI. Along with the new UI, we also took some time to introduce additional features users had requested and improved performance and accessibility.

Side to side comparison between the new and the old Attach to process dialog UI.

The first thing you may notice is that the new UI visual style was updated to be consistent with the rest of Visual Studio, as well as supporting dark mode or any other VS theme you are using. The refreshed layout is not just about looks—it’s designed to save space and reduce clutter. This means you can easily find and select the processes you want to debug, even when working with smaller window sizes. It’s a cleaner, more intuitive experience that keeps everything you need within easy reach.

What’s new in the Attach to Process dialog?

Following are the new features and improvements to the dialog:

  • Theming support: The dialog now adapts to your preferred VS theme.

Image showing both the dark themed and light themed versions of the new dialog.

Image showing both the dark themed and light themed versions of the new dialog.

  • Decluttering: We revamped the view to reduce clutter and give back vertical space. This includes having the connection information hidden as a tooltip and having the Code Type be selected through a combo box in the dialog, instead of requiring a separate window like the old dialog did.

Image demonstrating that hovering over the information icon next to the Connection Type combo box will show the connection information on a tooltip.

  • Introduced Local and Remote connection types: We added a new “Local” only connection type that simplifies the view when only debugging processes on your own machine. The existing “Default” connection was renamed into “Remote (Windows)”, as the new default connection is the Local one.
  • Improved performance: Rendering time of both the tree view and flat view of the processes was improved. This should be especially noticeable for the tree view.
  • Collapsible items in the Tree view: The dialog now allows you to collapse child processes shown in the Tree view. Helping you reduce clutter.

Animation showing how to collapse child processes on the tree view.

  • Persistence of columns positions and widths on the processes list: The dialog now remembers the positions and widths of the columns on the processes list. This way you don’t have to adjust them every time you re-open VS.
  • Integrated “Track Window” experience: When selecting a process using the Track Window toggle, any window you selected will be highlighted on the processes list. Allowing you to see its information before deciding to attach, or you can attach directly to it though a double click.
  • Buffered Text Search: The dialog now lets you start typing the name of the process you are searching as soon as the dialog opens and even before the processes are loaded. The dialog will buffer your input and apply it as soon as the processes are available, saving you some time in your workflow.

Other changes:

    • The search now supports wildcards, hexadecimal search, property filters and multiple process search.

Image of the add search filter UI shown on the search box dropdown menu.

    • Process icons are shown on the lists. (Local connection only)

An icon next to the cmd.exe process name as shown in the processes list.

    • Preview of the selected processes. You can double click on it to scroll to the selected process on the list.

A view of the text box containing the selected processes names including their process id's

    • The last attached process name is shown on the reattach menu item. (Only on VS 17.11)

A view of the reattach to process menu item showing the reattach process name next to it. eg. Reattach to Notepad.exe

Try it out and let us know what you think

The new Attach to Process dialog is available in Visual Studio 2022 version 17.10 and later. You can access it from the Debug > Attach to Process menu or by pressing Ctrl+Alt+P. We hope you enjoy using it and find it more productive and pleasant than the old one. If you have any thoughts or suggestions, please share them with us on the Developer Community site or just leave a comment below. Your feedback is very important to us.

Stay connected with the Visual Studio team by following us on Twitter @VS_Debugger, Twitter @VisualStudio, YouTube, and LinkedIn.

The post Introducing the revamped Attach to Process experience appeared first on Visual Studio Blog.


My Summer Experience as a SWE Intern at Microsoft

$
0
0

Hi everyone! I’m Serena, a rising 4th year at Rochester Institute of Technology with a major in Computer Science and a minor in Psychology. This summer I was a returning intern at Microsoft as a software engineering intern with the JavaScript and TypeScript Tooling team. In this blog post, I will be covering what it was like to work on language tooling and my overall experience as an intern at Microsoft.

Image of Serena in front of the Microsoft sign

What I Worked On

Over the summer, I worked on a toggle feature for inlay hints (that is additional information about source code that is rendered inline) in Visual Studio. The inlay hint feature supports multiple languages including Python, JavaScript, TypeScript and Razor. My project also involved working on a new settings page on the Tools/Options window for this feature. To complete this project, I had to ramp up on how the Language Server Protocol (LSP) works as well as researching on how a similar feature was integrated into Roslyn (a .NET Compiler Platform for C# and Visual Basic) and Visual Studio Code.

I majorly worked out of the Redmond office. During this summer, I worked closely with my mentor to understand the problem space and how the existing code base worked in relation to inlay hints. This also meant the start of my project was slower than expected. I had anticipated some unfamiliarity with the space I was working in but being thrown into multiple repositories at once felt unsurmountable at the start. With the help of my mentor, I was able to set out weekly deliverables to break the project into smaller chunks of exploration. In addition to this, I met with my manager weekly to give status updates and talk about my internship progression in general. The success of my internship is noted in all the conversations I had regarding development and inlay hints in its entirety. These conversations were cross-team efforts with the Visual Studio Editor team in the second half of my internship. The discussions shaped a lot of what the feature turned out to be (from the choice of a dropdown over checkboxes to the string choices of the settings) and were essential as this feature is going to be available in the next preview of VS! They also ensured I challenged not only my thoughts as a developer but also my introverted personality. I was pushed out of my comfort zone frequently to talk to various engineers off and on my team regarding various aspects of the project. Outside of my project, I got to sit in on triaging bugs and working through feedback tickets on the tooling experience which was insightful to see the connection between users and developers. I also attended multiple intern events, especially those organized for the Developer Division (DevDiv) interns and DevDiv Blacks at Microsoft (BAM) interns.

What I Learned

For the past 12 weeks, there’s been a steady flow of new information and while I was at Microsoft last summer, being on a different team brought new insights into what is possible and what happens at Microsoft. Some takeaways I’ve had from the summer have been:

  • The Language Server Protocol. From working on this project, I got to understand the connection between LSP and the individual language servers as well as the client (Visual Studio Editor).
  • The balance between experimenting and seeking help. Over the summer, I tried to find the perfect time to reach out for help and what I learned was there wasn’t a one size fits all solution. For each roadblock I hit, it took a different length of time to solve it and even if sometimes it was a simple fix, it was a fix I wouldn’t have come to without outside help. Other times, mulling over the problem for a couple of hours would get me a solution and new insights. An example of a roadblock I faced was in implementing the settings page. I was using a complex, outdated implementation for pages as a guide and got stuck when certain parts just did not translate to my scenario. After a couple of tries at making it work, I reached out to the Editor team and found out that was no longer the way they implemented new pages and was given a simpler page as a guide. Everything flowed more seamlessly from there on out. Without reaching out, I would have been stuck on that for way longer with no way forward.
  • Code reviews are not personal. Seeing all the comments come in for my first PR made me think “did I do anything right?”, and I had to work through realizing comments didn’t immediately equal the work I put out was trash or an indictment on my skills. Most of them turned out to be questions for clarification or optimization comments which didn’t mean my approach was wrong but there was a better way to do it.

What I Enjoyed

I enjoyed meeting other DevDiv interns and gaining insight from them on what their teams worked on. I also participated in the Intern Networking Program which was an easy and fun way to meet other engineers across Microsoft and learn about what’s happening in other teams and organizations. Connecting and participating in BAM events also really made my time here enjoyable – seeing a community of people that look like you and with whom you have shared identities is always something I look for in spaces I find myself in and finding that community in Microsoft has been great!

Outside of work, exploring the Seattle area (and enduring the weather here) has been interesting. Also having time to get back into some of my hobbies (reading and consuming an unhealthy amount of reality TV) has been appreciated. In all, the connections and time to take in a new city have been the highlight of the summer.

What’s Next

I accepted this offer last Fall and was very curious about what team and project I would end up working on, what the team dynamic would be, and how working alone on a project would be. I came in knowing next to nothing about language tooling but as I leave, I’m grateful for the experience, the work I got to do, and the people I’ve met along the way. I’m heading back to school for my fourth year and I’m leaving still curious about all the possibilities in this field. I had an amazing summer, and I hope I get to stay in touch with the people that helped make this a great experience!


The post My Summer Experience as a SWE Intern at Microsoft appeared first on Visual Studio Blog.

Visual Studio 2022 v17.11 – Your feedback in action

$
0
0

We are thrilled to announce the General Availability (GA) of Visual Studio 2022 version 17.11. This release is a testament to our commitment to listening to you, our developer community. Every enhancement, every fix, and every new feature in this release has been shaped by your feedback. Whether you’re building web, desktop, cloud, or gaming applications, Visual Studio 2022 v17.11 is designed to make your development experience smoother, faster, and more intuitive.

Visual Studio 2022

We heard you – loud and clear. From the most upvoted issues on our Developer Community Forum to the suggestions that came through in our feedback channels, this release is a direct response to your needs and priorities.

Alongside this release, we’ve also made significant improvements to our release notes. We’ve categorized the feature enhancements to make it easier for you to find exactly what’s new and relevant to your work. What’s more, we’ve linked each enhancement back to the original Feedback Ticket that inspired it, so you can see firsthand how your input directly shaped this release. This is part of our ongoing commitment to transparency and collaboration, ensuring that every update to Visual Studio reflects the needs and priorities of our developer community.

Productivity Enhancements

Your time is valuable, and with Visual Studio 2022 v17.11, we’ve made sure that every second counts. Here are some of the key productivity features that have been influenced by your feedback:

  • Find the Code You’re Looking For: Enhanced search capabilities to help you quickly locate the code you need, even in the largest projects.
  • More Meaningful Code Reviews: Improvements to code review workflows, making it easier to spot potential issues and collaborate with your team.
  • Updates to pull request creation: Continual improvements to the pull request creation experience.
  • Familiar keyboard shortcuts: Some common keyboard shortcuts now match those in other popular IDEs.

GitHub Copilot – Smarter and More Secure

GitHub Copilot has quickly become an indispensable tool for many developers, and with this release, it’s getting even better. Thanks to your input, Copilot now offers:

  • AI-Generated Breakpoint Expressions: Automatically suggest breakpoints based on your code, helping you debug more efficiently.
  • Understand Your Symbols: Improved symbol recognition to ensure you get the most accurate suggestions.
  • Refined Suggestions: More precise and context-aware code completions, reducing the need for manual edits.
  • GitHub Copilot is even more secure: GitHub Copilot Business customers to prevent specified files or repositories from being used to inform code completion suggestions made by GitHub Copilot.

Debugging & Diagnostics

We know that efficient debugging is crucial to your workflow. With v17.11, we’ve made several community-driven improvements:

  • Easier to Fix Async Exceptions: Improved handling and diagnostics for asynchronous code, helping you resolve issues faster.
  • Profile External Code with Ease: Enhanced profiling tools for better performance analysis, even with external code.
  • Improved Debugging on Arm64: Expanded support and optimizations for Arm64, ensuring a smooth experience on a wider range of devices.
  • Blazor WebAssembly debugging: A preview of the improved debugging experience for Blazor WebAssembly apps targeting .NET 9 or later.
  • Expressive IEnumerable Visualizer: The editable expression feature in the IEnumerable visualizer allows direct editing and visualization of LINQ expression in the Visual Studio debugger.

IDE & Workflow Enhancements

Your development environment should work for you, not against you. That’s why we’ve focused on making Visual Studio even more intuitive and responsive:

  • Never Miss Installing a Component: Streamlined component installation processes to ensure you always have the tools you need.
  • Stay Updated and Secure: New features to help you stay on the cutting edge, while keeping your environment secure and stable.
  • New Teams Toolkit templates: Teams Toolkit added new Teams app templates for a better Teams development experience.
  • Improved user authentication: Visual Studio now uses the Windows authentication broker otherwise known as WAM as the default authentication mechanism.

Web & Gaming Development Tools

For our web and game developers, we’ve introduced several updates to make your work easier and more efficient:

  • NPM Packages in Solution Explorer: Seamlessly manage your NPM dependencies directly within Visual Studio.
  • Discover dynamic Web API routes: The Endpoints Explorer has been updated to discover endpoints at runtime.
  • Unreal Engine Add Class Templates: Simplified template management to speed up your Unreal Engine development.

.NET & C++ Development

Our focus on .NET and C++ remains strong, with new tools and improvements to enhance your coding experience:

  • Revamped Resource Explorer: A more powerful and intuitive resource management tool for .NET developers.
  • Debug Your CMake Projects on Linux: Expanded support for C++ developers working in cross-platform environments.
  • Build Insights QoL Update: Adds various quality of life improvements to C++ Build Insights.

SHARE YOUR FEEDBACK AND STAY CONNECTED

As you use Visual Studio, let us know what you love, what you like, and where you’d like us to improve. You can share feedback with us via Developer Community: report any bugs or issues via report a problem and share your suggestions for new features or improvements to existing ones.

Stay connected with the Visual Studio team by following us on YouTube, Twitter, LinkedIn, Twitch and on Microsoft Learn.

As always, we appreciate the time you’ve spent reporting issues and hope you continue to give us feedback on how we’re doing and what we can improve.

The post Visual Studio 2022 v17.11 – Your feedback in action appeared first on Visual Studio Blog.

First preview of Visual Studio 2022 v17.12 with .NET 9

$
0
0

We’re excited to announce the availability of Visual Studio 2022 v17.12 Preview 1 – the first preview of our next update to Visual Studio. This update focuses on providing fantastic developer experiences for working with .NET 9 projects and new AI productivity features, along with continues improvements all-around. Download the preview and see the full list of enhancements in the release notes.

A close-up of a purple band Description automatically generated

.NET 9 + Aspire

.NET 9 elevates cloud-native and intelligent app development, focusing on productivity enhancements, streamlined deployments, and accelerated AI integration, ensuring superior performance for developers across various applications. And Visual Studio 17.12 fully supports .NET 9 development making it easy for you to take full advantage of all the improvements it has to offer.

Additionally, you’ll find updates to features around the IDE that make working with .NET and ASP.NET more delightful than ever.

AI productivity

With our ongoing commitment to radically increase developer productivity using AI, this update brings new improvements to GitHub Copilot that are unique to Visual Studio. By providing more context from the IDE, you’ll find more accurate suggestions using a more comprehensive knowledge of your solution. Combine that extra context with more fine-tuned code generation and you’ll find this update elevates your coding experience significantly.

We hope you enjoy this preview of Visual Studio, and we look forward to hearing what you think. You can share feedback with us via Developer Community, by reporting issues via report a problem and share your suggestions for new features or improvements to existing ones.

You can download the preview from our website or update it from within the IDE. Please note that you should not use this preview in production environments, and some extensions or workloads may not be compatible with it.

Thank you for using Visual Studio and happy coding!

The post First preview of Visual Studio 2022 v17.12 with .NET 9 appeared first on Visual Studio Blog.

Copilot Content Exclusion Now Available in Visual Studio 2022 17.11

$
0
0

We are excited to announce that Copilot Content Exclusion is now available in Visual Studio 2022 17.11. This feature allows your admins to configure Copilot to ignore certain files in a repository or organization, giving you enterprise control that ensures sensitive information is protected while seamlessly integrating trusted AI for efficient coding.

This will now be available for Completions, Inline, Chat, for GitHub Copilot for Business and GitHub Copilot for Enterprise customers. Content Exclusion is not limited to repos hosted on GitHub but also available for repositories hosted on other platforms, such as Azure DevOps.

How to Exclude Content

Organization administrators or repository owners can choose which files or paths are excluded. This will prevent Copilot from accessing excluded files. Learn how to enable this feature here.

How to Check if Your Content is Excluded

Copilot experiences where exclusions apply:

Copilot experiences
Completions Image Content Exclusion blogs completions

Verify if Content Exclusion is enabled on your file by checking the left side for the “Excluded” label.

Inline Chat Image Content Exclusion blogs inlineVerify if Content Exclusion is enabled in Inline Chat below the prompt box.
Chat Window Image Content Exclusion blogs chat

Verify if Content Exclusion is enabled for the specific file you referenced by checking the tip at the top of your prompt box in the Chat Window.

Please note that certain GitHub Copilot features in Visual Studio may be fully disabled if any file is excluded. We hope this new feature enhances your experience with GitHub Copilot in Visual Studio

We appreciate the time you’ve spent reporting issues/suggestions and hope you continue to give us feedback when using GitHub Copilot in Visual Studio on what you like and what we can improve. Your feedback is critical to help us make GitHub Copilot  the best tool it can be! You can share feedback with us via Developer Community: report any bugs or issues via report a problem and share your suggestions for new features or improvements to existing ones.

Stay connected with the Visual Studio team by following us on YouTube, Twitter, LinkedIn, Twitch and on Microsoft Learn.

The post Copilot Content Exclusion Now Available in Visual Studio 2022 17.11 appeared first on Visual Studio Blog.

New git tooling features

$
0
0

Visual Studio 2022 v17.11 includes fantastic updates to everyone working with Git. They bring the richness of both GitHub and Azure DevOps into Visual Studio and part of your natural workflow. This greatly simplifies your inner loop, making you even more productive than before. Download this update and see the release notes for all the details.

A computer screen shot of a program

Description automatically generated

More meaningful code reviews

We’ve made it easier to view your GitHub and Azure DevOps pull request comments directly in your working file in Visual Studio. You can now stay in your context, make necessary code changes, and interact with your colleagues’ suggestions without switching contexts to the browser.

Fix for CodeLens timeline

CodeLens timeline now respects the configuration of your timeline to show the correct information. This fix addresses an issue where the timeline was not honoring the months set in the file changes hover preview.

Updates to pull request creation

We’ve improved on the create a pull request experience with target branch selection, commit counts, and other stabilization fixes. Additionally, we now automatically create links to work items that have been mentioned in commits that are part of the pull request. We also draft pull requests which was one of the top requests.

We hope you enjoy this update to Visual Studio, and we look forward to hearing what you think. You can share feedback with us via Developer Community, by reporting issues via report a problem and share your suggestions for new features or improvements to existing ones.

Stay connected with the Visual Studio team by following us on Twitter @VS_Debugger, Twitter @VisualStudio, YouTube, and LinkedIn and on Microsoft Learn.

Thank you for using Visual Studio and happy coding!

The post New git tooling features appeared first on Visual Studio Blog.

New debugging and diagnostic features

$
0
0

Debugging and diagnostics are vital skills for any developer, but they can also be difficult and time-consuming to get proficient . That’s why we’ve added some fantastic new features and enhancements to Visual Studio 2022 v17.11 that will help you find and resolve bugs faster and easier than ever before. Here are some of the highlights. Download this update and see the release notes for all the details.

Debugging

Break on async method exceptions

Debugging asynchronous code, especially in frameworks like ASP.NET, can be tricky due to the potential for exceptions to be thrown across asynchronous boundaries.

Now, with Visual Studio Debugger it automatically breaks when an async Task method throws an exception back to framework code.

AI-generated breakpoint expressions

AI-generated expressions for conditional breakpoints and tracepoints are now supported in C++. GitHub Copilot analyzes your code and offers insightful breakpoint expressions, streamlining your debugging process.

Debug AnyCPU applications manifested to run as arm64

Visual Studio natively supports building and debugging Arm64 apps on Arm-based processors. Unfortunately, applications built with the AnyCPU setting running on an Arm64 machine will default to using x64 emulation. While the capabilities of the x64 emulator have expanded, the most efficient Arm CPU scenarios are supported when applications are running natively.

To better support the intended native behavior the Windows 24H2 update introduces a new <supportedArchitectures> setting for your App manifest files. .NET developers can include a list of supported architectures (amd64 or arm64), explicitly signaling that an application built with the AnyCPU setting should run natively using the Arm64 CLR on Arm64 devices.

Blazor WebAssembly debugging

This release features a preview of the improved debugging experience for Blazor WebAssembly apps targeting .NET 9 or later.

Organize your breakpoints with default breakpoint groups

Breakpoint groups allow you to customize and toggle breakpoints for faster and more effective debugging.

You can now mark the selected breakpoint group as the default, ensuring all newly added breakpoints are automatically included in that group.

Edit and visualize LINQ expressions in the IEnumerable visualizer

The Visual Studio debugger now offers an editable expression feature in the IEnumerable visualizer, a powerful enhancement for developers working with collections.

Improved performance of conditional breakpoints in C++

We have significantly enhanced the performance of conditional breakpoints in C++ through a reworked implementation.

Our initial assessment shows a performance improvement of at least 35% in version 17.10 and 70% in version 17.11, reducing execution time from 80 seconds to 21 seconds over 80,000 iterations.

Profiling

Keep your target selection in the instrumentation tool between runs

The instrumentation tool now persists the target selection between runs offering a significant benefit by enhancing the continuity of profiling sessions.

With this improvement, you can maintain your specified target across multiple instrumentation runs, removing the need for repetitive selection tasks.

Decompile .NET assemblies

Visual Studio profiler now offers auto-decompilation for .NET libraries in scenarios where source code is unavailable. By automatically decompiling code during source lookup, even without loaded symbols or exact file locations, you can gain insights into the code’s structure and performance issues.

With this new feature, while visualizing a collection or dataset, you can directly edit the expressions textbox on the top of the dialog with your desired LINQ expressions. The visualizer updates in real-time, reflecting the data change resulting from your query.

We hope you enjoy this update to Visual Studio, and we look forward to hearing what you think. You can share feedback with us via Developer Community, by reporting issues via report a problem and share your suggestions for new features or improvements to existing ones.

Stay connected with the Visual Studio team by following us on Twitter @VS_Debugger, Twitter @VisualStudio, YouTube, and LinkedIn and on Microsoft Learn.

Thank you for using Visual Studio and happy coding!

The post New debugging and diagnostic features appeared first on Visual Studio Blog.

New C++ features in Visual Studio v17.11

$
0
0

Visual Studio 2022 version 17.11 is here and comes with a host of new features for C++ developers. We’ve made improvements across our toolchain, Unreal Engine support, Build Insights, CMake debugger, and more. This post gives a quick overview of what’s available; for all the details, see What’s New for C++ Developers in Visual Studio 2022 17.11 on the C++ blog.

Standard Library

The three main areas of improvement in this release are in formatted output, vectorization, and diagnostics. For formatted output, we’ve implemented parts of Formatting Ranges and all of Printing Blank Lines with println. Our vectorization improvements hit over a dozen of the standard algorithms, and we’ve improved the diagnostics of common misuses of std::ranges::to and std::get(std::tuple). See the STL changelog for all the details.

CMake Debugger

We have added support for the CMake debugger in CMake projects targeting Linux via WSL or SSH. The CMake debugger allows you to debug your CMake scripts and CMakeLists.txt files through the Visual Studio debugger.

To start a CMake debugging session, set a breakpoint in your CMakeLists.txt file and then navigate to Project > Configure Cache with CMake Debugging.

CMake debugger Linux

Unreal Engine Support

We’ve added several new features for Unreal Engine developers:

  • An Unreal Engine toolbar that provides quick access to Unreal Engine actions such as attaching to UE processes and accessing the UE log
  • An Add Class dialog for adding common UE class templates to your project
  • An Add Module dialog for adding UE modules to your project

Unreal Engine Add Class

Build Insights

In this update, we added quality of life changes to C++ Build Insights integration. You can now filter your Build Insights trace results by project. For results in each row, you will now see the relative path and file name instead of the full path. We have also improved the grouping of results in the Included Files view.

Build Insights QoL Update

Breakpoint Performance

We have significantly enhanced the performance of conditional breakpoints in C++ through a reworked implementation.

Beginning with version 17.11, our initial assessment finds that execution time is almost four times as fast, reducing execution time from 80 seconds to 21 seconds over 80,000 iterations.

Summary

We hope this has given you a taste of what’s new. For all the details, see What’s New for C++ Developers in Visual Studio 2022 17.11 on the C++ blog.

We are very much interested in your feedback. The comments below are open. Feedback can also be shared through Visual Studio Developer Community. You can also reach us on Twitter (@VisualC), or via email at visualcpp@microsoft.com.

The post New C++ features in Visual Studio v17.11 appeared first on Visual Studio Blog.


Enhancing Code Comprehension: GitHub Copilot’s Features in Visual Studio 2022 17.11

$
0
0

GitHub Copilot in Visual Studio 2022 17.11 now offers an improved experience you to refer to their methods, classes, functions, and entire solution directly within the chat. By using the # symbol followed by the name of a method, class, or function, or by referring to your solution with @workspace, you can provide specific context that helps GitHub Copilot better understand their code and the problem at hand.

Refer to your solution

GitHub Copilot Chat now allows you to refer to your entire solution. This feature helps provide an even deeper understanding of your solution to get the best results. To refer to your solution, simply use the @workspace and Copilot will answer high level questions about your solution, files and how they work together.

Image workspace

Try asking GitHub Copilot Chat questions like:

  1. @workspace What project can I run in my solution?
  2. @workspace In my workspace, where is #methodname referenced?
  3. @workspace Where does serialization occur in my solution?


Reference your methods, classes, functions

GitHub Copilot Chat now allows you to refer to your methods, classes, and functions inline. By referring to methods, classes, and functions directly within the chat, you can provide specific context that helps GitHub Copilot better comprehend your code and the problem at hand. This feature empowers you to provide richer context to GitHub Copilot, enabling it to deliver more precise responses by gaining a deeper understanding of your codebase.

Image copilot symbols

Try asking GitHub Copilot Chat questions like:
  1. I have a test method named #methodName. How can I ensure that it’s being executed correctly?
  2. What are some optimizations that could be applied to #methodName?
  3. How does #methodName1 use #methodName2 and what issues should I look out for?
  4. /explain #methodName


Search the web in Copilot Chat

GitHub Copilot now includes context from your entire repository & can search the web.

GitHub Copilot Enterprise subscribers in Visual Studio can now use GitHub Copilot Chat to get answers enriched with context from their entire repository and Bing search results.

Image githubagent

Get answers from across your entire codebase

GitHub Copilot Chat can now answer questions with understanding of your full repository, not just the tabs you have open. Index your repository on GitHub.com, and then ask a question mentioning @github. You can ask questions like @github where is rate limiting implemented?

Search with the context of the web

GitHub Copilot chat can also search Bing to find information outside of its general knowledge or your codebase. When you mention @github, GitHub Copilot will intelligently decide when to use Bing. You can ask questions like @github what is the latest LTS version of .NET?

Bing search is only available if enabled by an administrator – for more details, see Enabling GitHub Copilot Enterprise features or read the docs.

Try it out today!

We hope you enjoy this new feature in GitHub Copilot for Visual Studio! Your feedback is important to us, so please share your thoughts using the thumbs up or down in the Chat, or by visiting the Developer Community. We look forward to hearing from you!

Image send us feedback

Happy coding!

We appreciate the time you’ve spent reporting issues/suggestions and hope you continue to give us feedback when using GitHub Copilot in Visual Studio on what you like and what we can improve. Your feedback is critical to help us make GitHub Copilot  the best tool it can be! You can share feedback with us via Developer Community: report any bugs or issues via report a problem and share your suggestions for new features or improvements to existing ones.

Stay connected with the Visual Studio team by following us on YouTubeTwitterLinkedInTwitch and on Microsoft Learn.

The post Enhancing Code Comprehension: GitHub Copilot’s Features in Visual Studio 2022 17.11 appeared first on Visual Studio Blog.

New IDE features in Visual Studio v17.11

$
0
0

In Visual Studio 2022 v17.11, you’ll discover several new features that address specific issues developers have reported. These updates don’t belong to a distinct category, but we’re dedicated to sharing them with you in this blog post. You can download the update and view the comprehensive release notes for full details.

Find the code you’re looking for

Do you ever feel like you’re seeing too many results in code search? Narrow down your focus with the newly added scoping options in Code Search.

A screenshot of a computer

For the default code search experience and each filter, you can now set the scope to Entire solutionCurrent project, or Current document and toggle inclusion of external files.

You can set different scopes for different filters. For example, the default experience can be set to look through Entire solution and members can be set to look through only current document. Your selections will be preserved past the current session.

Familiar keyboard shortcuts

When moving between different IDEs and editors, it can be frustrating to have to relearn keyboard shortcuts. We’ve made some changes to some default keyboard shortcuts to make them more familiar and to preserve your muscle memory.

Toggle line comments

You’ve been able to toggle line comments in Visual Studio for a long time, but the default keyboard shortcut was Ctrl+K, Ctrl+/. We’ve now added Ctrl+/ as an alternative shortcut, which is the default in many other IDEs and editors.

A computer screen shot of text

Description automatically generated

Open Command Palette

Or Feature Search as it’s called in Visual Studio. The default keyboard shortcut for this feature is now Ctrl+Shift+P, which should be familiar to VS Code users for opening the Command Palette.

A screenshot of a computer

Description automatically generated

Never miss installing a component

Many teams use *.vsconfig files to standardize their teams’ Visual Studio installations. The *.vsconfig files can be placed in a repo or a project’s solution directory, and Visual Studio will automatically detect if components specified in the *.vsconfig file are missing.

A screen shot of a computer program

Description automatically generated

If any are missing, then a notification such as the one pictured below will appear.

A screenshot of a computer

Description automatically generated

We’ve made two improvements to this experience in Visual Studio 2022 version 17.11 Preview 1.

  1. First, Visual Studio can now detect if any local or network hosted extensions are missing from the installation, and if so, it’ll prompt you to install them. Previously, with respect to extensions, Visual Studio was only able to recognize if marketplace extensions were missing.
  2. Secondly, Visual Studio will now re-prompt the notification in certain situations, such as if the *.vsconfig file has changed because new components or extensions get added to it. Previously, the notification would only pop until you acted upon it, at which point it would be suppressed forever.

Improved user authentication

Visual Studio now uses the Web Account Manager (WAM) as its main authentication mechanism. This integration not only streamlines the authentication experience for Visual Studio, but it also enhances the security of your credentials.

Here’s how the new WAM experience looks like:

A screenshot of a computer

Description automatically generated

How does this impact your experience?

Using WAM as the default authentication experience has many benefits, including:

  • Windows integration: In addition to reducing the overall number of authentication prompts, you can now select existing Windows accounts instead of repeatedly entering credentials.
  • Better token protection: Refresh tokens are better secured as they are now device bound.
  • Support for the latest security features:
    • Leverage rich OS capabilities such as Windows Hello & FIDO keys.
    • Access the latest and greatest Microsoft Entra ID capabilities and conditional access policies.

New Teams Toolkit templates

Teams Toolkit now offers an empty Teams template for you to connect with your existing projects or use it as a starting point for new Teams apps.

  • Start with this empty template to create a Teams app.
  • If you want to add Teams capability to your existing project, add Empty Teams App to your project and then connect two projects by making simple edits follow https://aka.ms/Config-Teams-app.

A screenshot of a computer

Description automatically generated

Teams Toolkit supports authentication for Search Results from API Message Extensions app.

A screenshot of a black computer

Description automatically generated

We hope you enjoy this update to Visual Studio, and we look forward to hearing what you think. You can share feedback with us via Developer Community, by reporting issues via report a problem and share your suggestions for new features or improvements to existing ones.

Stay connected with the Visual Studio team by following us on Twitter, YouTube, LinkedIn, and on Microsoft Learn.

Thank you for using Visual Studio and happy coding!


The post New IDE features in Visual Studio v17.11 appeared first on Visual Studio Blog.

C++ Gaming Productivity Update for Visual Studio 2022 version 17.11

$
0
0

Introduction

In Visual Studio 2022 version 17.11, you will find brand new productivity enhancements for your game development workflows. From faster conditional breakpoints to a swath of Unreal Engine enhancements, we have added various productivity boosters based on your feedback. Once again, thank you for sharing Developer Community feedback and answering our surveys. Your valuable feedback continues to drive the direction of the Visual Studio gaming team.

General C++ Game Development

Supercharge Your IntelliSense Performance

We have received feedback from AAA developers about IntelliSense performance. While we have improved performance over the past releases, we understand that these performance improvements may be less impactful for large C++ projects.

Here are some helpful tips to further boost the power for Visual Studio’s IntelliSense for developers with powerful hardware:

  • Ensure 64-bit IntelliSense is activated.
    • Enable 64-bit IntelliSense is activated.
  • Adjust your memory limits (in MB) to reflect your hardware.
    • Adjust your memory limits (in MB) to reflect your hardware.

Faster Conditional Breakpoints

In version 17.11, you will see a significant improvement in performance for conditional break points. Our initial assessment found that execution time is almost four times as fast, reducing execution time from 80 seconds to 21 seconds over 80,000 iterations.

Build Insights Quality of Life Improvements

We have added several quality-of-life enhancements to Build Insights. Starting in version 17.11, you can now group your results by project, view the relative path and file name in place of the full path, and see a better grouping of results in the Included Files view.

path and file name in place of the full path

Unreal Engine Integration

Adding Unreal Engine Classes, Modules, and Plugins

In Visual Studio 2022 version 17.11, you can now add Unreal Engine class templates, modules, and plugins. These new productivity features are available for both vcxproj and uproject.

To get started, right-click on your project in Solution Explorer and select Add > Unreal Engine Item.

right-click on your project in Solution Explorer and select Add - Unreal Engine Item

In the revamped Add New Item dialog, you can select several new choices.

Add New Item dialog, you can select several new choices.

Unreal Engine Classes

Based on your feedback, we have added additional Unreal Engine class templates. You can now find the common class templates in Visual Studio’s Add New Item dialog just as you would find in the Unreal Engine Editor. The new dialog provides a list of common Unreal Engine class templates that you can add to your project. You can also now add your class to a module of your choice.

You can now find the common class templates in Visual Studio’s Add New Item dialog just as you would find in the Unreal Engine Editor.

Unreal Engine Module

You can now also add an Empty Unreal Engine Module using the Add New Item dialog.

A screenshot of a computer Description automatically generated

Unreal Engine Plugin

Lastly, you can now add an Unreal Engine Plugin to your project through the Add New Item dialog.

A screenshot of a computer Description automatically generated

Unreal Engine Toolbar

To further streamline our integration with Unreal Engine, we have added the Unreal Engine toolbar in Visual Studio 2022 version 17.11. The toolbar contains new productivity features and shortcuts to existing integration.

A screenshot of a computer Description automatically generated

  • The play icon and the dropdown work in tandem to quickly attach to processes while debugging. With the Unreal Editor running, you will see Unreal Engine related processes. Selecting one of the choices will allow you to easily attach to the process to start a debugging session. Additionally, you can type any process name to quickly attach to that process.
    • A screenshot of a computer Description automatically generated
  • The start and stop button will control the Unreal Engine integration server, used for the Unreal Engine Test Adapter. The server runs as a background process that automatically updates your test information. If you have the Unreal Engine Test Adapter option active, the server will automatically start upon opening your UE project.
  • The Rescan Blueprints button will refresh your Unreal Engine Blueprint references.
  • The Unreal Engine Log button is a shortcut to open the Unreal Engine Log window, in case you close it accidentally.
  • The Configure Tools for Unreal Engine button is a shortcut to launch the Unreal Engine Integration Configuration window. The configuration page gives you an overview of the Unreal Engine Integration status and gives you help if certain integrations were not configured properly.

Blueprints Update

We received feedback asking to improve the process of setting up Blueprint references in Unreal Projects. Starting in Visual Studio v17.10, you will no longer need the Unreal Engine Plugin “Visual Studio Integration Tool” to view Blueprint references. Blueprint references will automatically show up if you have the “Visual Studio Tools for Unreal Engine” component installed.

Send us your feedback

We hope you enjoy this update to Visual Studio, and we look forward to hearing what you think. You can share feedback with us via Developer Community, by reporting issues via report a problem and share your suggestions for new features or improvements to existing ones.

Stay connected with the Visual Studio team by following us on TwitterYouTubeLinkedIn, and on Microsoft Learn.

Thank you for using Visual Studio and happy coding!

The post C++ Gaming Productivity Update for Visual Studio 2022 version 17.11 appeared first on Visual Studio Blog.

New GitHub Copilot features in Visual Studio 2022 17.11

$
0
0

Visual Studio 2022 17.11 now brings exciting advancements from GitHub Copilot! This release significantly improves how GitHub Copilot integrates into your development workflow, offering smarter and more intuitive coding assistance.

Discover the new GitHub Copilot features in Visual Studio, such as enhanced context understanding, improved code completions, and AI insights for debugging and naming. These updates aim to boost your productivity and efficiency in coding. To try these new features, download the update, make sure to activate your GitHub Copilot account and check out the release notes for more detailed information.

GitHub Copilot is getting smarter

GitHub Copilot Chat now enables you to reference your complete solution, which allows you to gain an even deeper, holistic understanding of your solution to get better results! To reference your solution, simply use @workspace, and Copilot will respond to high-level questions regarding your solution, files, and their interactions.

To reference your solution, simply use @workspace,

Additionally, GitHub Copilot Enterprise users in Visual Studio can now use @GitHub to get answers enriched with context from their entire repository and Bing search results.

GitHub Copilot Enterprise users in Visual Studio can now use @GitHub to get answers enriched with context from their entire repository and Bing search results.

Naming things made easy

GitHub Copilot can now generate naming suggestions for your C++ identifiers (variables, methods, or classes) based on how your identifier is being used and the style of your code.

Picture showing other naming options for "property"

To try it out, you’ll need an active GitHub Copilot subscription. Navigate to any variable you wish to rename, right-click -> Rename (Keyboard: Ctrl+R, Ctrl+R). You’ll notice a GitHub Copilot sparkle icon that you can click or toggle to generate naming suggestions.

AI-generated breakpoint expressions

AI-generated expressions for conditional breakpoints and tracepoints are now supported in C++. GitHub Copilot analyzes your code and offers insightful breakpoint expressions, streamlining your debugging process.

AI-generated breakpoint expressions

When you place the cursor in the condition text for a conditional breakpoint/tracepoint in the breakpoint settings window, GitHub Copilot will instantly generate AI-based expression suggestions tailored to your code. You can choose the condition that best suits your needs.

Understand your symbols with GitHub Copilot

We’ve integrated GitHub Copilot into the tooltip on hover over symbols to provide AI-generated summaries of the selected symbol. This is available for both C# and C++ developers.

tooltip on hover over symbols to provide AI-generated summaries of the selected symbol.

This feature assists developers in understanding descriptions of various symbols at different invocations within their codebase. By hovering over a symbol and selecting the ‘Tell me more’ option, GitHub Copilot can generate documentation for the selected symbol.

Refine your GitHub Copilot suggestions

In Visual Studio 17.11, you can now refine code completions by adding context or asking questions without accepting them first. This update allows you to modify and retry GitHub Copilot’s suggestions before having to accept, saving you the hassle to accepting and refining again! Just press Alt+/ to modify, or if you’re happy with the suggestion, press tab to accept.

Image completions to inline

GitHub Copilot is even more secure

Introducing GitHub Copilot Content Exclusion, a new feature that allows admins to Copilot to ignore specific files in a repository or organization, ensuring sensitive information is protected while using AI for efficient coding. This applies to Completions, Inline, Chat, for GitHub Copilot for Business and Enterprise users. Additionally, exclusions also apply to other non-chat features, like rename suggestions and hover text. Additionally, content exclusion works with repos on platforms other than GitHub, including Azure DevOps.

exclusions also apply to other non-chat features, like rename suggestions and hover text

We hope you enjoy this update to Visual Studio and all the new developments happening within GitHub Copilot, and we look forward to hearing what you think. You can share feedback with us by using the thumbs up or down within the Chat, via Developer Community, by reporting issues via report a problem and share your suggestions for new features or improvements to existing ones.

Stay connected with the Visual Studio team by following us on Twitter, YouTube, and LinkedIn and on Microsoft Learn.

Thank you for using Visual Studio and happy coding!

The post New GitHub Copilot features in Visual Studio 2022 17.11 appeared first on Visual Studio Blog.

Enhancing your Visual Studio authentication experience

$
0
0

The current cyber security climate demands that applications not only provide outstanding features but also prioritize the security of user data. Applications like Visual Studio rely on token-based authentication to access resources on your behalf. While effective, token-based authentication can be susceptible to attacks if not properly protected. Today, we are happy to announce that starting with the Visual Studio 17.11 update, we are helping better protect your credentials by making the Windows authentication broker, also known as WAM (Web Access Manager), the default authentication method for Visual Studio 2022.

A screenshot of a computer

Description automatically generated

Benefits of Using WAM

Enhanced Security

One of the most significant advantages of WAM is the enhanced security it offers you. By supporting conditional access policies that create a cryptographically secure tie between the token and your device, WAM helps mitigate common vulnerabilities associated with token-based authentication. In addition, WAM can leverage rich OS capabilities such as Windows Hello & FIDO (Fast ID Online) keys to streamline your experience while helping ensure your credentials are better protected against bad actors.

Simplified User Experience

Beyond enhancing your security, WAM seamlessly integrates with the Windows account infrastructure, helping to provide you with a consistent and reliable authentication experience across your applications.

This integration helps reduce the overall number of authentications prompts you see inside Visual Studio and allows you to leverage your accounts without having to remember and constantly re-enter your credentials.

Getting started with WAM

To begin leveraging the benefits of WAM, ensure that your Visual Studio is updated to version 17.11 or later. Once updated, WAM will be enabled by default, and you can start experiencing the enhanced security and productivity it offers.

You can validate that WAM is enabled by opening the Accounts settings under Tools > Options:

Select web authentication broker from the dropdown.

Check our docs for additional details regarding using WAM inside Visual Studio 2022.

Let us know about your experience

We continue to prioritize the security and usability of Visual Studio and are committed to providing the tools and resources you need to build secure, high-performing applications.

We look forward to sharing more about what’s next for security. In the meantime, we hope that you enjoy the new WAM authentication experience in Visual Studio and that it makes your development workflow more productive.

If you experience any issues or have feedback, please let us know by using the Report a Problem tool in Visual Studio or by posting on the Developer Community or in the comments below. We value your input, and we are always working to improve Visual Studio based on your needs and suggestions.

Thank you for using Visual Studio and happy coding!

The post Enhancing your Visual Studio authentication experience appeared first on Visual Studio Blog.

Viewing all 1144 articles
Browse latest View live


<script src="https://jsc.adskeeper.com/r/s/rssing.com.1596347.js" async> </script>