Quantcast
Channel: Visual Studio Blog
Viewing all 1144 articles
Browse latest View live

Incorporate GitHub Copilot into your daily flow

$
0
0

Streamlining Workflow with GitHub Copilot 

Have you ever received code completions that are too large to manage or ones that need slight tweaks, but you must accept all the code to make those changes? To address these pain points, in Visual Studio 17.11 we’ve introduced a new feature that allows you to refine your completions by adding extra context or asking clarifying questions. Now, you can move directly into Inline Chat and view the suggested code in a more accessible way, without having to accept and modify everything in the editor.

Refining GitHub Copilot Completions with Inline Chat

Image completionstoinline

You now have more control over the suggestions provided by GitHub Copilot. Instead of merely accepting or ignoring a suggestion, you can now modify and retry! This feature allows you to fine-tune the suggestions given by GitHub Copilot, by adding context or tweaking the suggestion.

Image newinlinerefinement

Promoting Inline Chat to the Chat Window for More Context

Preserve the history of your Inline Chat by promoting it to the Chat Window. This feature enables you to maintain a record of the conversation and continue the Chat Window at your convenience on a larger screen. To do this, simply select ‘Continue in chat window…’.

Image continuetochat

We’ve adjusted the length of responses from Copilot to ensure they are easily accessible and readable in Inline Chat. When you want to learn more or expand, you can switch to the Chat Window for a larger screen real estate. This will easily enable you to refer back to things later and chat outside of the context of your file.

Understand your symbols right from your editor

GitHub Copilot can now help you understanding descriptions of various symbols at different invocations within their codebase right from your editor. and select Generate Copilot summary to get provide AI-generated summaries of the selection. This is available for both C# and C++ developers.

Image ontheflydocs

Leveraging LLMs, GitHub Copilot enhances existing or lacking code documentation by providing insightful explanations and context within hover tooltips.

(Coming Soon) Fix code with GitHub Copilot

Now integrated into the lightbulb and error list, GitHub Copilot provides fixes and explanations for code issues in both C# and C++ development. This feature helps developers understand and resolve various code issues within their codebase. By invoking the lightbulb and selecting Fix with Copilot, GitHub Copilot will open inline chat with an explanation and available fix. Additionally, selecting the Copilot icon from the error list will take you to the chat panel with an explanation and available fix.

Image lightbulbtofix

Leveraging LLMs, GitHub Copilot enhances code fixes by providing insightful explanations and solutions directly within the lightbulb and error list.

These changes make it easier to refer back to previous conversations and continue discussions outside of your file. We hope this new feature enhances your experience with GitHub Copilot in Visual Studio. As always, we value your feedback and look forward to hearing your thoughts. Please use the thumbs up and down in chat to provide feedback.

Image send us feedback

We hope you enjoy this update to Visual Studio and all the new developments happening within GitHub Copilot, and we look forward to hearing what you think. You can share feedback with us by using the thumbs up or down within the Chat, via Developer Community, by reporting issues via report a problem and share your suggestions for new features or improvements to existing ones.

Stay connected with the Visual Studio team by following us on TwitterYouTube, and LinkedIn and on Microsoft Learn.

Thank you for using Visual Studio and happy coding!

The post Incorporate GitHub Copilot into your daily flow appeared first on Visual Studio Blog.


Easily dock and float tool windows

$
0
0

You’re in the middle of a debugging session, attempting to chase down that one issue that is causing you trouble. In the heat of the moment, you grab a tool window and drag it out of its docked position – purely by accident. You didn’t mean to drag it, but sometimes when you move the mouse around, things like that happen. Your full attention now shifts from debugging to trying to get the tool window back to where it was.

Sounds familiar? Here’s something that will help.

A screenshot of a computer Description automatically generated

There is a little-known feature that will move a tool window between its last known docked location and last known floating location. Holding the Ctrl key while double-clicking the tool window header toggles the location back and forth.

This is useful for more than just accidental dragging, and I find that it comes in handy on a weekly basis myself.

I hope this will both lessen some frustration and make you more productive.

Happy coding!

The post Easily dock and float tool windows appeared first on Visual Studio Blog.

Supercharge C++ Debugging with AI-Generated breakpoint expressions

$
0
0

Have you ever spent hours debugging your C++ code, struggling to set up the right conditional breakpoint or tracepoint? Or wished for a smarter way to obtain detailed runtime information without manually crafting complex expressions? You’re in luck! With Visual Studio 2022, the latest GitHub Copilot feature now offers AI-generated expressions for both conditional breakpoints and tracepoints, available from C# 17.10 and now extended to C++. With these AI-generated conditional breakpoints and tracepoints, you can now automate the creation of intelligent expressions tailored to your specific debugging needs, significantly speeding up the process and enhancing your ability to diagnose and resolve issues.

Image of a conditional expression being set on the breakpoint

What are conditional breakpoints and tracepoints?

Conditional breakpoints and tracepoints are powerful debugging tools that enhance your ability to control and monitor code execution. A conditional breakpoint pauses execution only when a specified condition is true, making it ideal for targeting specific scenarios. For example, you can halt code only when a variable exceeds a certain value or a function is called with particular parameters, while a Tracepoints enable logging of messages to the output window or a file without interrupting code execution and replaces traditional ‘printf’ statements, offering detailed runtime insights without the need for code recompilation.

These tools are invaluable for identifying bugs, testing various scenarios, and tracking variables and expression values without manually stepping through each line of code. However, crafting the correct expressions for conditional breakpoints or tracepoints can be challenging and time-consuming, especially when remembering the correct syntax in complex codebases.

Fortunately, with GitHub Copilot you have the flexibility to choose from predefined conditions that suit your needs or to define custom conditions for precise and efficient debugging.

How can AI-generated expressions help you debug faster?

Visual Studio 2022 integrates with GitHub Copilot, AI-powered code completion tool that suggests lines of code or entire functions, effectively acting as a pair programmer that enhances coding efficiency. When you position the cursor in the textbox for a conditional breakpoint or tracepoint, GitHub Copilot promptly provides three AI-generated expression suggestions based on your codebase. You can choose the most suitable condition or create your own custom conditions as needed.

With AI-generated expressions, you can save time and effort by letting GitHub Copilot do the hard work for you. You can also discover new ways of writing expressions that you might not have thought of before. AI-generated expressions can help you debug your code faster and more effectively and learn from the suggestions along the way.

How to use AI-generated expressions in Visual Studio 2022?

To use AI-generated expressions for conditional breakpoints and tracepoints in Visual Studio 2022, you need to have a GitHub account and sign in with GitHub in Visual Studio. You also need to make sure Tools > Options > Debugging > enable AI suggestions for breakpoint expressions” is enabled.

Once you have enabled GitHub Copilot, you can start using AI-generated expressions for conditional breakpoints and tracepoints in your C++ code.

Gif of a conditional expression break point being set and then edited via settings

You can also use keyboard shortcuts to navigate and select the suggestions. Use Ctrl+Space to invoke the suggestion list, use the up and down arrow keys to move through the list, and use Enter to select a suggestion.

Try it and let us know what you think

We hope you enjoy using AI-generated expressions for conditional breakpoints and tracepoints in Visual Studio 2022. This feature aims to make debugging your C++ code faster and easier. We’d love your feedback and suggestions for improvement. Please leave a comment below or use the Send Feedback button in Visual Studio.

Learn more about other Copilot assisted features in Visual Studio by checking out additional resources Debug with GitHub Copilot – Visual Studio (Windows) | Microsoft Learn

Stay connected with the Visual Studio team by following us on Twitter @VS_Debugger, Twitter @VisualStudio, Twitter @VisualC YouTube, and LinkedIn.

The post Supercharge C++ Debugging with AI-Generated breakpoint expressions appeared first on Visual Studio Blog.

Break for Async User-Unhandled exceptions in the Visual Studio Debugger

$
0
0

Before .NET 9, the debugger was unable to track exceptions thrown from user-code async methods into non-user code framework methods, such as ASP.NET middleware. We are pleased to announce that you will now start seeing the debugger stop for these user-unhandled exceptions in your ASP.NET applications, as well as anywhere else this might happen!

Image of Exception User-Unhandled screen with the "Break when this exception type is user-unhandled" option checked

Summary

Debugging asynchronous code, especially in frameworks like ASP.NET Core, can be tricky due to the potential for exceptions to be thrown across asynchronous boundaries.

Now, the Visual Studio Debugger will automatically break when an async Task method throws an exception back to framework code. This will allow you to easily identify and diagnose issues in your ASP.NET applications, leading to faster debugging cycles and improved productivity. Read below for more details about how user-unhandled exceptions work and how the debugger handles async methods.

Please note that this is for .NET 9 and newer projects only.

Details

The Visual Studio Debugger will enter a break state when exceptions are thrown under three different conditions:

  • First chance exceptions, where exception settings indicate that the debugger should break whenever exceptions of the specified type are thrown.
  • Unhandled exceptions, where the exception is unhandled and no catch handler is found.
  • User-unhandled exceptions, where Just My Code is enabled, and an exception was found to have traveled through user code before a catch handler was found in non-user code.

User-unhandled exceptions are the target of the change to account for async user-unhandled scenarios.

All async Task<T> functions in C# compile to a state machine with an implicit catch handler that catches all exceptions thrown in the Task, sets IsFaulted, and adds the Exception to the AggregateException in Task.Exception.

When a Task is “unwrapped”, typically either via the preferred await or .Result, the stored exception is rethrown to the caller as would happen in a synchronous method and the implicit catch handling is not typically important or observed.

To a debugger, on the other hand, this looks like exceptions are being handled! An exception was thrown, it was caught in “user code” (the compiled result of async Task<T> DoSomethingAsync(...)), and any non-user code awaiting that Task will throw the exception again from non-user code. It is important to note that when Just My Code is enabled, the runtime will avoid sending the debugger events for exceptions that were not thrown in user code, significantly improving performance.

Now consider this behavior in a typical ASP.NET MVC Controller, when Just My Code is enabled:

[HttpPost]

public async Task<ActionResult<TodoItem>> PostTodoItem(TodoItem todoItem)

{

_context.TodoItems.Add(todoItem);

await _context.SaveChangesAsync(); // imagine this throws some Exception

return CreatedAtAction(nameof(GetTodoItem), new { id = todoItem.Id }, todoItem);

}

If SaveChangesAsync() throws an unhandled Exception, it will:

1. Immediately catch it and fault the Task. The debugger is notified, but its user code throwing and catching, so the process continues.

2. async Task<ActionResult<TodoItem>> PostTodoItem will unwrap the faulted Task, rethrow the Exception, and catch it again. Again, the debugger is notified, but nothing is amiss here (and there might be user code that might eventually await it to catch the exception, we cannot see into the future!)

3. Whatever non-user library/framework middleware that is awaiting PostTodoItem will unwrap that Task and rethrow the exception, but since Just My Code is enabled, the debugger is oblivious – that exception was not thrown from user code and caught in non-user code, it was thrown from non-user code.

Thus, changes were required in the runtime to allow the debugger to indicate that we’d like to keep an eye on a particular exception object, so that if the compiled catch handler of a user-code async Task<T> method catches an exception, we continue to be notified about that exception object in case it is rethrown in non-user code. That way, if an exception is thrown through an ASP.NET MVC Controller, the debugger can break for user-unhandled.

Limitations

There are some limitations with this approach, notably the fact that the debugger is not actually stopped on the PostTodoItem frame in the example above, it is stopped at the frame below it, where the exception was rethrown and caught in non-user code:

App!MyMVCApp.DbContextOptions<TodoContext>.SaveChangesAsync() Line 10

App!MyMVCApp.TodoController.PostTodoItem(TodoItem todoItem) Line 5

[External Code] <- The debugger will stop here

This means the frames the exception was thrown from have been unwound past and are not necessarily valid to do variable evaluations on. A GC (Garbage Collection) may have occurred, variables may have been changed, and so on. The debugger will create fake [Exception] frames to represent the context in which the exception was originally thrown, and will attempt to save information from the async state machine to evaluate variables as best as it can, but certain things get nulled out by the compiler as part of async Task exception handling, notably:

  1. Local reference type variables
  2. Local value types with reference fields, or value types that reference other value types with reference fields.

Parameters and class fields/properties will stay intact, as will the exception itself.

For more information, see the original feature request in the public dotnet runtime repository here: https://github.com/dotnet/runtime/issues/12488.

To disable entering break state for async user-unhandled, you can run (in the associated Visual Studio Developer Command Prompt)

vsregedit set local hklm Debugger\EngineSwitches DisableBreakForAsyncUserUnhandled dword 1

or otherwise set the indicated key for the target installation of Visual Studio.

Library authors who do not want the debugger to stop on expected exceptions thrown into their functions can use the [DebuggerDisableUserUnhandledExceptions] attribute introduced in .NET 9 Preview 7, and either rethrow the exception or call the new Debugger.BreakForUserUnhandledException(Exception e) function when the exception is unexpected. You can find the API proposal and discussion for this pair of APIs here: https://github.com/dotnet/runtime/issues/103105.

Thank you!

We appreciate the time you’ve spent reporting issues/suggestions and hope you continue to give us feedback when using Visual Studio on what you like and what we can improve. Your feedback is critical to help us make Visual Studio the best tool it can be! You can share feedback with us via Developer Community: report any bugs or issues via report a problem and share your suggestions for new features or improvements to existing ones.

Stay connected with the Visual Studio team by following us on YouTube, Twitter, LinkedIn, Twitch and on Microsoft Learn.

The post Break for Async User-Unhandled exceptions in the Visual Studio Debugger appeared first on Visual Studio Blog.

Search scoping helps you find what you’re looking for

$
0
0

If you’re working on a large and complex solution, you might find yourself overwhelmed by the number of results when you use code search in Visual Studio. You might be looking for a specific class, method, or variable, but end up scrolling through pages of irrelevant matches. Wouldn’t it be nice if you could narrow down your search scope to only the parts of the solution that you care about?

In the latest update of Visual Studio, you can now use the new scoping options in code search to filter your results by the entire solution, the current project, or the current document. You can also toggle the inclusion of external files in your search.

This way, you can quickly and easily find what you need without getting lost in the noise.

Image shows search scoping BuyerId item

How to Use Scoping in Code Search

To access the new scoping options, open the Code Search window by pressing Ctrl+T or clicking on the Search button (magnifying glass icon) at the top of the IDE. You’ll see a drop-down menu at the far right of the search box that lets you choose between different scopes.

You can select one of the following options:

  • Entire solution
  • Current project
  • Current document

Zoomed in image of the search scoping options (Entire solution, Current project, Current document, Search in external items)

You can also click on the checkbox next to Search in external items to toggle the inclusion of code files that are not part of your solution.

You can set different scopes for different filters, and your selections will be remembered across sessions. For example, you can set the default filter to search through the entire solution, and the member filter to search through the current document. This way, you can switch between various levels of granularity depending on what you’re looking for.

Here’s an example of how code search scoping can help you find what you need faster. Suppose you want to find a method called GetProducts in your solution. If you use the default filter and scope, you might get hundreds of results from various projects. But if you use the member filter and scope it to the current project, you will get a narrower set of results that are relevant to your current context.

We Hope You Enjoy This Feature

We hope that code search scoping will make your coding experience more productive and enjoyable. We’d love to hear your feedback on this feature and any other suggestions you have for improving code search in Visual Studio 2022. You can leave a comment below, use the Report a Problem tool in Visual Studio, or head over to the Developer Community website.

Thank you for your continuous feedback and support, which helps us make Visual Studio better every day.

The post Search scoping helps you find what you’re looking for appeared first on Visual Studio Blog.

VisualStudio.Extensibility 17.11: Settings and more Remote UI support

$
0
0

We continue to invest in the VisualStudio.Extensibility SDK to allow users like you to create extensions that run faster and smoother than ever before! VisualStudio.Extensibility helps you build extensions that run outside the main Visual Studio IDE process for improved performance and reliability. Additional benefits include a sleek and intuitive .NET 8-based API and comprehensive, well-maintained documentation to help you develop amazing extensions faster than ever before.

This 17.11 release builds on our previous releases, bringing support for defining user-configurable settings for your extensions to allow your users to customize their experience along with even more enhancements to remote UI features. We’ve also made substantial updates to our project query API documentation.

For the latest up-to-date docs and installation instructions, visit https://aka.ms/VisualStudio.Extensibility. We encourage you to report bugs and suggest features via the issue tracker on our GitHub repo, where you can also find extension samples to help you get started.

What’s new for VisualStudio.Extensibility?

Our 17.11 release of VisualStudio.Extensibility includes the following features:

  • Customize your extensions further with settings support
  • Show images and use context menus in Remote UI
  • Enhance your tool windows with toolbars

We’ve also refreshed and updated the project query API documentation based on feedback from extension developers like you!

Customize your extensions further with settings support

With this release of VisualStudio.Extensibility, we’ve enabled a handful of APIs that allow you to define settings for your extensions. This allows your end users to alter the behavior of the extension by adjusting values you’ve elected to define as settings.

In order to support this scenario, you’ll now find APIs specific to defining, accessing, and writing settings in your extension. To add settings to your extension, first add a definition for your setting in a class in the extension.

If you’d like to learn more about how to define and leverage settings in your apps, refer to the VisualStudio.Extensibility settings article. You’ll find more details along with samples to get you coding quickly!

Note that the settings API, like VisualStudio.Extensibility, supports Hot Loading of settings. This allows your extension’s settings to be discovered without requiring your users to restart Visual Studio.

Show images and use context menus in Remote UI

As the VisualStudio.Extensibility model prioritizes extensions running outside of the Visual Studio process, it introduces a challenge when adding UI support to extensions as most UI frameworks are in-process. To get around this, there is a set of classes called Remote UI that allow you to define WPF controls in an out-of-process extension and then show them as part of the Visual Studio UI.

With this release, you can now add a context menu to a Remote UI control from XAML, a familiar experience if you’ve ever added a context menu in standard WPF. You’ll also be able to use Remote UI XAML to show either custom images or images that already exist in the Visual Studio catalog. This gives you additional options for providing users with useful information in a visual format and can help you increase your extension’s UI appeal!

Visit the Other Remote UI concepts documentation for code samples and more information.

Enhance your tool windows with toolbars

You can now use VisualStudio.Extensibility to add toolbars to your extension’s tool windows to give your users a quick and easy way to access or leverage features in your extension.

See the Add a toolbar to a tool window section in the tool window overview doc to learn more about creating, adding content to, showing, and controlling the visibility of tool windows – and of course to learn more about adding toolbars to those tool windows.

Project Query API documentation updates

In response to your valuable feedback, we have revamped our documentation to better serve your needs. As we transition to a new model, our project query documentation is evolving to leverage VisualStudio.Extensibility project query wrappers for accessing and modifying solutions/projects. To explore the updated documentation, please refer to Query the Project API (VisualStudio.Extensibility). For details specific to project query using Visual Studio SDK, you can visit Query the Project API (Visual Studio SDK).

About experimental APIs, breaking changes, and how we make decisions about VisualStudio.Extensibility

In reviewing feedback from our issue tracker, we realized it would be useful to outline information about some of the decisions we’ve made around VisualStudio.Extensibility. With this new extensibility model, we carefully consider exactly what should and should not be supported based on two major criteria: your feedback and the design goals of the project. One recent example: we decided not to support the ability to programmatically invoke VSCT (Visual Studio Command Table)-based commands via VisualStudio.Extensibility. This decision aligned with established principles for VisualStudio.Extensibility for a few reasons:

  • VSCT based commands are synchronous. VisualStudio.Extensibility extensions operate asynchronously in a separate process.
  • As there’s no guarantee that UI state will remain coherent due to the asynchronous nature of the invocation from another process or thread, allowing invocation could lead to unpredictable user experiences.
  • VSCT-based commands allow input and output of any type. VisualStudio.Extensibility extensions can run out of process. This imposes limitations around the types of input and output data that can be serialized.
  • Direct command invocation breaks our commitment to having consistent, easy-to-use APIs as it would essentially introduce another set of APIs that are more macro/script-like.

As we continue increasing the surface area of the VisualStudio.Extensibility SDK, we’ll rely on this framework to inform decisions on API coverage and availability. The API is growing and changing. We aim to minimize breaking changes and ensure stability and a consistent experience for you, our extension developers. When we make changes because of customer feedback or internal changes, we’ll communicate it formally with plenty of notice on the VisualStudio.Extensibility breaking changes page. We’ll use the following guidelines for breaking changes to experimental APIs:

  • Breaking changes can be made as part of LTSC minor version releases of Visual Studio.
    • A list of breaking changes for the release will be shared by Preview 2 of that release.
    • The list will be shared in the breaking changes doc linked above.
  • Removal of APIs may be formally deprecated by marking the type or by using the [Obsolete] attribute.
    • This will also happen by Preview 2 of the release in which they’ll be removed.

Most APIs in VisualStudio.Extensibility are stable, which means we do not plan to make any breaking changes to them. For these, we want to replicate the stability expectations associated with the existing VS SDK:

  • Breaking changes to VisualStudio.Extensibility APIs or RPC contracts will only happen as part of a major version release of Visual Studio.
    • The list of breaking changes will be available by Preview 1 of the release.
  • Any API removal will happen formally by marking the type or by using the [Obsolete] attribute.
  • Demotion of stable APIs to experimental is considered a breaking change and will be formally announced.

We can’t do this without you!

The time and effort you’ve spent reporting issues and sharing suggestions so far has been instrumental in shaping VisualStudio.Extensibility. We need your help as we continue to develop VisualStudio.Extensibility! Please try out this preview release and let us know what you think. Check out the docs, browse the code samples, and build your first extension. You can send feedback and report issues through our issue tracker.

To request features, look at Developer Community to see if someone else made a similar request first. Create a new one if you can’t find a similar request. By checking for similar requests and upvoting and commenting on them, you help us better prioritize requests. Give VisualStudio.Extensibility a try today and share your thoughts with us!

The post VisualStudio.Extensibility 17.11: Settings and more Remote UI support appeared first on Visual Studio Blog.

Understanding the behavior of the XAML Designer with abstract base classes

$
0
0

Visual Studio 2022 introduced a new XAML designer for building WPF apps, with a goal of increasing the performance and reliability of the designer. The new designer can quickly open a XAML file by using WPF’s built-in parser and display. This new design has a nuanced behavior when the root XAML element derives from an abstract base class. This article helps with understanding implications for using an abstract base class and describes workarounds which can ensure a smooth design experience.

The Challenge with Abstract Base Classes

When working with the XAML Designer, the base class of the root element is instantiated for display purposes. This allows developers to visualize and interact with their UI components directly within the designer, while the custom control is being developed. In the example screenshot below, the base class of the root element is UserControl. The custom control’s derived class is specified in the x:Class attribute as TestControl. Therefore, an instance of UserControl is instantiated for display in design view:

A computer screen shot of a computer program Description automatically generated

However, an issue arises when the root element’s base class is abstract. Since abstract classes cannot be instantiated, the XAML Designer will find the first non-abstract base class and instantiate that instead. Most of the time, this will work well, but there are cases where this will break design view, possibly showing an error message. One case where design view breaks is when the abstract base class defines a property that is crucial for display, such as the Content property.

Illustrative Example

Imagine you have an abstract base class as follows:

A screen shot of a computer code Description automatically generated

If this abstract class is the base class for your custom control, the XAML Designer will not be able to instantiate AbstractControlBase and will instead instantiate the Control class. The reason is that Control is the first non-abstract base class. This leads to any reference to AbstractControlBase being broken in design view. In the following screenshot, it shows how a ControlTemplate cannot be applied to AbstractControlBase, and the Content property cannot be used to display anything in design view:

A screenshot of a computer Description automatically generated

Effective Workarounds

To mitigate this issue, there are practical workarounds that ensure that the XAML Designer continues to function seamlessly.

1. Move Display Properties to a Non-Abstract Base Class

One approach is to refactor your code by transferring the properties critical to design view to another level of base class that is not abstract. This adjustment allows the XAML Designer to instantiate and render the necessary components. The following code shows how the Content property was moved from AbstractControlBase to a new ControlBase class:

A screen shot of a computer code Description automatically generated

In the XAML file, the base class stays as AbstractControlBase, but the control template now applies to the concrete base class ControlBase:

A computer screen shot of a blue box with white text Description automatically generated

2. Utilize Standard Controls

Another strategy is to derive the abstract class from WPF’s ContentControl, which already provides common properties that are used for display in design view, such as the Content property. This method circumvents the instantiation issue associated with abstract classes, allowing your UI elements to be properly displayed while designing your XAML content.

A screen shot of a computer Description automatically generated

A computer screen shot of a blue box Description automatically generated

Conclusion

Understanding the implications of using abstract base classes and implementing effective workarounds can significantly enhance your design workflow. By moving properties to non-abstract base classes or utilizing standard controls, you can ensure that your UI components are rendered accurately, allowing you to harness the full potential of the XAML Designer.

If you have feedback about the XAML Designer, please let us know by using the Visual Studio Feedback Tool. We’re eager to hear what you think!

The post Understanding the behavior of the XAML Designer with abstract base classes appeared first on Visual Studio Blog.

How to run .NET apps natively on Arm64 devices

$
0
0

Are you developing .NET applications for Arm-based processors? Do you want to take advantage of the performance and power efficiency of running your apps natively on Arm64 devices? If so, you’ll be happy to hear that Visual Studio 2022 17.11 has a new feature that makes it easier than ever to do just that.

Mobile device with apps

Visual Studio 2022 natively supports building and debugging Arm64 apps on Arm-based processors. However, if you build your app with the AnyCPU setting, which is the default for most .NET projects, your app will run on an Arm64 device using x64 emulation. While this may seem counterintuitive, this approach allowed many apps with x64 dependencies to work reliably under emulation without requiring additional build or dependency changes.

Unfortunately, under these conditions, it means your app won’t benefit from the native capabilities of the Arm64 CPU and may suffer from reduced performance and increased battery consumption.

To solve this problem, the Windows 24H2 update introduces a new setting for your app manifest files. This setting allows you to specify a list of supported architectures (currently amd64 or arm64) for your app, indicating that it should run natively on those platforms. For example, if you include arm64 in the list, your app will run using the Arm64 CLR on Arm64 devices when supported, even if it was built with the AnyCPU setting.

How to use the setting in Visual Studio 2022

To use the new setting in Visual Studio 2022, you need to do the following steps:

  1. Make sure you have the Windows 24H2 update installed on your development machine and your target device.
  2. Open your .NET project in Visual Studio 2022 and right-click on your project in Solution Explorer and select Properties.
  3. In the Build area confirm that the AnyCPU configuration is enabled and that the Prefer 32-bit option is unselected.
  4. Select the new Prefer native ARM64 option.
  5. Save and rebuild your project.
  6. Deploy your app to your Arm64 device and run it. You can also debug it using Visual Studio 2022, which will automatically detect the correct architecture and launch the debugger accordingly.

A screenshot of a computer Description automatically generated

Enjoy the benefits of native Arm64 apps

By using the new setting in Visual Studio 2022, you can easily run and debug your .NET apps natively on Arm64 devices, without changing your code or your build configuration. This will help you improve the performance, reliability, and battery life of your apps, and give your users a better experience.

We hope you enjoy this new feature and find it useful for your development scenarios. As always, we appreciate your> feedback and suggestions, which help us make Visual Studio better for you. Please let us know what you think by leaving a comment below, or by using the Report a Problem tool in Visual Studio. Thank you for choosing Visual Studio 2022!

The post How to run .NET apps natively on Arm64 devices appeared first on Visual Studio Blog.


Multi-Project Launch Configuration

$
0
0

Are you tired of the hassle of manually configuring your development environment every time you want to launch multiple projects? We’ve heard your feedback and are thrilled to announce a feature in Visual Studio that simplifies your workflow.

The Multi-Project Launch Configuration feature in Visual Studio allows developers to set up and save profiles for launching specific projects within a multi-project solution in predefined states for debugging. This simplifies the process of working with complex solutions, improves debugging efficiency, and enables easy sharing of configurations among team members.

Video titled: Multi-Project Config.mov

Enabling Multi Launch Profile:

The Multi-Project Launch Configuration is available in version 17.11. Enable the feature flag with the instructions below to start using it.

In Visual Studio, navigate to Tools > Options > Preview Features and toggle the checkbox for “Enable Multi Launch Profiles” to activate the feature.

image of a checkbox selection for enabling Multi-Project Launch

Creating Multi Launch Profile:

  • Open your Visual Studio solution that contains multiple projects.
  • Go to the “Solution Explorer” on the right side of the Visual Studio window.
  • Right-click on your solution (the top-level item in the Solution Explorer) and select “Configure Startup Projects…”.

Image of Solution explorer with Configure Startup Projects highlighted

  • In the Solution Property Pages, click on the “Common Properties” tab, and select “Configure Startup Projects”.

In the Solution Property Pages, Common Properties tab, Configure Startup Projects, Select Multiple startup projects

  • In the “Configure Startup Projects” section, choose the “Multiple startup projects” radio button.
  • Below the radio button, you’ll see a list of all the projects in your solution.
  • Set the action for each project to either “Start,” “Start without debugging,” or “None,” and select debug target depending on your requirements.

Image selecting a project and selecting "Start" as action

  • Enabling the “Share Profile” checkbox allows you to share the profile with the team by checking it into the config file in the Source Control repo.
  • Launch profiles are saved to a JSON file in the same directory as the solution. The “Share Profile” checkbox determines whether the profile is saved to a user-specific file (unchecked) or to a file intended for source control tracking, such as in Git (checked).

Image of multiple projects being selected as "Start"

  • Once you’ve configured the startup action for each project, click the “OK” or “Apply” button to save the profile.
  • The created launch profile appears in the toolbar dropdown list, allowing you to select the profile you want to debug.

Image of Feature Profile dropdown showing multiple projects to start debugging

Engage with us!

We would love to get your feedback on Multi Project Config, so please give it a try and let us know what you think! You can share any feedback via Developer Community to help us make Visual Studio better for you!

The post Multi-Project Launch Configuration appeared first on Visual Studio Blog.

Level up your collaborations with the pull request experience in Visual Studio

$
0
0

One of our main goals is to help you and your team collaborate more effectively and efficiently on your software projects. That’s why we are constantly improving our Version Control features, especially the ones related to the pull request workflow. Starting in Visual Studio version 17.11, you can enjoy a smoother and smarter pull request experience, from creating to reviewing to merging. You can link your Azure DevOps work items, and in both Azure DevOps and GitHub you can create draft PRs and use default templates. You can even get AI assistance to write your pull request descriptions. Plus, you can view and respond to your pull request comments right in the editor, without leaving Visual Studio. Sounds awesome, right? Download the latest Visual Studio release and see for yourself!

Create all your pull requests in Visual Studio

We were so excited by the enthusiastic reception to the new Create a Pull Request flow and the subsequent updates. This feature had hundreds of survey responses, and we read every single comment. We’ve delivered on the top concerns, enabling Azure DevOps work item linking, default Pull Request templates, and draft PRs.

  • The Azure DevOps “New Pull Request” window now has a section where you can add your linked work items. These items are reflected in the web as being linked – avoiding the context switch to the web and fulfilling many branch policies that require a linked ticket.
  • Default pull request templates will auto-populate in the description box if there’s one available. Learn more about how to add default templates in your repository in the GitHub documentation and Azure DevOps documentation.
  • Create your pull request as a draft using the drop down menu on the “Create” button. This lets your colleagues know it’s a work in progress.
  • Learn more about the GitHub Copilot generated pull request descriptions in our previous blog.

Image showing a draft of a pull request description for ADO and GitHub

View your pull request comments in the editor

Mapping between your code editor and your browser to view pull request comments can be a hassle. We’ve added your GitHub and Azure DevOps pull request comments directly in your working file. You can now stay in your context, make necessary code changes, and interact with your colleagues’ suggestions without switching contexts to the browser.

Enable the feature flag, “Pull Request Comments”, then checkout any branch with an active pull request branch and click on “Show comments in file”. You can also click on the “PR #” entry point from the Git Changes window or from the Git top level menu with Git > GitHub or Azure DevOps > Show comments in File.

Image of Git Changes screen

You can navigate between files in the pull request and comments in the files using the toolbar. Leverage the following keyboard shortcuts:

Go to the previous file in the pull request Ctrl+Shift+Alt+F6
Go to the next file in the pull request Ctrl+Alt+F6
Go to the previous comment Ctrl+Shift+Alt+F8
Go to the next comment Ctrl+Alt+F8
Move focus back to the code from a comment Esc


In the last preview we included better support for @ mentions and work item references for your comments. We also improved the UI with the addition of avatars, other visual tweaks to improve accessibility, and we enabled better syncing with the server.

Contribute to what’s next

A smoother pull request experience helps your collaborations thrive! Be sure to try out the latest features in Visual Studio 17.11 GA and share your feedback in the following surveys:

We plan to continue improving the pull request experience based on your feedback, so let us know what’s missing and what you’re looking forward to! We’ve got a lot of functionality on the roadmap, including adding new pull request comments and seeing the comments in the diff view between your source and target.

We appreciate the time you’ve spent reporting issues/suggestions and hope you continue to give us feedback when using Visual Studio on what you like and what we can improve. Your feedback is critical to help us make Visual Studio the best tool it can be! You can share feedback with us via Developer Community: report any bugs or issues via report a problem and share your suggestions for new features or improvements to existing ones.

Stay connected with the Visual Studio team by following us on YouTube, Twitter, LinkedIn, Twitch and on Microsoft Learn.

The post Level up your collaborations with the pull request experience in Visual Studio appeared first on Visual Studio Blog.

Next-Gen Code Coverage in Visual Studio: Enhanced C++ Support and Security

$
0
0

We’re excited to share the latest changes in Visual Studio’s code coverage components. If you haven’t already, be sure to check out our previous blog posts: What’s New in Our Code Coverage Tooling? and Code coverage features in Visual Studio Enterprise.

C++ Code Coverage

Tired of instable native code coverage that doesn’t support ARM64? Now, you can collect native code coverage for all your methods, including those on ARM64. We have completely overhauled the C++ code coverage support to improve reliability, performance, and security. The new implementation, powered by MSVC compiler tooling, now supports x86, x64, and ARM64 architectures. To enable the new experience, you need to enable the /PROFILE linker option for all C++ projects, including both testing and production.

Image showing Configuration Properties, Linker, Advanced and set Profile to Yes (/Profile)

For detailed examples, visit:

This feature is available only for the MSVC compiler.

Introducing Microsoft.CodeCoverage.Console

You can use the new Microsoft.CodeCoverage.Console tool to collect code coverage for console applications, merge coverage reports, and instrument binaries. It can also capture code coverage for each test separately, making it an ideal choice for use in CI pipelines.

Available in Visual Studio Enterprise through Developer PowerShell, this command-line tool extends the capabilities of the well-known dotnet-coverage tool, adding support for C++ code coverage and enhanced security features.

For an example of how to use the Microsoft.CodeCoverage.Console tool, visit Scenario 09: C++ Code Coverage for Console Apps in Developer PowerShell for Visual Studio Enterprise. Visit What’s New in Our Code Coverage Tooling? to find even more examples.

To learn more, check out the Microsoft.CodeCoverage.Console documentation.

Enhanced Security Features

You can collect code coverage for web applications running in IIS for both .NET and C++ using Microsoft.CodeCoverage.Console, which allows for the instrumentation of both C++ and .NET binaries. Additionally, Visual Studio code coverage components now include enhanced security features, such as controlling access to data passed through named pipes and shared memory. This security improvement also supports running web applications in IIS under different user accounts, allowing you to specify which users can access the coverage data.

For a full example, visit Scenario 08: Static Code Coverage for ASP.NET Core Web Apps (Razor Pages) in IIS.

Summary

In this update, we’ve enhanced the code coverage experience in Visual Studio with a complete rewrite of C++ code coverage support, introduced the new Microsoft.CodeCoverage.Console tool, and added new security measures for managing access to shared data. These changes provide a faster, more reliable, and secure way to measure code coverage in your applications, especially when working with C++ projects.

We appreciate the time you’ve spent reporting issues/suggestions and hope you continue to give us feedback when using Visual Studio on what you like and what we can improve. Your feedback is critical to help us make Visual Studio the best tool it can be! You can share feedback with us via Developer Community: report any bugs or issues via report a problem and share your suggestions for new features or improvements to existing ones.

Stay connected with the Visual Studio team by following us on YouTube, Twitter, LinkedIn, Twitch and on Microsoft Learn.

The post Next-Gen Code Coverage in Visual Studio: Enhanced C++ Support and Security appeared first on Visual Studio Blog.

Organize Your Breakpoints like a pro

$
0
0

Do you feel overwhelmed by the sheer number of breakpoints in your Visual Studio project? Wish you could categorize and toggle them on and off with ease? The new breakpoint group feature in Visual Studio 2022 is here to transform your debugging experience.

Image of a large list of breakpoints

Breakpoint groups allow you to create custom collections of breakpoints and apply various actions to them. For example, you can enable or disable all breakpoints in a group or set conditions and actions for them or even make the whole group dependent on other breakpoints.

But that’s not all. You can also mark the selected breakpoint group as the default, ensuring all newly added breakpoints are automatically included in that group. This enhancement simplifies the management and organization of breakpoints, providing seamless debugging when investigating multiple issues.

Recap: Breakpoint groups

To create a breakpoint group, right-click on any breakpoint in the Breakpoints window and select Add to Group > New Group. You can name the group and add a description if you want.

Image bpgroup

To add more breakpoints to the group, simply drag and drop them from the Breakpoints window or use the right-click menu. To remove breakpoints from the group, drag and drop them outside the group or use the right-click menu. You can also delete the group, which will remove all the breakpoints in the group from your project.

Default Breakpoint Group

To set a breakpoint group as the default, simply right-click on the group and choose “Set as Default Group.” The default group will be distinctly labeled in bold, making it easy to identify. When you have a default breakpoint group, any new breakpoints you add to your code will automatically be added to that group. This ensures that your breakpoints are organized consistently, without the need to manually sort them each time you add new ones.

If your needs change, you can easily move breakpoints to a different group at any time. This flexibility allows you to adapt your breakpoint organization as your project evolves. You can change the default group at any time or clear it altogether.

Image deafultbp

You can access all the breakpoint group actions from the right-click menu or the toolbar in the Breakpoints window.

Try it out today

We hope you find the breakpoint group feature useful and productive. It’s one of the many improvements we’ve made to the debugging experience in Visual Studio 2022, thanks to your feedback and suggestions.

Please download the latest version of Visual Studio and try it out. Stay connected with the Visual Studio team by following us on Twitter @VS_Debugger, Twitter @VisualStudio, YouTube, and LinkedIn.

Report any issues or suggestions via Help > Send Feedback.

Learn more about other Copilot assisted features in Visual Studio by checking out additional resources Debug with GitHub Copilot – Visual Studio (Windows) | Microsoft Learn

Thank you for using Visual Studio and happy coding!

The post Organize Your Breakpoints like a pro appeared first on Visual Studio Blog.

Creating a React TODO app in Visual Studio 2022

$
0
0

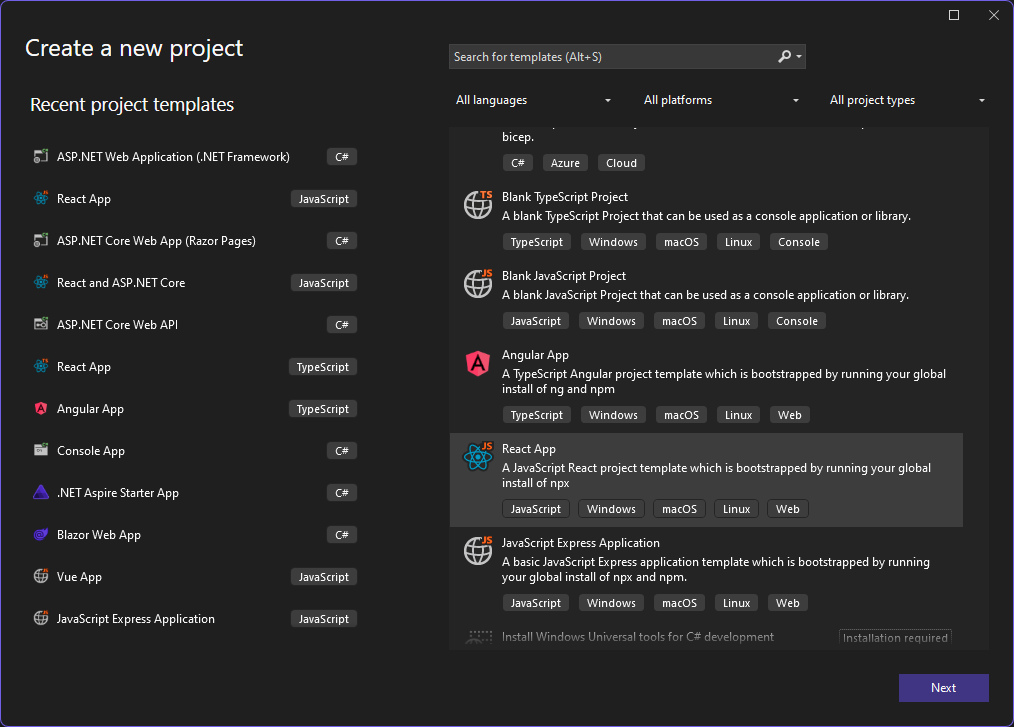
In this tutorial we will create a React front-end, with JavaScript, of a TODO web app using a Visual Studio 2022. To get started install Visual Studio with the Node.js development workload. This will include the JavaScript/TypeScript (JSTS) projects and the associated support. The code for this app can be found at sayedihashimi/todojswebapp (github.com). Create a new React project using the New Project Dialog in Visual Studio 2022. Use File > New > Project … to open that dialog. For this tutorial select the React App JavaScript template which is shown below.

Image of React App in Visual Studio start screen

After clicking Next, give the project the name TodoWebApp and click Create. This will create the JavaScript project using the vite command line tool. Now create a new component to encapsulate the todo list functionality. First create a new folder named components under the src folder. This is the folder where all components will go. It’s a common convention to place components in a components folder, but this is not required. Right click on this new folder and select Add > React JSX Component File, give it the name TodoList as shown in the following image.

Image selecting the React JSX Component file

This will create a new jsx file in the components folder. For now, replace the Hello World content with the h2 as shown in the snippet below.

function TodoList() {
    return (
        <h2>TODO app contents</h2>
    );
}

This component displays a header for now. We will replace this soon. Let’s wire up this component in the app and then later replace the contents with the desired functionality. Let’s add this component to the app and remove the boilerplate content that is no longer needed.

Open the App.jsx file. This is the main component that is loaded which represents the todo application. This is used in the main.jsx file. For this tutorial we will not need to modify the main.jsx file. In App.jsx, remove all the imports from the top and clear out the contents of the return statement. The file should look like the snippet below.

function App() {
    const [count, setCount] = useState(0)
    return (

    )
}

export default App

To add the TodoList component, place your cursor inside the fragment and then type <TodoL RETURN. This will add the component and the import statement. You can see this in the below animation.

Gif showing the return TodoList in function App()

Now let’s clear out the CSS files so that we can start with a fresh start. Open the App.css file and delete all the contents. In the Index.css file remove all contents except the styles for :root. The Index.css file should look like the following.

:root {
    font-family: Inter, system-ui, Avenir, Helvetica, Arial, sans-serif;
    line-height: 1.5;
    font-weight: 400;
    color-scheme: light dark;
    color: rgba(255, 255, 255, 0.87);
    background-color: #242424;
}

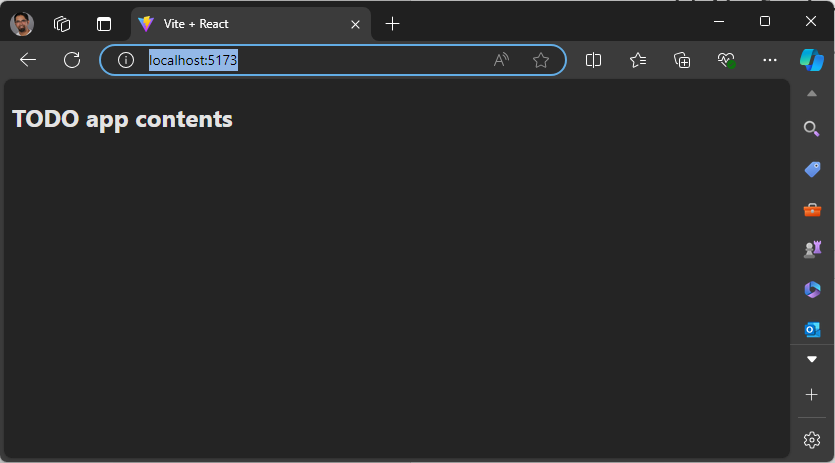
Now run the app to ensure that everything is working as expected. You can use the Start Debugging button from the toolbar or the F5 keyboard shortcut. After that a browser window should open with the following content.

Image showing localhost todo list

This would be a good time to create a commit in case you need to roll back to a good state later. Now that you’ve started the app you can leave it running, as you make changes the app will automatically refresh with the latest content using the Hot Module Replacement support. Some actions like adding folders or renaming files will require that you stop debugging and then restart it but in general you can leave it running in the background as you develop your app. Open the TodoList.jsx component so that we can start to define that.

In TodoList.jsx first add the UI needed to show and manage todo entries and then hook it up to store the values after that. Update TodoList.jsx to have the following content.

function TodoList() {
    return (
        <div>
            <h1>TODO</h1>
            <div>
                <input
                    type="text"
                    placeholder="Enter a task"
                    required
                    aria-label="Task text" />
                <button className="add-button" aria-label="Add task" >
                    Add
                </button>
            </div>
            <ol id="todo-list">
                <p>existing tasks will be shown here</p>
            </ol>
        </div>
    );
}

export default TodoList;

We have added an input box for the todo item as well as a button to submit that. The existing tasks will be displayed under the input and button, but we will get to that soon. Now that we have the input field to get a new task added, we will wire up the Add button. We will use the useState React hook to add two state variables, one for the task which is getting added and another to store the existing tasks. For this tutorial the tasks will be stored in memory we will not add a database for persistent storage. Add the following import statement to TodoList.jsx to import useState.

import { useState } from 'react'

Now we can use that hook to create the state variables. Add the following code in the TodoList function above the return statement.

const [tasks, setTasks] = useState([
    "Drink some coffee",
    "Create a TODO app",
    "Drink some more coffee"]);

const [newTaskText, setNewTaskText] = useState("");

This will setup two variables, tasks and newTaskText, for the data and two functions that you can call to update those variables, setTasks and setNewTasks. When a value for a state variable is changed React will automatically re-render the component. We are almost ready to update TodoList.jsx to show the todo items as a list, but there is an important React concept that we must explain before doing so.

In React when you display a list of items you will need to add a key to uniquely identify each item in the list. This is explained in depth in the React docs at Rendering Lists, but we will cover what is needed for this tutorial. We have a list of todo items that we want to display, and we need to associate a unique key for each item, the key for each item should not change. Since the key for each item should not change, we cannot use the index of the item in the array as the key. We need an id which will not change through out the lifetime of those values. We will use randomUUID() to create a unique id for each todo item.

Now let’s create TodoList.jsx using a uuid as the key for each todo item. Update TodoList.jsx to contain the following code.

import React, { useState } from 'react';
import './Todo.css';
import TodoItem from './TodoItem';

const initialTasks = [
    { id: self.crypto.randomUUID(), text: 'Drink some coffee' },
    { id: self.crypto.randomUUID(), text: 'Create a TODO app' },
    { id: self.crypto.randomUUID(), text: 'Drink some more coffee' }
];

function TodoList() {
    const [tasks, setTasks] = useState(initialTasks);
    const [newTaskText, setNewTaskText] = useState("");
    function handleInputChange(event) {
        setNewTaskText(event.target.value);
    }
    return (
        <article
            className="todo-list"
            aria-label="task list manager">
            <header>
                <h1>TODO</h1>
                <form className="todo-input" aria-controls="todo-list">
                    <input
                        type="text"
                        placeholder="Enter a task"
                        value={newTaskText}
                        onChange={handleInputChange} />
                    <button
                        className="add-button">
                        Add
                    </button>
                </form>
            </header>
            <ol id="todo-list" aria-live="polite" aria-label="task list">
                {tasks.map((task, index) =>
                    <li key={task.id}>
                        <span className="text">{task.text}</span>
                    </li>
                )}
            </ol>
        </article>
    );
}
export default TodoList;

Since the id values are assigned outside the TodoList function, we can be sure the values will not change if the page is rerendered. When you try the app in this state, you will notice that you cannot type into the todo input element. This is because the input element is bound to newTaskText which has been initialized to a blank string. To allow users to add new tasks, we will need to handle the onChange event on that control. We also need to implement the Add button support. Add the functions immediately above the return statement in the TodoList function.

function handleInputChange(event) {
    setNewTaskText(event.target.value);
}

function addTask() {
    if (newTaskText.trim() !== "") {
        setTasks(t => [...t, { id: self.crypto.randomUUID(), text: newTaskText }]);
        setNewTaskText("");
    }
}

In the handleInputChanged function, the new value from the input field is passed in via event.target.value and that is used to update the value for the newTaskText variable with setNewTaskText. In the addTask function we add the new task to the list of existing tasks using setTasks and we set the id of the item as a new uuid value. Update the input element to include onChange={handleInputChange} and update the Add button to include onClick={addTask}. This will wire up the event to the function that handles that event. Following this you should be able to add a new task to the task list. New tasks are added to the bottom of the list. To make this app more useful, we need to add support to delete tasks and to move a task up or down. Let’s get started on that.

We will add the functions to support delete, move up and move down and then update the markup to show a button for each action. Add the following in the TodoList function above the return statement.

function deleteTask(id) {
    const updatedTasks = tasks.filter(task => task.id != id);
    setTasks(updatedTasks);
}

function moveTaskUp(index) {
    if (index > 0) {
        const updatedTasks = [...tasks];
        [updatedTasks[index], updatedTasks[index - 1]] = [updatedTasks[index - 1], updatedTasks[index]];
        setTasks(updatedTasks);
    }
}

function moveTaskDown(index) {
    if (index < tasks.length) {
        const updatedTasks = [...tasks];
        [updatedTasks[index], updatedTasks[index + 1]] = [updatedTasks[index + 1], updatedTasks[index]];
        setTasks(updatedTasks);
    }
}

The delete function takes in the task id and deletes that one from the list and uses the Array filter() method to create a new array excluding the selected item and then calls setTasks(). The other two functions take in the index of the item since this is specific to the item ordering. Both moveTaskUp() and moveTaskDown() use array destructuring assignment to swap the selected task with its neighbor. Now we will update the view to include these buttons. Update the return statement to contain the following.

return (
    <article
        className="todo-list"
        aria-label="task list manager">
        <h1>TODO</h1>
        <header>
            <h1>TODO</h1>
            <form className="todo-input" onSubmit={addTask} aria-controls="todo-list">
                <input
                    type="text"
                    required
                    autoFocus
                    placeholder="Enter a task"
                    value={newTaskText}
                    aria-label="Task text"
                    onChange={handleInputChange} />
                <button
                    className="add-button"
                    aria-label="Add task">
                    Add
                </button>
            </form>
        </header>
        <ol id="todo-list" aria-live="polite">
            {tasks.map((task, index) =>
                <li key={task.id}>
                    <span className="text">{task.text}</span>
                    <button className="delete-button" onClick={() => deleteTask(task.id)}>
                        🗑
                    </button>
                    <button className="up-button" onClick={() => moveTaskUp(index)}>
                        ⇧
                    </button>
                    <button className="down-button" onClick={() => moveTaskDown(index)}>
                        ⇩
                    </button>
                </li>
            )}
        </ol>
    </article>
);

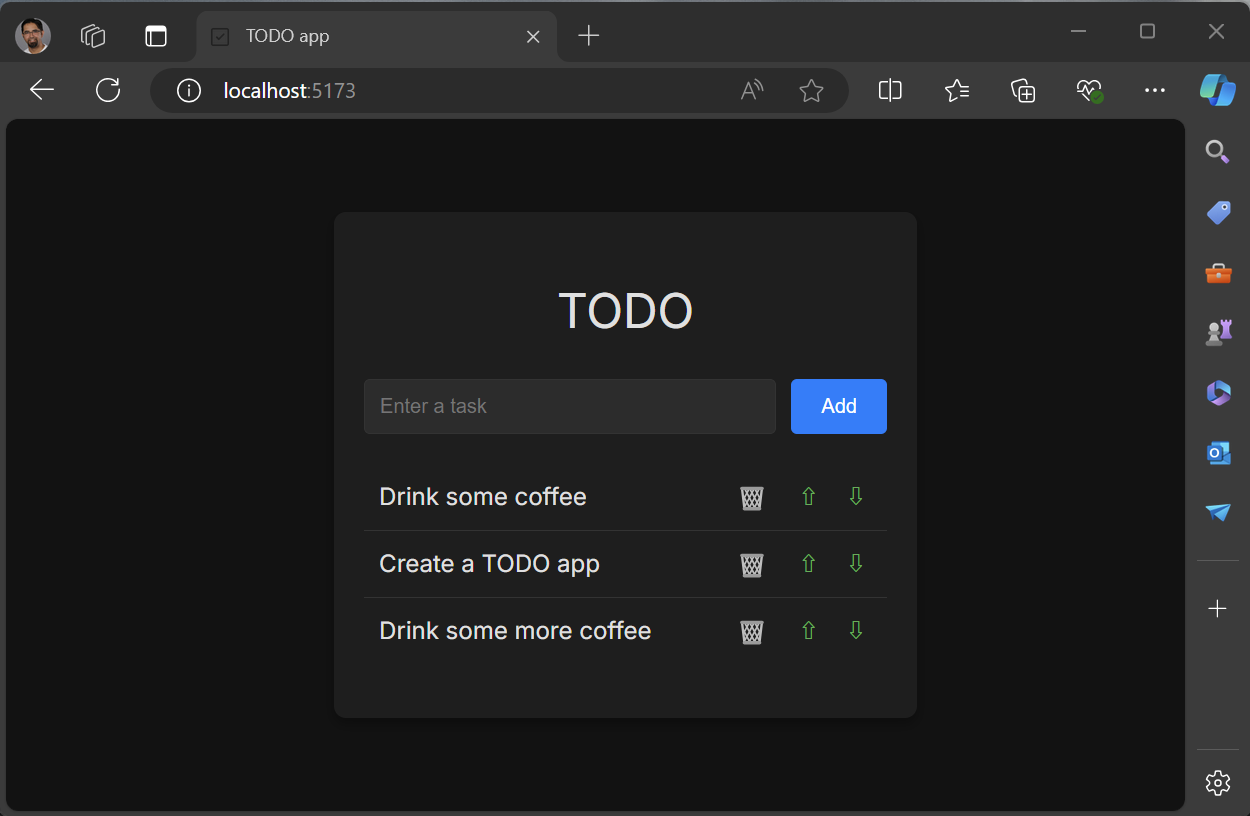
We have added the buttons needed to perform the tasks we discussed above. We are using Unicode characters as icons on the buttons. In the markup there are some attributes added for when we add some CSS later. You will also notice the use of aria attributes to improve accessibility, the are optional but highly recommended. If you run the app it should look like the image below.

Image showing the UI for the todo list with the garbage icon and the up/down arrows

You should now be able to perform the following in the TODO web app.

  • Add task
  • Delete task
  • Move task up
  • Move task down

This is working well, but we can refactor this so that we have a reusable component to display the todo items. The markup for the todo item will go into a new component, TodoItem. Since the management of the list will stay in the Todo component, we will pass callbacks to the delete and move buttons. To get started, right click the components folder in the Solution Explorer and select Add > New Item. In the dialog that opens select the React JSX Component File. Give it the name TodoItem and click Add. We will pass in the task and callbacks as props to this new component. The TodoItem should contain the following code.

import PropTypes from 'prop-types';

function TodoItem({ task, deleteTaskCallback, moveTaskUpCallback, moveTaskDownCallback }) {
    return (
        <li aria-label="task" >
            <span className="text">{task}</span>
            <button
                type="button"
                aria-label="Delete task"
                className="delete-button"
                onClick={() => deleteTaskCallback()}>
                🗑
            </button>
            <button
                type="button"
                aria-label="Move task up"
                className="up-button"
                onClick={() => moveTaskUpCallback()}>
                ⇧
            </button>
            <button
                type="button"
                aria-label="Move task down"
                className="down-button"
                onClick={() => moveTaskDownCallback()}>
                ⇩
            </button>
        </li>
    );
}

TodoItem.propTypes = {
    task: PropTypes.string.isRequired,
    deleteTaskCallback: PropTypes.func.isRequired,
    moveTaskUpCallback: PropTypes.func.isRequired,
    moveTaskDownCallback: PropTypes.func.isRequired,
};

export default TodoItem;

The code above contains the markup from the Todo component and at the bottom we declare the propTypes. Props are used to pass data from a parent component to child components. For more info on props the docs are available at Passing Props to a Component – React. Since the delete and move functions are being passed in as callbacks, the onClick handler will need to be updated to call into those callbacks. The full code for TodoList is below that uses the TodoItem component.

import React, { useState } from 'react'
import './Todo.css'
import TodoItem from './TodoItem'

const initialTasks = [
    { id: self.crypto.randomUUID(), text: 'Drink some coffee' },
    { id: self.crypto.randomUUID(), text: 'Create a TODO app' },
    { id: self.crypto.randomUUID(), text: 'Drink some more coffee' }
];

function TodoList() {
    const [tasks, setTasks] = = useState(initialTasks);
    const [newTaskText, setNewTaskText] = useState("");
    function handleInputChange(event) {
        setNewTaskText(event.target.value);
    }
    function addTask() {
        if (newTaskText.trim() !== "") {
            setTasks(t => [...t, { id: self.crypto.randomUUID(), text: newTaskText }]);
            setNewTaskText("");
        }
        event.preventDefault();
    }
    function deleteTask(id) {
        const updatedTasks = tasks.filter(task => task.id !== id);
        setTasks(updatedTasks);
    }
    function moveTaskUp(index) {
        if (index > 0) {
            const updatedTasks = [...tasks];
            [updatedTasks[index], updatedTasks[index - 1]] = [updatedTasks[index - 1], updatedTasks[index]];
            setTasks(updatedTasks);
        }
    }
    function moveTaskDown(index) {
        if (index < tasks.length) {
            const updatedTasks = [...tasks];
            [updatedTasks[index], updatedTasks[index + 1]] = [updatedTasks[index + 1], updatedTasks[index]];
            setTasks(updatedTasks);
        }
    }
    return (
        <article
            className="todo-list"
            aria-label="task list manager">
            <header>
                <h1>TODO</h1>
                <form onSubmit={addTask} aria-controls="todo-list">
                    <input
                        type="text"
                        required
                        placeholder="Enter a task"
                        value={newTaskText}
                        aria-label="Task text"
                        onChange={handleInputChange} />
                    <button
                        className="add-button"
                        aria-label="Add task">
                        Add
                    </button>
                </form>
            </header>
            <ol id="todo-list" aria-live=polite>
                {tasks.map((task, index) =>
                    <TodoItem
                        key={task.id}
                        task={task.text}
                        deleteTaskCallback={() => deleteTask(task.id)}
                        moveTaskUpCallback={() => moveTaskUp(index)}
                        moveTaskDownCallback={() => moveTaskDown(index)}
                    />
                )}
            </ol>
        </article>
    );
}

export default Todo;

Now the TodoItem component is used to render each todo item. Notice that we set the key to task.id which contains the uuid value for that task. When you run the app, you shouldn’t see any changes to the look or behavior of the app since we refactored it to use TodoItem. Let’s move on to styling.

Now that we have all the basic functions supported, it’s time to start adding some styling to this to make it look nice. Now would be a good time to create a commit to save your progress. Let’s first start by adding a link in the Index.html for a font family, Inter, that we will use for this app. In the Index.html there are some other items that need to be cleaned up. Specifically, the title should be updated and vite.svg file is still being used as the icon. Update the Index.html file to have the following content.

<!doctype html>
<html lang="en">
    <head>
        <meta charset="UTF-8" />
        <link rel="icon" type="image/svg+xml" href="/checkmark-square.svg" />
        <meta name="viewport" content="width=device-width, initial-scale=1.0" />
        <title>TODO app</title>
        <link href='https://fonts.googleapis.com/css?family=Inter' rel='stylesheet'>
        <script type="module" defer src="/src/main.jsx"></script>
    </head>
    <body>
    </body>
</html>

In addition to these changes the file checkmark-square.svg was added to the public folder. This is an SVG from the FluentUI checkmark square image which I downloaded directly. There is a package that you can use for a more integrated experience but that’s outside the scope of this post.

Now let’s update the styles of the TodoList component. Add the following to TodoList.css.

.todo-list {
    background-color: #1e1e1e;
    padding: 1.25rem;
    border-radius: 0.5rem;
    box-shadow: 0 0.25rem 0.5rem rgba(0, 0, 0, 0.3);
    width: 100%;
    max-width: 25rem;
}

.todo-list h1 {
    text-align: center;
    color: #e0e0e0;
}

.todo-input {
    display: flex;
    justify-content: space-between;
    margin-bottom: 1.25rem;
}

.todo-input input {
    flex: 1;
    padding: 0.625rem;
    border: 0.0625rem solid #333;
    border-radius: 0.25rem;
    margin-right: 0.625rem;
    background-color: #2c2c2c;
    color: #e0e0e0;
}

.todo-input .add-button {
    padding: 0.625rem 1.25rem;
    background-color: #007bff;
    color: #fff;
    border: none;
    border-radius: 0.25rem;
    cursor: pointer;
}

.todo-input .add-button:hover {
    background-color: #0056b3;
}

.todo-list ol {
    list-style-type: none;
    padding: 0;
}

.todo-list li {
    display: flex;
    justify-content: space-between;
    align-items: center;
    padding: 0.625rem;
    border-bottom: 0.0625rem solid #333;
}

.todo-list li:last-child {
    border-bottom: none;
}

.todo-list .text {
    flex: 1;
}

.todo-list li button {
    background: none;
    border: none;
    cursor: pointer;
    font-size: 1rem;
    margin-left: 0.625rem;
    color: #e0e0e0;
}

.todo-list li button:hover {
    color: #007bff;
}

.todo-list li button.delete-button {
    color: #ff4d4d;
}

.todo-list li button.up-button,
.todo-list li button.down-button {
    color: #4caf50;
}

This should improve the styling of the app. The app should look like the following screenshot.

Image showing the final todo list cleaned up view

Now you have built a working Todo app which stores the todo items in memory. From here you could update the app to store the todo items in localStorage/IndexedDb, or integrate this with a server-side database, or other backend, for more permanent storage.

Recap

In this tutorial you have created a new React app using Visual Studio 2022. The app consists of a todo list, which includes support to add tasks, delete tasks and to reorder them. You created two new React components and used those throughout this tutorial.

Resources

Below are some links to related resources.

Feedback

You can share feedback with us via Developer Community: report any bugs or issues via report a problem and share your suggestions for new features or improvements to existing ones. You can also leave a comment here or reach out to Sayed on Twitter at @SayedIHashimi.

The post Creating a React TODO app in Visual Studio 2022 appeared first on Visual Studio Blog.

Effortless Instrumentation profiling with Persistent Target Selection

$
0
0

Ever wished to assess your code’s performance without repeatedly choosing the target process or executable for each instrumentation profiling session? If so, you’re among many developers who find this task cumbersome and prone to errors, especially when profiling the same target repeatedly.

We understand your frustration and have a solution: Visual Studio 2022 introduces a new feature that addresses this issue. The instrumentation tool now remembers your target selection across runs, providing a seamless experience and enhancing the continuity of your profiling sessions.

Image of a speedometer

With this improvement, you can maintain your specified target across multiple instrumentation runs, eliminating the need for repetitive selection tasks. This means you can focus more on analyzing the performance data and optimizing your code, rather than wasting time and effort on setting up the profiling session.

How does it work?

To use this feature, you need to have Visual Studio installed and the Performance Profiler (ALT+F2) enabled. Then, follow these simple steps:

  1. Launch the Performance Profiler and select Instrumentation as the profiling method.
  2. Click the Target button and choose the process or executable you want to profile.
  3. Click Start to begin the profiling session. Visual Studio will collect and display the performance data in the Diagnostic Tools window.
  4. When you’re done, click Stop to end the profiling session. Visual Studio will show you a summary of the results and allow you to drill down into the details.
  5. Click cancel in the dialog box to reset the persisted selection.

If you want to run another instrumentation profiling session on the same target, you don’t need to select it again. Just click Start and Visual Studio will remember your last choice and use it as the default target. When you add a new method, class, or project, these new targets are automatically selected based on whether their parent was previously selected. This proactive approach ensures that no new additions are missed and helps maintain comprehensive profiling coverage. You can still change the target if you want to, but you don’t have to.

Image showing items to instrument in Visual Studio

Enjoy the convenience and efficiency of persistent target selection!

Why should you use it?

This feature is designed to help you streamline your workflow and improve your productivity when using the instrumentation tool. By persisting the target selection between runs, you can:

Save time and avoid frustration by reducing the number of clicks and interactions needed to set up a profiling session.

Minimize the risk of selecting the wrong target or forgetting to select one, which could lead to inaccurate or missing performance data.

Maintain consistency and comparability of the performance data across multiple profiling sessions on the same target.

Focus more on the performance analysis and optimization of your code, rather than the configuration and management of the profiling session.

Concluding thoughts

We hope you find this feature valuable for your development journey. Your feedback and suggestions are invaluable to us as we strive to enhance it further. Please share your thoughts through the Visual Studio Developer Community or the Report a Problem tool in Visual Studio.

Thank you for choosing Visual Studio and for your continuous feedback that helps us make it better every day.

Stay connected with the Visual Studio team by following us on Twitter @VS_Debugger, Twitter @VisualStudio, YouTube, and LinkedIn.

The post Effortless Instrumentation profiling with Persistent Target Selection appeared first on Visual Studio Blog.

Visual Studio 2022 – Recent performance enhancements 

$
0
0

Visual Studio 2022 continues to be faster with each version. In this blog post we will highlight a couple of the more significant enhancements you’ll experience in 17.11, such as a more efficient C# language service, faster conditional breakpoints and symbol searches in C++.

Reduced CPU usage by C# language service

Code Indexing

In 17.10 we revamped the code indexing system in the C# language service (Roslyn). It used to be both aggressive and highly intermittent.  This would lead to high spikes of CPU usage, taking resources away from the operations users were performing, especially during times like solution load.  After opening a solution, users who wanted to wait for VS to settle would have to wait up to minutes watching a progress bar titled “Running low priority background processes”.

Now, we no longer preemptively run all the indexers.  Instead, individual ones are run on demand.  In 17.11, these indexers were further streamlined, and made much more incremental, allowing them to consume far less resources when absorbing any change into the index. In addition, there were memory allocation optimizations throughout the editor and managed language services. The net effect of this is a more responsive VS that is ready to go at a much sooner time, with much lower CPU consumption.

Source Generators

As part of our continued work to break VS into isolated, high performance, services, Roslyn’s Source Generator execution host was moved out of the main VS process to a high-performance .NET 8 host.  This helps make VS more resilient to bugs in source generators and allows them to execute much more efficiently.  As part of this work, we also changed the execution model for source generators to no longer run automatically, due to the heavy impact that some generators can still have on the system.  Instead, by default, generators will now run when a document is saved, or a project is built, greatly cutting down on the impact of all generators (especially very expensive ones).  This behavior can be controlled here:

Tools > Options > Text Editor > C# > Advanced > Source Generators

A screenshot of a computer Description automatically generated

With the above changes in place, our data shows improved metrics in 17.11. CPU usage is down by 16% percent or more in sessions that had heaviest CPU usage. The C# completion list now appears sooner; looking at the slowest sessions the number of times the list takes longer than 0.5 seconds to appear has been cut by about 40%.

Improved conditional breakpoint performance

In 17.11 we made several changes to improve the performance of conditional breakpoints in C++. The improvements were primarily in two categories:

  • Avoiding expensive Windows debugging API calls. Windows calls to get and set information about the debugged process can be expensive, so the data was cached to reduce the number of calls to these APIs. Additionally, some of the information was already available through other sources, allowing some calls to be eliminated entirely.
  • Reducing data fetched from the debugged process. When a breakpoint is hit, the debugger must fetch a lot of information about the state of the debugged process. This is needed to populate things such as the locals tool window, the Diagnostics Tools window etc. However, to evaluate whether a conditional breakpoint’s conditions have been met, we need only a subset of that information. Now we fetch only the necessary pieces of information.

With these optimizations in place, we measured up to ~67% reduction in debugger overhead in a test application compared to 17.10.

Optimized Symbol Search for C++ language service

In 17.11 we reimplemented the text indexing system for C++ symbols. Before this change, C++ language service processed the symbol text directly to answer All-in-one-Search (AIOS) queries. We would load all the text into memory and traverse it to find matching candidates. This approach was relatively fast, but not optimal; not to mention having to keep the text cached in memory. In 17.11 we started using SQLite’s FTS5 search extension. The index is computed when the solution is parsed after it is opened, and then the language service can perform Symbol Search without any additional loading of text into memory. All the results are available faster and with less memory usage: we’ve seen the slower AIOS symbol searches up to 65% faster in 17.11. We hope you’re experiencing this improvement in your larger codebases.

Share your feedback and stay connected with Visual Studio!

We appreciate the time you’ve spent reporting issues/suggestions and hope you continue to give us feedback when using Visual Studio on what you like and what we can improve. Your feedback is critical to help us make Visual Studio the best tool it can be! You can share feedback with us via Developer Community: report any bugs or issues via report a problem and share your suggestions for new features or improvements to existing ones.

Stay connected with the Visual Studio team by following us on YouTube, Twitter, LinkedIn, Twitch and on Microsoft Learn.

On behalf of the entire Visual Studio team, thanks for reading and Happy Coding!

The post Visual Studio 2022 – Recent performance enhancements  appeared first on Visual Studio Blog.


Discover Hidden Insights with Profiler’s External Code Decompilation

$
0
0

Have you ever wondered what’s happening under the hood of your .NET application? Do you want to quickly and easily identify and fix performance bottlenecks? If so, Visual Studio has the perfect tool for you: the profiler.

The profiler allows you to analyze your code’s performance, pinpoint hot paths, detect memory leaks, address thread contention, and more. It helps you measure CPU usage, memory consumption, and file activity, and lets you drill down into specific methods and lines of code.

But what if the code you need to profile isn’t yours? What if it’s a third-party library, a NuGet package, or a framework component without source code access? How can you uncover what’s happening inside those black boxes?

That’s where the new auto-decompilation feature comes in handy.

image showing the hot path

With Visual Studio 2022, the profiler can automatically decompile the .NET code that you don’t have the source code for and show you the decompiled C# or Visual Basic code in the source view. This way, you can gain insights into the code’s structure and performance issues, even without loaded symbols or exact file locations.

This feature is particularly helpful when dealing with non-user external code, empowering you to analyze and optimize your application’s performance effectively, thus enhancing your development workflow.

How to Use Auto-Decompilation in Visual Studio Profiler

To use this feature, make sure Automatically decompile code during source lookup in the Tools > Options > Debugging > General settings is enabled. Then, you can launch the profiler from the Debug > Performance Profiler menu, or by pressing Alt+F2.

Once the profiler is running, you can select the type of analysis you want to perform, such as CPU Sampling, Memory Usage, or .NET Object Allocation Tracking. The profiler will collect the data and display it in various views, such as Call Tree, Functions, Modules, or Caller/Callee. You can also use filters, search, and grouping options to narrow down the results.

Gif getting to the decomp experience in the .NET Alloc tool, showing data collection then showing the external code decompilation from Go To Source

To view the source code of a function, simply double-click on it in any of the views, or right-click and select “Go To Source.” If the source code is available, the profiler will open it in the editor. If not, the profiler will attempt to decompile the code and display it in a read-only window. This allows you to inspect the code, view line numbers, and navigate to the callers and callees.

Additionally, you can compare snapshots of the same function taken at different times to see how the code has changed. This helps you identify performance regressions or improvements and understand the impact of your code changes.

Keep in mind that decompiled code may not be identical to the original, as some information can be lost during compilation. However, the decompiled code should be close enough to provide a good understanding of what the code does and how it impacts your app’s performance

We Want to Hear from You

We hope you find this feature useful in improving the performance of your .NET applications. We are committed to enhancing Visual Studio and greatly value your feedback. Please share your thoughts on this feature and any suggestions or issues by using the Help > Send Feedback > Report a Problem or Provide a Suggestion options in Visual Studio, or by leaving a comment below. Thank you for your continuous support!

Stay connected with the Visual Studio team by following us on Twitter @VS_Debugger, Twitter @VisualStudio, YouTube, and LinkedIn.

The post Discover Hidden Insights with Profiler’s External Code Decompilation appeared first on Visual Studio Blog.

Accelerate C++ Debugging with Enhanced Conditional Breakpoints

$
0
0

Are you tired of waiting for your conditional breakpoints to hit in C++? Do you wish there was a way to speed up the debugging process and get to the root of the problem faster? If so, you’re in luck!

We have some exciting news for you: Visual Studio 2022 has significantly improved the performance of conditional breakpoints in C++ through a reworked implementation. This means you can now debug your C++ code faster and more efficiently than ever before.

Image showing a conditional breakpoint

What are conditional breakpoints?

Conditional breakpoints are a powerful debugging tool that only triggers when a specified condition is met. For instance, you can set a conditional breakpoint to pause your program’s execution when a variable reaches a certain value or when an expression evaluates to true.

These breakpoints are particularly useful for debugging complex scenarios, allowing you to concentrate on specific cases or situations. They help you avoid unnecessary steps and iterations, making your debugging process more efficient and focused.

How did we improve them?

We revisited the implementation and looked for potential improvements that could be made around the hot path for conditional breakpoints. Since the implementation can be very specific to the target language, we started by focusing on the C++ experience.

We realized that a lot of the expensive fetch operations made to the process memory and CPU registers can be cached while on the same break state. This improvement also impacts the regular debugging experience and is not limited to the conditional breakpoints.

We also revisited how we notify the debugger that a break has happened. Most of these operations can be delayed after the condition is evaluated or skipped altogether when the breakpoint condition is false, for example.

We also reduced the overall processing such that we only fetch the minimal information needed for evaluating the breakpoint condition, such as when retrieving the call stack information or when retrieving the necessary registers from the CPU.

How much faster are they now?

Our initial assessment indicates a performance improvement of at least 35% in version 17.10 and 70% in version 17.11 Preview 2. The benchmark application consists of a while loop that iterates 80,000 times before hitting the breakpoint, once the condition is met. We reduced the execution time from 80 seconds to 21 seconds.

You can see the difference in performance in the video below. The left side shows the conditional breakpoints performance in version 17.9, while the right side shows the performance in version 17.11 Preview 2 onwards.

Gif showing a sidexside comparison of conditional break points in 17.9 vs 17.11

How can you try it out?

If you want to try out the enhanced conditional breakpoints performance in C++, you need to have Visual Studio 2022 version 17.11 or higher installed on your machine.

Once you have installed Visual Studio 2022, you can set conditional breakpoints in C++ as usual. To set a conditional breakpoint, right-click on the breakpoint icon in the editor and select “Conditions”. Then, enter the condition you want to apply to the breakpoint and click OK.

You can also edit or remove the condition of an existing breakpoint by right-clicking on the breakpoint icon and selecting Edit Conditions or Delete Condition.

We want to hear from you!

We hope you find the enhanced performance of conditional breakpoints in C++ beneficial for your debugging needs. Our commitment to making Visual Studio better and faster for you drives us to continuously seek your feedback and suggestions.

If you have any comments, questions, or issues regarding conditional breakpoints in C++ or any other feature of Visual Studio, please let us know via the Report a Problem tool in Visual Studio.

Stay connected with the Visual Studio team by following us on Twitter @VS_Debugger, Twitter @VisualStudio, YouTube, and LinkedIn.

Thank you for using Visual Studio, and happy debugging!

The post Accelerate C++ Debugging with Enhanced Conditional Breakpoints appeared first on Visual Studio Blog.

Easier localization with the new resource (.resx) manager

$
0
0

If you’re developing applications that target multiple languages and cultures, you probably know how challenging it can be to manage the resources for each localization. You need to keep track of all the strings, images, icons, and other assets that are specific to each culture, and make sure they are consistent and up to date across your project.

Fortunately, Visual Studio has a solution for you: the revamped Resource Explorer. This new feature lets you view, edit, and manage all your resources in one place, with a sleek and intuitive interface that is designed for the modern .NET developer.

Image of the resource explorer with many items displayed

In this blog post, we’ll show you how to use the Resource Explorer UI to improve your productivity and quality when working with resources in .NET apps. We’ll cover how to:

  • Load multiple files and view all localizations at once
  • Search and filter resources by name, value, or comment
  • Add comments to each translation of a resource
  • Validate placeholders and detect missing translations
  • Customize the accessibility and settings

Ready to explore? Let’s get started!

Load multiple files and view all localizations at once

One of the main advantages of the new Resource Explorer is that it allows you to load multiple files and view all the localizations for each resource in the same view. This makes it easy to compare and edit resources across different cultures, without having to switch between tabs or windows.

To use the new Resource Explorer, you need to have a .NET project that contains one or more resource files (.resx). To open a resource file with the Resource Explorer, right-click on any resource file in the Solution Explorer and select Open With > Resource Explorer. Resource files in the Solution Explorer can also be opened with a double click. Alternatively, you can navigate to the Resource Explorer and view any number of resource files included in the solution by navigating the Visual Studio toolbar via View > Other Windows > Resource Explorer.

Screenshot of the new Resource Explorer data grid UI

Once you open the Resource Explorer, you’ll see a data grid that shows all the resources in the selected file(s), along with their values for the default culture and other cultures. The localizations in the default culture, usually the language used by the developer in Visual Studio, are displayed as neutral values. To add more resources, click on the Create Resource button on the toolbar and configure the resource you want to include.

You can use the checkbox selections on the left side of the screen to configure which of the solution’s resource files will be visible in the data grid.

screenshot of file selection UI

For resources localized in multiple languages, you can change which translation columns are visible in the grid by configuring the columns in the Columns button in the Resource Explorer toolbar.

Screenshot of column configuration via toolbar

You can now see all the resources and their translations in a single view, with each column representing a different file or culture. You can resize, reorder, or hide columns as you wish, and use the horizontal scroll bar to navigate through the grid.

Search resources by name, value, or comment

If you have a large solution with many resources, you might want to search for a specific resource or filter out the ones you don’t need. The new Resource Explorer makes this easy with the search and filter functionality.

To search for a resource, type in the search box on the toolbar and press Enter. The data grid will show only the resources that match your query in their name, value, or comment.

Screenshot of search results for search term “button”

Note that the search functionality will only search the files and resource groups that have been selected to be visible in the data grid. To include more files in your search, you must select the checkboxes for the corresponding resource groups in the left pane of the UI before searching. This selection can be used to filter for specific files or resource groups, helpful for when you want to only view resources in a particular resource group, or you don’t want certain resources to be visible in the grid.

Add comments to each translation of a resource

Comments are a useful way to provide more information or context for a resource, such as the meaning, usage, or tone of a string. In the Resource Explorer UI, you can add comments to each translation of a resource and view them all at once in the data grid.

To add a comment to a resource, right click on the cell that corresponds to the translation you want to comment on and click on the “Edit Comment” button on the dropdown. A comment box will appear beside the cell, where you can type in your comment. Press Enter to save the comment or navigate away from the comment box without hitting enter to discard it.

You can also edit or delete existing comments by right clicking on the comment box. To view all the comments for a resource, look for the small comment icon in the corner of each cell that has a comment. You can hover over the icon to see a tooltip with the comment text or click on it to open the comment box.

Screenshot of comment icon on a resource cell

Validate placeholders and detect missing translations

Another benefit of the Resource Explorer UI is that it helps you ensure the quality and consistency of your resources, by validating placeholders and detecting missing translations.

Placeholders are special tokens that are replaced by dynamic values at runtime, such as {0}, {1}, or {name}. If you use placeholders in your resources, you need to make sure they are consistent across all localizations, otherwise you might see errors or unexpected behavior in your app.

The new Resource Explorer automatically validates placeholders for each resource and shows a warning icon if there is a mismatch between the default culture and any other localization. For example, if the default value of a resource is “Hello {0}, how are you {1}?” and the Spanish value is “Hola {0}!”, you’ll see a warning icon because the {1} placeholder is missing in the Spanish value. You can hover over the icon to see a tooltip with the details of the mismatch.

Screenshot of placeholder validation warning

Missing translations are another common issue that can affect the user experience of your app. If you don’t provide a translation for a resource in a certain culture, the app will fall back to the default culture, which might not be proper or desirable for some users.

The Resource Explorer UI helps you avoid this problem by showing a warning icon if there is no value for a resource in a certain culture. For example, if you have a resource with a default value of Main text viewer and no value for the Czech culture, you’ll see a warning icon showing that the translation is missing. You can hover over the icon to see a tooltip with the message “Missing resource in cultures: [all cultures for which you are missing a translation]”. In future versions of the Resource Explorer, these warnings will be configurable.

Screenshot of missing resource translation warning

Customize the accessibility and settings

The last feature we want to highlight is the accessibility of the UI and the ability to customize the UI settings of the Resource Explorer to suit your preferences and needs.

We have improved the compatibility of the Resource Explorer UI with screen readers and assistive technology, to make it more accessible for developers with visual impairments or disabilities. You can use keyboard shortcuts to navigate through the data grid, edit values and comments, and perform common actions. You can also use the narrator to read each cell’s contents, as well as the tooltips and warnings.

We also have several supported keyboard shortcuts for the new Resource Explorer as follows:

Shortcut Action Supported
Control + A Selects all cells ✅
Shift + right arrow Extends selection one cell to the right ✅
Shift + left arrow Extends selection one cell to the left ✅
Shift + down arrow Extends selection one cell down ✅
Shift + up arrow Extends selection one cell up ✅
F2 Places focus on text inside a cell (enter edit mode) ✅
A subsequent press of F2 restores focus to the cell and restores grid navigation functions (exit edit mode) ✅
Control + Shift + R Add a resource ✅
Control + Del Delete a resource* ✅
Control + D Duplicate a resource* ✅
Control + Shift + M Move resource to a different file* ✅
Control + X Cut* ✅
Control + C Copy* ✅
Control + P Paste* ✅
Shift + F2 Add or edit a comment ✅
Shift + Alt + F2 Delete a comment ✅
Control + Shift + V Replace file

This applies for non-string resources, like an image

✅
Control + Shift + L Open visible Columns menu ✅
Control + Shift + C Toggle neutral comment column ✅
Enter Moves focus to the next cell below ✅
Tab Moves focus to the next cell to the right or the first one in the next row ✅
Shift + Tab Moves focus to the next cell to the left or the last one in the row above ✅
Shift + Space Select the row that contains focus ✅
Control + I Go to search bar ✅
Control + Alt + left arrow Move focus from grid to tree view 🔨
Control + Alt + right arrow Move focus from tree view to grid 🔨

*Indicates that the operation is currently only supported when you have an entire row selected

We have also added zoom functionality to the data grid to allow you to adjust the size of the text and icons according to your liking. Use Ctrl + your mouse wheel to zoom the grid and make the text size bigger.

Finally, we have enabled theming for the Resource Explorer UI to make it consistent with the rest of the Visual Studio environment. The Resource Explorer will now pick up your theme and font styling from the rest of the IDE. You can choose between light, dark, or blue Visual Studio themes via Tools > Theme and the Resource Explorer UI will adapt accordingly, just like you expect for the rest of Visual Studio. You can also change the font and colors of the data grid, by using the Tools > Options > Environment > Fonts and Colors dialog.

Conclusion

We hope this blog post has given you a good overview of the new features and improvements of the Resource Explorer UI in Visual Studio. We think this feature will make your life easier and more productive when working with resources in .NET apps, and we’d love to hear your feedback and suggestions.

We want to thank you for your continuous feedback and support, which helps us make Visual Studio better and better. Please keep it coming by using the Report a Problem tool in Visual Studio, or by sharing your ideas on the Developer Community website.

Happy coding!

The post Easier localization with the new resource (.resx) manager appeared first on Visual Studio Blog.

Improve your debugger game with editable expressions

$
0
0

Do you ever wish you could quickly test different queries on your collections or datasets while debugging? Do you want to save time and avoid writing code just to inspect your data? If you answered yes, then you will love the new editable expression feature in the Visual Studio debugger.

This feature allows you to modify the expressions textbox on the top of the IEnumerable visualizer dialog with your desired LINQ expressions. The visualizer updates in real-time, reflecting the data change resulting from your query. You can easily apply different filters or sort orders to your collections based on your needs.

In this blog post, we will show you how to use this powerful feature and how it can help you debug more efficiently and effectively.

Getting started

In a debugging session, launch the IEnumerable visualizer by hovering over a collection or dataset variable in the debugger and clicking on the magnifying glass icon. Alternatively, you can right-click on the variable and select View Visualizer from the context menu.

Image of highlighted View Visualizer option from the context menu.

This will open the IEnumerable visualizer dialog, where you will see the expressions textbox on the top. You can type any valid LINQ expression in this textbox and hit <ENTER> to apply it to your collection. The visualizer will update the data grid below with the result of your query.

Image of IEnumerable Visualizer, Expression box highlighted with nums2 in it

Use cases for editable expressions

The editable expression feature can be very useful for debugging dense datasets and complex collection manipulations. You can experiment with different data transformations and filters directly within the Visual Studio debugger, without having to write any code or switch to another tool.

For example, suppose you have a collection of products that you want to inspect. You can use the editable expression feature to filter out the products that are out of stock, sort them by price, and select only the name and price properties. Here is how you can do that:

Image of Visualizer formatting data

As you can see, the editable expression feature allows you to quickly and easily manipulate your data and see the results in the visualizer. You can also copy the expression from the textbox and paste it into your code if you want to use it in your application logic.

Give us your feedback

We hope you enjoy using the editable expression feature in the Visual Studio debugger. We would love to hear your feedback and suggestions on how we can improve it further. Please leave a comment below or use the Report a Problem tool in Visual Studio to let us know what you think.

We also want to thank you for your continuous feedback and support, which helps us make Visual Studio better for you. Stay tuned for more exciting features and updates coming soon!

Happy debugging!

The post Improve your debugger game with editable expressions appeared first on Visual Studio Blog.

Debug CMake Scripts on Linux with Visual Studio

$
0
0

If you are working on a CMake project that targets Linux, you may have encountered some challenges when trying to debug your CMake scripts and CMakeLists.txt files. You may have wondered why your variables are not set correctly, or why your custom commands are not executed as expected. Or you may have simply wanted to step through your CMake scripts and see what is happening behind the scenes of the configure step.

We are excited to announce that the CMake debugger in Visual Studio now has support for CMake projects targeting Linux via WSL or SSH. The CMake debugger allows you to debug your CMake scripts and CMakeLists.txt files using the familiar Visual Studio debugger experience.

You will need CMake version 3.27 or greater installed on your remote Linux machine to have access to the CMake debugging feature.

CMake Script highlighted in parallel stack window

How to use the CMake debugger

Using the CMake debugger is straightforward in Visual Studio. All you need to do is set a breakpoint in your CMakeLists.txt file or any .cmake script file and then navigate to Project > Configure Cache with CMake Debugging.

Image showing Configure Cache with CMake debugging highlighted in the Project dropdown

This will launch the CMake debugger and stop at your breakpoint. You can then inspect the values of your CMake variables, evaluate expressions, watch the output of your custom commands, and step through your CMake code using the familiar Visual Studio debugger.

Linux Machine Compatibility

The CMake debugger works for both WSL and SSH connections. WSL connections are automatically detected in Visual Studio and you can add SSH connections via the Connection Manager under Tools > Options and then Cross Platform > Connection Manager.

Image showing the Tools, Options menu Connection Manager

You can always toggle the target machine in your CMake projects by using the Target System dropdown in the top of Visual Studio.

WSL: Ubuntu highlighted

What’s next?

We hope you enjoy using the CMake debugger and find it useful for your CMake projects. We would love to hear your feedback and suggestions on how to improve it further. Please let us know what you think by using the Send Feedback button in Visual Studio.

Thank you for your continuous feedback and support that make Visual Studio better every day.

The post Debug CMake Scripts on Linux with Visual Studio appeared first on Visual Studio Blog.

Viewing all 1144 articles
Browse latest View live


<script src="https://jsc.adskeeper.com/r/s/rssing.com.1596347.js" async> </script>