Quantcast
Channel: Visual Studio Blog
Viewing all 1144 articles
Browse latest View live

Get Hands-On with Visual Studio, .NET, AI, and More at Live! 360 next month.

$
0
0

Visual Studio LIVE! Orlando 2024 November 17-22 | Loews Royal Pacific Resort, Orlando, FL

We’re only four weeks away from the final Visual Studio Live! event of the year, and we’re close to capacity! Live! 360 Orlando offers something for everyone—whether you’re a developer, IT professional, data specialist, or cybersecurity expert. You’ll have the opportunity to learn from industry leaders while networking with peers who share similar roles.

Packed Hands-On Labs and Workshops

The week kicks off and wraps up with two full days of hands-on labs and workshops, featuring top experts like GitHub’s Brian Randell and Mickey Gousset, along with Microsoft’s own James Montemagno and Jon Galloway. Learn directly from MVPs and seasoned professionals to deepen your technical skills in real-world scenarios.

Over 300 Sessions Across 40 Tracks

Live! 360 Orlando is one of the most hands-on, knowledge-packed events of the year, featuring over 300 sessions spread across 40 tracks. Whether you’re interested in the latest developments in .NET 9, Azure AI, Microsoft Copilot, or building Copilot Agents, there’s a session for you. Plus, a dedicated conference within Live! 360 focuses exclusively on cybersecurity, ensuring you’ll stay ahead of the latest threats.

Keynote Highlights

  • Live! 360 Keynote: Building Lovable Software for Millions of Users November 19, 11:00 AM – 12:00 PM Join Mads Kristensen, Principal Product Manager at Microsoft, as he shares insights on how the Developer Division designs software to meet the diverse needs of IT pros, DBAs, security specialists, data scientists, and developers worldwide. Learn from Mads’ experience about overcoming challenges and creating essential, beloved products for millions of users.
  • Visual Studio Live! & Cloud & Containers Live! Keynote: The Cloud-Native, Run Anywhere Future of .NET 9 Is Here! November 19, 8:00 AM – 9:00 AM Featuring Jon Galloway, Rachel Kang, and James Montemagno, this keynote will showcase the incredible potential of .NET 9 for cloud-native development and its evolving capabilities for running anywhere.
  • Data Platform Live! Keynote: Secure, Unified, and Scalable Data in the Era of AI November 19, 8:00 AM – 9:00 AM Presented by Davide Mauri and Drew Skwiers-Koballa, this keynote will dive into how Microsoft Azure Data technologies provide the secure, scalable platforms needed to leverage AI and build next-gen applications.
  • Artificial Intelligence Live! Keynote: How and Why, AI is Redefining Your Apps November 19, 8:00 AM – 9:00 AM Steve Sanderson will explore how AI-driven features like semantic search, data extraction, and intelligent workflows are transforming modern software development.

Exclusive Networking Opportunities

Live! 360 Orlando offers unmatched opportunities to network with top experts and fellow professionals. With attendance capped at just 1,500, you’ll have the chance to meet speakers and product managers in casual settings. Don’t miss the Welcome Reception on Monday evening and visit our speaker’s booth throughout the event. Whether you want to discuss GitHub Copilot or the future of .NET, these events provide the perfect opportunity to connect.

Register Now and Save

If you’re a Visual Studio Professional or Enterprise Subscriber, you can unlock exclusive discounts through My.VisualStudio.com. Not a subscriber? No problem—take advantage of our early bird pricing on the Live! 360 event page. But act fast—space is limited, and this event is sure to sell out!

We can’t wait to see you in Orlando for a week of hands-on learning, expert insights, and valuable connections!

Be sure to track me down and say hello, I’m looking forward to meeting you.

The post Get Hands-On with Visual Studio, .NET, AI, and More at Live! 360 next month. appeared first on Visual Studio Blog.


Upgrade Your Windows Forms .NET Projects to the Latest .NET Version for Enhanced Security

$
0
0

Each release of .NET introduces a host of new features and bug fixes that enhance both performance and security. To leverage these benefits both service and desktop application developers must upgrade their applications to the latest .NET versions. Just like other developers wanting to take advantage of the latest .NET enhancements, we are actively upgrading the Windows Forms (WinForms) Out-of-Process Designer used for .NET application design. This upgrade will enhance the safety of the Designer and motivate WinForms developers to update their applications for improved security.

However, upgrading the WinForms Designer to a newer .NET version means it will no longer support designing forms in projects targeting older unsupported .NET versions. This means developers too will need to update their projects to supported .NET runtimes in order to design their forms in Visual Studio.

It is Time to Upgrade!

Upgrading the WinForms Designer and your applications to newer .NET versions not only enhances security but also improves design-time reliability and performance by leveraging the enhancements available in those .NET versions and referenced NuGet packages. We strongly recommend keeping your applications updated with the latest .NET versions.

While the WinForms Designer process is also a .NET application and similar guidance applies, its situation differs. The Designer functions as a platform that must support applications targeting all .NET versions, starting with the version it currently targets. If we retarget the Designer process to .NET 9.0, it will no longer support applications built on earlier .NET versions, disrupting many customers. Therefore, we must carefully choose a .NET version for the Designer that can support the maximum number of projects and applications while still maintaining high security standards. Also, we understand that many enterprises choose to target LTS versions for longer support. For these reasons we are choosing our update cadence for the designer to be LTS based. We will target the Designer to the .NET LTS version which is just going out of support. Developers are always encouraged to target their applications to the latest .NET version their organization supports.

Beginning with the VS 17.12 Preview 3 release, the WinForms Designer will automatically check your project’s target framework version. If it falls below the minimum supported .NET LTS version by the Designer, you will receive a notification displayed prominently in an InfoBar. This feature will keep you informed about your project’s compatibility, allowing easy access to a list of .NET versions and their support status.

Screenshot of Windows Forms .NET Designer displaying the new InfoBar.

Future Support for WinForms Designer with respect to .NET Runtimes

Each time a .NET LTS release reaches its end of support, the next Visual Studio release will update the WinForms Out-of-Process Designer to target that LTS release. For example, when .NET 6.0 LTS goes out of support in November 2024, the following Visual Studio release, 17.13, will retarget the Designer process to .NET 6.0. Consequently, projects targeting .NET versions below 6.0, such as .NET Core 3.1 and .NET 5.0, will no longer load in the Designer. Hence, we highly recommend upgrading your application to the latest .NET release to remain compatible with Visual Studio 17.13 or newer versions. You can use Designer in Visual Studio 17.12 to migrate. For more information refer to VS Product Life Cycle and Servicing wiki.

For Visual Studio 17.13, we will not target the next supported LTS version, 8.0, nor will we follow this policy for non-LTS releases like 7.0, to allow enterprises and developers sufficient time to test and deploy their next updates.

The following table outlines the WinForms Designer support policy going forward. While it currently focuses on .NET 6.0 and .NET 8.0, the same pattern will apply to future .NET LTS releases.

.NET LTS Release End of support (E) WinForms Designer support policy for next VS release after (E)
6.0 Nov 2024 – Designer will support projects targeting .NET 6.0 and newer versions.

– Versions below 6.0 will not be supported.

8.0 Nov 2026 – Projects targeting .NET 8.0 and newer versions will be supported.

– Versions below 8.0 will not be supported.

As .NET 8.0 reaches end-of-support, we will promptly upgrade the Designer process to .NET 8.0 in the subsequent Visual Studio release. This proactive approach ensures that you stay current with your projects while maintaining compatibility with the WinForms Designer in newer Visual Studio versions. You can learn more about the .NET release lifecycle in this wiki.

Important Note: These changes will only impact the design-time experience of the WinForms Designer. At runtime, all .NET versions will continue to function as they do now.

Conclusion and call for feedback

In today’s rapidly evolving landscape, prioritizing security in software development is essential, and it requires the commitment of all developers. The WinForms Designer team is dedicated to improving security, but we need your collaboration to ensure that projects remain updated with the latest .NET versions. While this may feel like a significant change, it is a necessary step toward enhancing the security of the WinForms Designer and your applications.

We appreciate the time you’ve spent reporting issues/suggestions and hope you continue to give us feedback when using Visual Studio on what you like and what we can improve. Your feedback is critical to help us make Visual Studio the best tool it can be! You can share feedback with us via Developer Community: report any bugs or issues via report a problem and share your suggestions for new features or improvements to existing ones.

Stay connected with the Visual Studio team by following us on YouTube, Twitter, LinkedIn, Twitch and on Microsoft Learn.

The post Upgrade Your Windows Forms .NET Projects to the Latest .NET Version for Enhanced Security appeared first on Visual Studio Blog.

Easily add Unreal Engine classes to your C++ project

$
0
0

Visual Studio 2022 v17.11 introduces a new Add Unreal Engine Class dialog that lets you easily add common Unreal Engine classes to your project. You can also choose to which module to add your class, so you can keep your code organized and modular.

Adding the Unreal Engine Character Base classs

To use this feature, you need to have an Unreal Engine project open in Visual Studio. Right click on the project in Solution Explorer and select Add > Unreal Engine Item. In the Add New Item dialog, select Unreal Engine Common Classes to open the Add Unreal Engine Class dialog. This dialog shows you a list of common Unreal Engine classes that you can use as a base for your new class. Once you select a base class, you can enter the name of your new class. You can also specify the module to which Visual Studio should add your class.

When you click OK, Visual Studio will generate the header and source files for your new class and add them to your project. You can then open the files and start writing your code.

Benefits of using the Add Unreal Engine Class dialog

The Add Unreal Engine Class dialog has several benefits over the previous way of adding Unreal Engine classes to your project. Some of the these benefits are:

You can choose from an expanded list of base classes by simply selecting one from the Base class list.

You can specify the module name for your class, which helps you organize your code into logical units. Modules are Unreal Engine plugins or projects that contain related classes and assets. By creating separate modules for your classes, you can improve the modularity, reusability, and maintainability of your code.

You can avoid naming conflicts and errors when adding classes to your project. The Add Unreal Engine Class dialog checks the validity of your class name and path and warns you if they conflict with an existing class or file. It also ensures that your class inherits from the correct base class and includes the necessary headers and macros.

Try it out

We hope you enjoy using the Add Unreal Engine Class dialog in Visual Studio. This feature is part of our ongoing effort to improve the C++ development experience for game developers. We would love to hear your feedback and suggestions on how we can make it even better. Please share your thoughts with us on Developer Community or Twitter.

We also want to thank you for your continuous feedback and support, which helps us make Visual Studio the best tool for developing games with Unreal Engine. Stay tuned for more updates and features coming soon.

The post Easily add Unreal Engine classes to your C++ project appeared first on Visual Studio Blog.

Create Unreal Engine modules faster

$
0
0

Unreal Engine modules help keep your code organized and modular. However, creating modules can be a tedious and error-prone process that involves manually editing configuration files and adding boilerplate code.

Visual Studio 2022 version 17.11 comes with a new dialog to help with this process. With the new Add Module dialog, you can quickly add new modules to your project without leaving Visual Studio or manually editing configurations.

How to use the Add Unreal Engine Module dialog

To use the Add Unreal Engine Module dialog, you need to have an Unreal Engine project open in Visual Studio. You can do this by opening the .sln file generated by the Unreal Editor from your project folder, or by opening the Unreal Engine project directly by opening the folder containing the *.uproject file through File->Open->Folder….

Ctrl+Shift+Alt+O to open a new folder

Once you have your project open, right click on the project in Solution Explorer and select Add > Unreal Engine Item. This will open the Add New Item dialog, where you can select Empty Unreal Engine Module to launch the Add Unreal Engine Module dialog. This dialog lets you specify the name, type, loading phase, and path of your new module.

Image showing the Add Unreal Engine Module

After you click OK, Visual Studio will create the module folder and files for you and update the project settings accordingly. Visual Studio also updates the *.uproject file, registering the module there and makes sure that the module builds. You can then start writing your module code right away or use the Add Unreal Engine Class dialog to add new classes to your module.

Why use Unreal Engine modules

Unreal Engine modules are a way of organizing your code into self-contained units that can be loaded and unloaded at runtime. Modules can contain C++ code, assets, shaders, blueprints, and other resources that are related to a specific functionality or feature.

Using modules has several benefits, such as:

  • Improving code readability and maintainability by separating concerns and reducing coupling.
  • Enhancing performance and memory usage by loading only the modules needed for a given context.
  • Enabling code reuse and sharing by creating libraries of common or generic modules that can be used across different projects or platforms.

Simplifying packaging and deployment by bundling modules together into plugins or DLCs.

To learn more about Unreal Engine modules, check out the official documentation.

Give us your feedback

We hope you enjoy using the new Add Module dialog and find it useful for your Unreal Engine development. We’d love to hear your feedback and suggestions on how we can improve this feature and make Visual Studio even better for you.

Thank you for your continuous support and feedback, which helps us make Visual Studio the best tool for your development needs.

The post Create Unreal Engine modules faster appeared first on Visual Studio Blog.

Unreal Engine Toolbar in Visual Studio

$
0
0

In Visual Studio 2022 version 17.11, we’ve added a new Unreal Engine toolbar to Visual Studio.

Image showing new tool bar with otpions like attach process, rescan blueprints, UE logs, and configure tools

The Unreal Engine toolbar is a new feature that provides quick access to common Unreal Engine tasks. You can find the toolbar at the top of your code window when you have an Unreal Engine project loaded. The toolbar includes the following actions:

Attach to Unreal Engine process: Lets you easily debug your game or editor by attaching to the running Unreal Engine process. You can choose which process to attach to from a drop-down menu.

Rescan Blueprints Cache: Refreshes the cache of Blueprint symbols in Visual Studio, which can help you resolve errors or warnings related to Blueprints.

Unreal Engine Log: Opens the Unreal Engine log window in Visual Studio, where you can view the output of your game or editor. The window captures log messages from running Unreal processes and makes it possible to see the output live while working on the game. You can also filter the log messages by severity or category using the built-in tools in Visual Studio.

Access Unreal Engine Configuration Page: pens the Unreal Engine configuration page in Visual Studio, where you can customize various settings for your Unreal Engine development. For example, you can enable or disable IntelliSense for Unreal Engine types, change the formatting style of your code, or set up additional paths for your project.

The Unreal Engine toolbar is designed to reduce the need to switch between different applications or windows. You can also customize the toolbar by adding or removing actions or moving it to a different location in Visual Studio.

Try it out

We hope you enjoy using the Unreal Engine toolbar in Visual Studio and we would love to hear your feedback. Please let us know what you think by leaving a comment below, or by using the Report a Problem tool in Visual Studio. Your input helps us make Visual Studio better for you and other Unreal Engine developers.

The post Unreal Engine Toolbar in Visual Studio appeared first on Visual Studio Blog.

The making of Bring Back Plus/Minus

$
0
0

A lesson about the software forensics process involved in developing the Bring Back Plus/Minus extension, which brings back the plus/minus symbols to the editor outlining feature in Visual Studio 2022.

While I did have the advantage of being able to look at the Visual Studio source code, I could have figured this out just as well without it, and that’s the focus of this article.

The investigation of how to bring back the plus/minus symbols started with this important clue from a comment on the Developer Community feedback ticket for this issue:

However, Visual Studio has a very rich extensibility model, and if users have strong feelings about the visuals in their IDE, I encourage people to try writing an extension to change the icon used here. The class that controls the expansion is this one: OutliningMarginHeaderControl

A quick internet search for the class name led me to this reference article for OutliningMarginHeaderControl Class where the definition contains the following valuable information:

  • Namespace: Microsoft.VisualStudio.Text.Editor
  • Assembly: Microsoft.VisualStudio.Text.UI.Wpf.dll
  • Package: Microsoft.VisualStudio.Text.UI.Wpf v17.9.187

Now that we know where to find this class, it’s time to examine the assembly. For that we will use the excellent ILSpy tool, which you can install from the Microsoft Store: ILSpy Fresh

Once you’ve installed ILSpy, launch it and load the assembly Microsoft.VisualStudio.Text.UI.Wpf.dll. You can find this assembly in the Visual Studio installation folder, usually in the following path:

<VSInstallDir>\Common7\IDE\CommonExtensions\Microsoft\Editor\Microsoft.VisualStudio.Text.UI.Wpf.dll

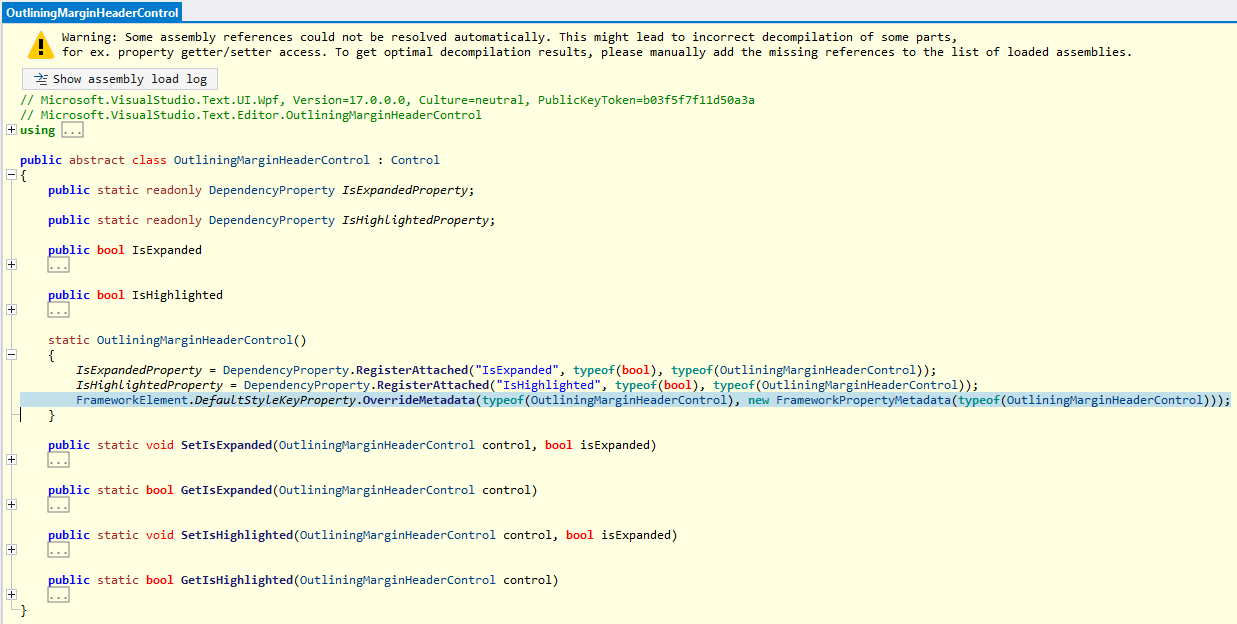
After the assembly is loaded, search for the class OutliningMarginHeaderControl in the Microsoft.VisualStudio.Text.Editor namespace and you will find the following code for the static constructor:

OutliningMarginHeaderControl in ILSpy

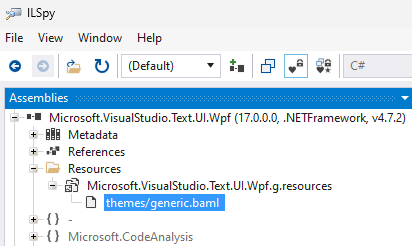
This is where the default style key for the control is being set. The next step is to find the XAML Style for the control. For that we open the Resources node where we find themes/generic.baml, which includes the entire style for the OutliningMarginHeaderControl:

generic.baml node in ILSpy


<Style x:Key="{x:Type textUiWpf:OutliningMarginHeaderControl}" TargetType="{x:Type textUiWpf:OutliningMarginHeaderControl}">
    <Style.Resources> 
      <ResourceDictionary> 
        <Geometry x:Key="ExpandRight">F1M2.146.146a.5.5,0,0,1,.708,0l4,4a.5.5,0,0,1,0,.708l-4,4a.5.5,0,0,1-.708-.708L5.793,4.5,2.146.854A.5.5,0,0,1,2.146.146Z</Geometry> 
        <Geometry x:Key="ExpandDown">F1M8.854,2.146a.5.5,0,0,1,0,.708l-4,4a.5.5,0,0,1-.708,0l-4-4a.5.5,0,0,1,.708-.708L4.5,5.793,8.146,2.146A.5.5,0,0,1,8.854,2.146Z</Geometry> 
      </ResourceDictionary> 
    </Style.Resources> 
    <Setter Property="Focusable" Value="False" /> 
    <Setter Property="FrameworkElement.Cursor" Value="Hand" /> 
    <Setter Property="Template"> 
      <Setter.Value> 
        <ControlTemplate TargetType="{x:Type textUiWpf:OutliningMarginHeaderControl}"> 
          <Grid> 
            <Viewbox Name="ExpandCollapseIcon" Width="9" Height="13" VerticalAlignment="Center"> 
              <Border Width="9" Height="13" Background="{DynamicResource outlining.chevron.background}"> 
                <Rectangle Name="ExpandCollapseRectangle" Width="9" Height="9"> 
                  <FrameworkElement.Resources> 
                    <ResourceDictionary> 
                      <SolidColorBrush x:Key="canvas" Opacity="0" /> 
                    </ResourceDictionary> 
                  </FrameworkElement.Resources> 
                  <Shape.Fill> 
                    <DrawingBrush Stretch="None"> 
                      <DrawingBrush.Drawing> 
                        <DrawingGroup> 
                          <DrawingGroup> 
                            <GeometryDrawing Brush="{DynamicResource canvas}" Geometry="F1 M9,0 L9,9 L0,9 L0,0" /> 
                          </DrawingGroup> 
                          <DrawingGroup> 
                            <GeometryDrawing Brush="{DynamicResource outlining.chevron.foreground}" Geometry="{StaticResource ExpandRight}" /> 
                          </DrawingGroup> 
                        </DrawingGroup> 
                      </DrawingBrush.Drawing> 
                    </DrawingBrush> 
                  </Shape.Fill> 
                </Rectangle> 
              </Border> 
            </Viewbox> 
          </Grid> 
          <ControlTemplate.Triggers> 
            <Trigger Property="textUiWpf:OutliningMarginHeaderControl.IsExpanded" Value="True"> 
              <Setter TargetName="ExpandCollapseRectangle" Property="Shape.Fill"> 
                <Setter.Value> 
                  <DrawingBrush Stretch="None"> 
                    <DrawingBrush.Drawing> 
                      <DrawingGroup> 
                        <DrawingGroup> 
                          <GeometryDrawing Brush="{DynamicResource canvas}" Geometry="F1 M9,0 L9,9 L0,9 L0,0" /> 
                        </DrawingGroup> 
                        <DrawingGroup> 
                          <GeometryDrawing Brush="{DynamicResource outlining.chevron.foreground}" Geometry="{StaticResource ExpandDown}" /> 
                        </DrawingGroup> 
                      </DrawingGroup> 
                    </DrawingBrush.Drawing> 
                  </DrawingBrush> 
                </Setter.Value> 
              </Setter> 
            </Trigger> 
          </ControlTemplate.Triggers> 
        </ControlTemplate> 
      </Setter.Value> 
    </Setter> 
</Style> 

This is the style for the new chevron symbols. Here we find interesting things like the geometry for the expand/collapse symbols, the colors, and the trigger that changes the symbol when the control is expanded. The next step is to find the original Style for the plus/minus symbols. For that we can either use an older VS installation or we can take advantage of the reference information above, which states that this control is included in the Microsoft.VisualStudio.Text.UI.Wpf v17.9.187 NuGet package. Now we know that the symbols changed in 17.9, so we will look for a version before that. For example, the last one before that is 17.8.222.

We can download the package, change its extension from .nupkg to .zip, and extract the assembly from the lib\net472 folder. Once we have the assembly, we can load it in ILSpy and look for the original style for the control just like we did before:


<Style x:Key="{x:Type textUiWpf:OutliningMarginHeaderControl}" TargetType="{x:Type textUiWpf:OutliningMarginHeaderControl}">
	<Setter Property="Focusable" Value="False" />
	<Setter Property="Template">
		<Setter.Value>
			<ControlTemplate TargetType="{x:Type textUiWpf:OutliningMarginHeaderControl}">
				<Grid>
					<Border Name="WhitePadding" Height="11" Width="9" BorderBrush="{DynamicResource ViewBackgroundBrush}" Background="{DynamicResource ViewBackgroundBrush}" BorderThickness="0,1,0,1" VerticalAlignment="Center">
						<Border Name="TheSquare" Height="9" Width="9" BorderBrush="{DynamicResource outlining.verticalrule.foreground}" Background="{DynamicResource outlining.square.background}" BorderThickness="1">
							<Canvas>
								<Line X1="1" Y1="3.5" X2="6" Y2="3.5" Stroke="{DynamicResource outlining.square.foreground}" />
								<Line Name="Vertical" X1="3.5" Y1="1" X2="3.5" Y2="6" Stroke="{DynamicResource outlining.square.foreground}" />
							</Canvas>
						</Border>
					</Border>
				</Grid>
				<ControlTemplate.Triggers>
					<Trigger Property="textUiWpf:OutliningMarginHeaderControl.IsExpanded" Value="True">
						<Setter TargetName="Vertical" Property="Visibility" Value="Hidden" />
						<Setter TargetName="TheSquare" Value="{DynamicResource ViewBackgroundBrush}" Property="Border.Background" />
					</Trigger>
				</ControlTemplate.Triggers>
			</ControlTemplate>
		</Setter.Value>
	</Setter>
</Style>

Since the new style no longer uses dynamic resources for outlining.square, we must assume that these resources are no longer available in the new version of VS. This means that we needed to replace these resources with other colors. For the foreground outlining.chevron.foreground made sense. The background was a little bit harder because outlining.chevron.background didn’t do anything. With a little experimenting I had settled on outlining.collapsehintadornment.background for the first version of the extension. Both were not ideal or what they used to be – the chevron foreground is quite a bit darker and the background for the plus symbol is a lot lighter than before, but this combination worked in both light and dark themes, and any other existing color resources would look wrong in one theme or another.

How to build a VSIX extension to override the style

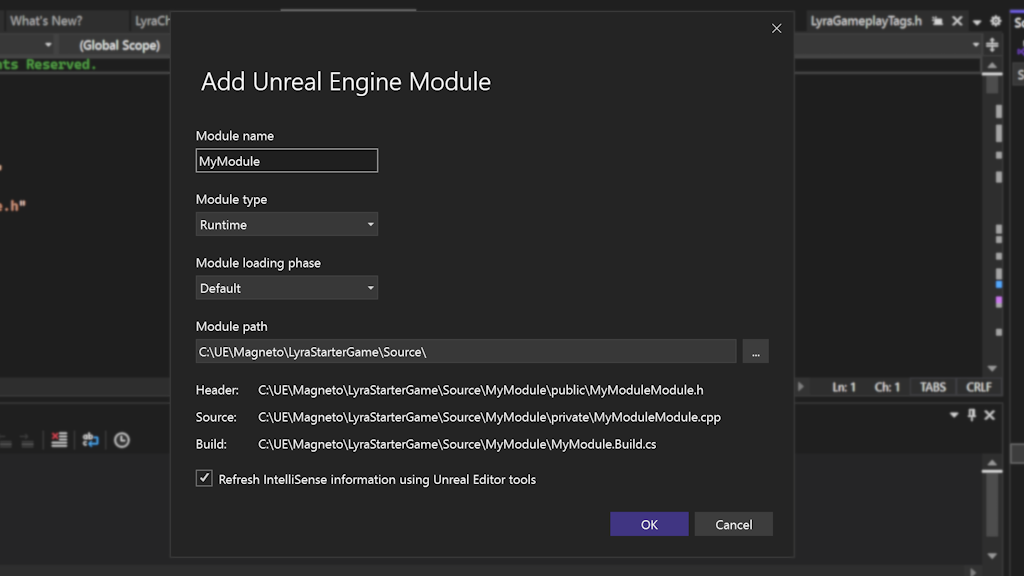
To override the style, I started by creating a new VSIX project with an async package:

New VSIX Project Template

Then I added a new ResourceDictionary file Style.xaml to the project and copied the style from the old assembly, pasted it into the ResourceDictionary, and updated it with the new color resource value. Make sure that the Build Action for this Style.xaml is set to Page. I also gave this style a key x:Key="OriginalOutliningMarginHeaderControlStyle", so that I can easily look it up later:


<ResourceDictionary
	xmlns="http://schemas.microsoft.com/winfx/2006/xaml/presentation"
	xmlns:x="http://schemas.microsoft.com/winfx/2006/xaml"
	xmlns:textUiWpf="clr-namespace:Microsoft.VisualStudio.Text.Editor;assembly=Microsoft.VisualStudio.Text.UI.Wpf">
	<Style x:Key="OriginalOutliningMarginHeaderControlStyle" TargetType="textUiWpf:OutliningMarginHeaderControl">
		...

The last thing that needed to be done was to override the style in the InitializeAsync method of the package. The following code loads the resource dictionary, looks up the style by its key, and places it in the current application’s resources using the implicit style key typeof(OutliningMarginHeaderControl), so that Visual Studio will find this Style first:


protected override async Task InitializeAsync(CancellationToken cancellationToken, IProgress progress) 
{ 
	// When initialized asynchronously, the current thread may be a background thread at this point. 
	// Do any initialization that requires the UI thread after switching to the UI thread. 
	await this.JoinableTaskFactory.SwitchToMainThreadAsync(cancellationToken); 
	var resourceDictionary = new ResourceDictionary(); 
	resourceDictionary.Source = new Uri("pack://application:,,,/BringBackPlusMinus;component/Style.xaml"); 
	var style = resourceDictionary["OriginalOutliningMarginHeaderControlStyle"]; 
	Application.Current.Resources[typeof(OutliningMarginHeaderControl)] = style; 
}

Building and running the project launched the experimental instance of Visual Studio and voila – the plus/minus symbols were back!

Now all that was left to do was to update the vsixmanifest, build the extension in Release mode, and upload it to the Visual Studio Marketplace following this Walkthrough: Publish a Visual Studio extension.

Adding support for color customization

When I started using the preview builds of Visual Studio 2022 17.12, I noticed that the rendering of the plus/minus symbols was broken because the chevron symbol color definition had changed. I decided to introduce a dedicated color definition for the plus/minus symbols to avoid such problems going forward:


[Export(typeof(EditorFormatDefinition))] 
[Name(OutliningExpanderIdentifier)] 
[UserVisible(true)] 
internal sealed class OutliningExpanderFormatDefinition : EditorFormatDefinition 
{ 
	public const string OutliningExpanderIdentifier = "outlining.plusminus"; 
	public OutliningExpanderFormatDefinition() 
	{ 
		this.ForegroundColor = Color.FromRgb(0x55, 0x55, 0x55); 
		this.BackgroundColor = Color.FromRgb(0xE2, 0xE2, 0xE2); 
		this.DisplayName = Strings.OutliningMarginPlusMinus; 
	} 
}

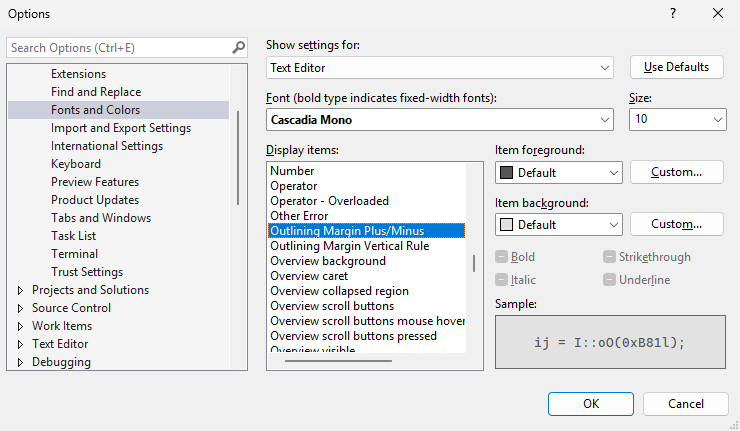
As an added benefit the colors are now consistent with the original plus/minus symbols, and they can be customized in Tools -> Options -> Environment -> Fonts and Colors:

Plus/minus symbol colors in Tools/Options dialog

To make sure that the colors look correct in the dark theme as well, I added a ThemeColors.xml file to the project with the following content:


<Themes> 
	<Theme Name="Dark" GUID="{1ded0138-47ce-435e-84ef-9ec1f439b749}"> 
		<Category Name="BringBackPlusMinus" GUID="{063E9575-C1A8-4729-BB15-AAA2EFB44FC0}"> 
			<Color Name="outlining.plusminus"> 
				<Background Type="CT_RAW" Source="FF000000" /> 
				<Foreground Type="CT_RAW" Source="FFE2E2E2" /> 
			</Color> 
		</Category> 
	</Theme> 
</Themes>

It needs to be converted to a .pkgdef file using the VsixColorCompiler first, which is then included in the extension’s .vsixmanifest.

Conclusion

In summary, with a little bit of detective work we were able to locate the style for the outlining symbols, build a VSIX extension, and override the style with the original style that brings back the original plus/minus outlining buttons.

The source code for the extension is available on GitHub.

The post The making of Bring Back Plus/Minus appeared first on Visual Studio Blog.

Learn how to create a Client-Server Application in under 45 Minutes in the new Season of AI

$
0
0

Season of AI feature image

What if you could create a robust, versatile client-server application in under 45 minutes? With Visual Studio and GitHub Copilot, this is not only possible but also efficient and enjoyable. This Season of AI, we show you how to use developer tools like GitHub Copilot to create apps from scratch. This season of AI occurs from October 1 through December 30, 2024, and the first 150 speakers with confirmed events will receive a special swag gift pack!

You will experience firsthand how to:

– Develop both server-side and client-side code using .NET, Blazor, and Minimal APIs.

– Run and test your application locally with the Azurite storage emulator.

– Deploy your application to Azure using an automated CI/CD pipeline with GitHub actions.

Whether you’re enhancing the number of users of your app, making your app more reliable, or striving to iterate quicker, dive in and leverage the capabilities of Visual Studio and GitHub Copilot to transform your development workflow.

Learn how to use Copilot in Visual Studio

Learn how to use the commands in Visual Studio for Copilot, inline suggestions, and Copilot Chat. Understand the difference between them and use them to quickly create our Blazor frontend and our ASP.NET API Backend, plus create connections for our application to be deployed on Azure using Azure Table storage and WebApp services, lastly adding CI/CD to our project using GitHub Actions.

For this exciting session, we will also guide you through building a simple yet complete Car Database application. This application will retrieve the Car database from Azure Tables and display the data in a user-friendly Web App for everyone to view.

A print of the Car Service to be used for the Application.

Learn how to do this and more in our guide to our Season of AI! There are also more talks ready to be given in the main repository, where you can everything about Copilots and AI. Check them all and organize an event with this content at aka.ms/RegisterSeasonOfAI and enjoy this Season of AI!

The post Learn how to create a Client-Server Application in under 45 Minutes in the new Season of AI appeared first on Visual Studio Blog.

Introducing a new, more conversational way to chat with GitHub Copilot

$
0
0

In the fast-evolving world of software development, intuitive AI-driven interactions are becoming essential to unlocking new levels of productivity. Today, we’re excited to share our latest innovation – a guided chat experience within GitHub Copilot that reshapes how developers interact with AI. This guided chat experience is available in Visual Studio 2022 17.12 Preview 3 and above.

This guided way to chat was created with one clear goal in mind: to make interactions between developers and AI more natural, effective, and aligned with everyday workflows. It is our deep belief that conversational AI is the future of development, and we’re committed to leading that transformation.

Making Copilot Conversations Smarter and Simpler

As we’ve refined GitHub Copilot, one thing has become clear: while users appreciate the potential of AI-driven tools, there’s a learning curve. Developers have shared that crafting the right prompt can sometimes feel like a challenge—understanding how to phrase a question, knowing what context to include, and making the most of Copilot’s capabilities. In some cases, the experience left users feeling like they were getting too much or too little from their interactions.

Customer feedback highlights the challenge:

  • “The chat experience is helpful, but I wish it felt more like an assistant—something that could help guide me and give me only what I need without extra noise.”
  • “I love how Copilot just starts generating, but it sometimes feels like I have to sift through a lot to get to what I actually wanted.”

These insights inspired us to rethink how AI should work for developers. Rather than relying only on intent-based commands or predefined prompts, this chat allows for a more fluid, conversational experience—one that adapts to the user’s context and needs.

How does this work?

Our guided chat experience takes Copilot beyond simple input-output exchanges, turning it into a collaborative assistant. When the context is clear, Copilot provides direct and relevant answers. When it isn’t, Copilot guides you by asking follow-up questions to ensure clarity and precision.

The implications are significant:

  • More Engagement: Developers spend less time figuring out how to phrase their prompts and more time focused on the task at hand.
  • Less Complexity: Copilot’s ability to guide and clarify reduces the need for developers to navigate complex intent systems.
  • Increased Productivity: With less back-and-forth and more focused responses, developers can move faster through their workflows.

In our early trials, we’ve seen encouraging signs that Guided Chat makes a real difference. So we are excited for you all to try it out.

As we continue refining this guided way to chat, user feedback and engagement will be at the center of our improvements, ensuring that it delivers the intelligent and seamless experience developers need.

Thank you for your continuous feedback

We owe much of our progress to our users’ invaluable feedback. Your insights and suggestions have been instrumental in making Visual Studio better with each update. We appreciate your continuous support and look forward to bringing you more innovative features.

The post Introducing a new, more conversational way to chat with GitHub Copilot appeared first on Visual Studio Blog.


Better GitHub Copilot Completions for C#

$
0
0

We’re excited to announce a significant enhancement to GitHub Copilot that elevates your C# coding experience. Introducing the new update: GitHub Copilot code completions now provide more accurate and relevant autocomplete suggestions by incorporating additional C# context.

Previously, GitHub Copilot generated suggestions based on the content of your currently active file and any other open files in your editor. While this approach was helpful, we have discovered that including more relevant context can greatly improve the quality of these suggestions.

With this latest update, GitHub Copilot now automatically considers semantically relevant files for additional context, even if these files are not open in your editor. This enhancement helps reduce hallucinations and ensures that you receive more pertinent and precise code completions.

Before: Semantically relevant files are not considered as context for GitHub Copilot Completions

After: Semantically relevant files are considered as context for GitHub Copilot Completions

To dive deeper into how this new feature works and how it can improve your coding productivity, check out our detailed blog post Improving GitHub Copilot Completions in Visual Studio for C# Developers on the .NET blog.

Stay tuned for more updates and thank you for being a part of our developer community.

The post Better GitHub Copilot Completions for C# appeared first on Visual Studio Blog.

Visual Studio 2022 v17.12 with .NET 9

$
0
0

We are thrilled to announce the General Availability (GA) of Visual Studio 2022 version 17.12. This update focuses on providing fantastic developer experiences for working with .NET 9 projects and new AI productivity features, along with continuous improvements for all developers.

Abstract Visual Studio image

Thanks to your continuous feature requests, we’ve incorporated many of them in this release. There’s something new for every developer. We have added several new tools and enhancements that simplify your workflow and improve productivity. Whether you’re looking for advanced debugging capabilities, more efficient code management, or enhanced security features, this update has it all.

For detailed information on each new feature, check out the release notes. If you’re pressed for time, here are the key highlights.

Productivity

  • Copy from the Error List: Copying an error from the Error List now copies just the description instead of the entire row to the clipboard.
  • Go to line anywhere in Code Search: In Code Search, you can now navigate to a specific line in the current document or other specified document.
  • Dock the Code Search window: You can now freely position the Code Search window with capabilities like docking and auto-hiding.
  • Customize collapsed text indicator: Set custom colors for the collapsed text indicator in the Visual Studio editor.
  • Refresh your Find results: You can now refresh the results to a previous Find to get up-to-date search matches.
  • More space for horizontal scrollbar: You can now control the visibility of the file level indicators in CodeLens.
  • Non-blocking Code Cleanup on save: When Code Cleanup is run on Save, it now operates in a non-blocking manner, for a smoother coding experience.

GitHub Copilot

  • AI smart variable inspection: Optimize your debugging workflow with Integrated AI variable inspection.
  • AI-powered IEnumerable visualizer: AI-powered LINQ Editable Expressions in the IEnumerable visualizer.
  • Fix code with GitHub Copilot: GitHub Copilot assists you in resolving code issues.
  • Better AI completions for C#: GitHub Copilot brings in additional context from relevant source files to improve completions for C#.
  • Debug tests with GitHub Copilot: Get help with debugging failed tests by using Debug Tests with GitHub Copilot.

Debugging & diagnostics

  • Shows method return values when debugging: The debugger now displays inline return values for enhanced debugging efficiency.
  • Export breakpoint groups with ease: Effortless import and export of breakpoint groups.
  • Blazor WebAssembly debugging: An improved debugging experience for Blazor WebAssembly apps targeting .NET 9 or later.
  • Meter Histogram in Profiler Counter Tool: Enhanced performance insights using Meter Histogram in Profiler Counter Tool.
  • Analyze memory use over time: Select and compare multiple memory snapshots using the Diagnostics Tool window.

Git tooling

  • Manage file renaming with Git: Get peace of mind when renaming files with a new notification.
  • Pull requests using drafts and templates: Create pull request drafts and start your descriptions with templates in Visual Studio.
  • Create internal GitHub repos: Visual Studio now supports creating internal repos and includes guidance for each type of repository to give you more confidence when starting a new project.
  • Copy Git link: You can get a GitHub or Azure DevOps link to a specific line of code to make it easy to share with your colleagues.
  • Customize your AI Git commit message: You can add additional instructions to the prompt for generating your Git commit message with GitHub Copilot.
  • Multi-repo for GitHub and Azure DevOps: You can now create pull requests and link work items in multi-repo scenarios.

IDE

  • Preserve font across theme changes: Changing themes will now remember your font and font size preferences.
  • Multi-Project Launch Configuration: Streamline debugging by setting up and saving launch profiles for specific projects within multi-project solutions. Share configurations effortlessly with your team.
  • Copy files between instances: You can now copy files and folders from Solution Explorer in one instance of Visual Studio to another.
  • Multiple GitHub accounts: You can now add multiple GitHub accounts and set an active account to drive GitHub features like GitHub Copilot and Version Control.
  • Certificate Revocation Checks: Visual Studio now alerts you if it detects digital certificate problems during network calls.
  • MotW security warnings: Mark of the web (MotW) security warnings are now integrated into the overall trust functionality.
  • Teams Toolkit new AI templates: The Teams Toolkit onboards new AI Teams app templates.

Cloud

  • Azure App Service publish security updates: Publishing to Azure App Service securely using integrated security updates.
  • Azure WebJobs Linux support: Publishing to Azure WebJobs on Linux is now supported by right-click publish in Visual Studio.
  • Azure Functions Flex Consumption: Publish to Azure Flex Consumption hosting plan, currently in Preview.
  • Connected Services security update: Making your apps and development experienced more secure.

Desktop

  • Enhanced WinUI components search: Enhance WinUI project setup with improved Visual Studio Installer search, simplifying component location for developers.

Web

  • Request variables in HTTP files: HTTP files now support request variables. That is where you can send a request and then use data from the response, or request, in future requests.
  • HTTP files shared environment: In HTTP environment files we have added support to share variables across environments.
  • Vitest support in JavaScript and TypeScript: When using JavaScript and TypeScript projects you can now author test cases with Vitest.
  • Inlay Hints support for more languages: Inlay Hint support has been added to JavaScript, TypeScript, Python and Razor as well as a setting to control its behavior.

Data

  • SDK-style SQL projects in SSDT: You can now use the SDK-style project file format in your SQL Server Data Tools projects.

.NET

  • Achieve more with .NET 9: .NET 9 elevates cloud-native and intelligent app development, focusing on productivity enhancements, streamlined deployments, and accelerated AI integration.
  • NuGet audits transitive packages: NuGet is changing default audit settings to include transitive packages.

C++

  • Set C++ Command Line Arguments: A new way to set your command line arguments right from the toolbar.
  • Build Insights view explanations: Learn how to use each tab of Build Insights via a newly added link to documentation.
  • Build Insights path adjustments: Get a clearer view of your file in Build Insights, see full path on hover.
  • Open Folder for Unreal Engine uproject: A new way of opening your uproject.
  • Change signature improved: You can now effectively change signatures with our improved feature for C++.

SHARE YOUR FEEDBACK AND STAY CONNECTED

As you use Visual Studio, let us know what you love, what you like, and where you’d like us to improve. You can share feedback with us via Developer Community: report any bugs or issues via report a problem and share your suggestions for new features or improvements to existing ones.

Stay connected with the Visual Studio team by following us on YouTube, Twitter, LinkedIn, Twitch and on Microsoft Learn.

As always, we appreciate the time you’ve spent reporting issues and hope you continue to give us feedback on how we’re doing and what we can improve.

The post Visual Studio 2022 v17.12 with .NET 9 appeared first on Visual Studio Blog.

First preview of Visual Studio 2022 v17.13  

$
0
0

We’re excited to announce the availability of Visual Studio 2022 v17.13 Preview 1 – the first preview of our next update to Visual Studio. This update focuses on providing fantastic developer experiences across the board, with a focus on stability & security, and AI & productivity. Download the preview and see the full list of enhancements in the release notes.  

Image VS Preview Release

Quality & security 

Ensuring the highest standards of quality and security is paramount. Visual Studio 2022 v17.13 incorporates robust quality and security enhancements designed to provide a seamless and secure development environment. With improved diagnostics and debugging tools, developers can now identify and resolve issues more efficiently, leading to more reliable and stable applications. Furthermore, enhanced security features offer protection against potential threats, safeguarding your code and data. These improvements not only streamline your workflow but also bolster your confidence in delivering high-quality, secure software solutions. 

AI & productivity 

Visual Studio 2022 v17.13 integrates advanced AI to boost developer productivity by automating routine tasks, offering intelligent code suggestions, and enhancing coding efficiency. With AI-assisted code completion, refactoring tools, and personalized insights, developers can write cleaner, more efficient code and focus on complex, creative aspects of their projects, ultimately accelerating development cycles. This new release also brings general productivity improvements across the IDE, making it a robust tool for developers at every level. 


We hope you enjoy this preview of Visual Studio, and we look forward to hearing what you think. You can share feedback with us via Developer Community, by reporting issues via report a problem and share your suggestions for new features or improvements to existing ones. 

You can download the preview from our website or update it from within the IDE. Please note that you should not use this preview in production environments, and some extensions or workloads may not be compatible with it. 

Thank you for using Visual Studio and happy coding! 

The post First preview of Visual Studio 2022 v17.13   appeared first on Visual Studio Blog.

Fix Code with GitHub Copilot

$
0
0

Looking to resolve code issues quickly? The new GitHub Copilot feature integrated into the lightbulb and error list in Visual Studio 2022 offers a valuable solution for developers. Whether you’re working in C# or C++, this feature will help you understand and address problems in your codebase more efficiently.

The integration of GitHub Copilot into Visual Studio 2022 provides quick fixes and insightful explanations right at your fingertips. Say goodbye to sifting through documentation or conducting endless online searches to debug your code. The lightbulb and error list now offers direct access to GitHub Copilot’s AI capabilities, streamlining your development process.

Quick Fixes at Your Fingertips

To get started, simply invoke the lightbulb and select Fix with Copilot. This launches an inline chat with GitHub Copilot, offering you an available fix. This seamless interaction allows you to address issues at once, keeping your workflow uninterrupted.

Fix code with GitHub Copilot from the lightbulb

Insightful Explanations for Code Issues

Understanding errors in your code can be challenging, but with GitHub Copilot, clarity is just a click away. Select the GitHub Copilot icon from the error list to open the chat panel, where you’ll find detailed explanations and solutions for the error at hand.

Fix code with GitHub Copilot from the error list

Elevate Your Coding Experience

By integrating GitHub Copilot, Visual Studio 2022 enhances your coding experience, making it easier to tackle complex problems and improve code quality. We encourage you to explore this feature and see how GitHub Copilot can transform your coding experience.

We deeply appreciate the continuous feedback from our users, which drives us to improve and innovate. Your input is invaluable in making Visual Studio better with each update. Happy coding!

The post Fix Code with GitHub Copilot appeared first on Visual Studio Blog.

Join Us at Microsoft Ignite: Unlock GitHub Copilot’s New Potential in Visual Studio

$
0
0

Image showing the session details with abstract art

Get ready for an exciting Microsoft Ignite breakout session where we’re unveiling the latest advancements in GitHub Copilot in Visual Studio! Join Dalia Abo Sheasha, Jessie Houghton, and Scott Hanselman as they dive into how GitHub Copilot is evolving to help developers work smarter, collaborate better, and achieve more.

Here’s a little preview of what we’ll be discussing:

Enhanced AI-Powered Coding Experience

We’ll be sharing some powerful new tools that make prompt crafting and code completion smoother than ever. Discover how GitHub Copilot’s conversational abilities are growing to bring even more clarity and productivity to your coding sessions.

Customization and Collaboration

Our team is pushing the boundaries on how GitHub Copilot can be tailored to meet your unique workflow and team needs. Learn about new options for customizing Copilot’s responses, from individual preferences to organization-level customizations that make collaboration easier.

Advanced Search and Navigation

Imagine navigating your codebase faster, with GitHub Copilot offering deeper insights right when you need them. We’ll highlight some exciting features designed to make finding, referencing, and editing code even more seamless.

Intelligent Assistance for Debugging and Review

Ever wish your AI assistant could help you pinpoint issues or suggest improvements? We’re teasing features that aim to do just that — turning GitHub Copilot into a smarter, more interactive debugging and review partner.

The Future of GitHub Copilot

Finally, Scott will wrap up with a look at what’s next for GitHub Copilot, including some steps toward a more integrated, intelligent development experience.

Don’t Miss Out!

📅 Session Details Date: Wednesday, November 20 Time: 1:45 PM – 2:30 PM Pacific Standard Time

👉 Watch the breakout session here to see how GitHub Copilot is transforming from an assistive tool into an essential, dynamic coding companion. We can’t wait to share these updates with you!

The post Join Us at Microsoft Ignite: Unlock GitHub Copilot’s New Potential in Visual Studio appeared first on Visual Studio Blog.

Git tooling updates in Visual Studio 17.12

$
0
0

We are thrilled to announce the latest updates to Git tooling in Visual Studio, designed to enhance your development experience and streamline your workflow. These new features are in direct response to user feedback, ensuring that you have the tools you need to be more productive and efficient. For the full list, check out the release notes.

Pull request drafts and templates

You can now create pull request drafts and start your descriptions with GitHub templates in Visual Studio. These were the two top requests for the create a pull request experience.

Draft PRs

Use the drop-down menu on the Create button to Create as Draft.

Create as Draft preview menu

PR Templates

Your default PR template will be used when creating a new PR for both GitHub and Azure DevOps. Learn more about how to add a PR template to your repository in the GitHub documentation and Azure DevOps documentation.

Create internal GitHub repos

Visual Studio now supports internal repos for your GitHub organizations. We also included guidance for each type of repository to give you more clarity on the visibility of the new project depending on which account you’re using.

Create a new git repo menu

Copy Git link

Whenever you share a few lines of code with a colleague, it can often be useful for them to get extra context from your repository. However, if they’re working on something else it can take too long and disrupt their work to checkout your branch.

Now, you can highlight the code you want to share in your editor, open the context menu with a right click, and under the Git submenu get a shareable link to your code in GitHub or Azure DevOps. This makes it simple and easy to collaborate, and it smooths the flow between the IDE and your remote repos on the web.

Git menu option showcasing copy GitHub permalink

You can also get shareable links directly from commit history. This allows for code not currently checked out or code that exists in previous iterations to be referenced just as effortlessly.

Showing git history and grabbing permalink

Customize AI Git commit message

Now you can add additional instructions to the prompt for generating your Git commit message with GitHub Copilot. This allows you to customize the commit message to better fit your workflow and team’s standards. You can specify the number of lines to generate, the length of the lines, and even provide a sample commit style. Edit the message in the Tools > Options > Copilot > Source Control > Commit message additional instructions: prompt field.

showing prompt field for git commit messages

Git multi-repo support

You can now create pull requests and link work items in multi-repo scenarios. For both GitHub and Azure DevOps, we support your integrations when you use the repository picker to focus on a particular repository in your multi-repo scenarios.

showcasing the filter repo option with 4 repos

Keep sharing your feedback!

We are continuously striving to improve and adapt to your needs, and your feedback is invaluable in this process. Thank you for your continued feedback and support. Your insights help us shape the tools and features that make your development experience more efficient and enjoyable.

The post Git tooling updates in Visual Studio 17.12 appeared first on Visual Studio Blog.

VisualStudio.Extensibility 17.12: CodeLens support is here!

$
0
0

We continue to invest in the VisualStudio.Extensibility SDK to allow users like you to create extensions that run faster and smoother than ever before! VisualStudio.Extensibility helps you build extensions that run outside the main Visual Studio IDE process for improved performance and reliability, and can be installed without the need to restart Visual Studio. Additional benefits include a sleek and intuitive .NET 8-based API and comprehensive, well-maintained documentation to help you develop amazing extensions faster than ever before.

This 17.12 release builds on our previous releases and brings support for CodeLens in the editor. We’ve also addressed feedback from early users and revamped the output window API to make it easier to use.

For the latest up-to-date docs and installation instructions, visit https://aka.ms/VisualStudio.Extensibility. We encourage you to report bugs and suggest features via the issue tracker on our GitHub repo, where you can also find extension samples to help you get started.

What’s new for VisualStudio.Extensibility?

Our 17.12 release of VisualStudio.Extensibility includes the following features:

  • Customized CodeLens experience in the Visual Studio editor by adding your own CodeLens provider (currently released as experimental API)
  • Revamped output window API for better discoverability and ease of use
  • Additional diagnostics information for debugging VisualStudio.Extensibility extensions

As with previous releases, we continuously update our documentation to reflect the latest features in version 17.12. We have also prepared a comprehensive guide that outlines the three different extensibility models for Visual Studio. This guide explains why VisualStudio.Extensibility is the ideal choice for those new to writing extensions.

Provide your own CodeLens experience

CodeLens is an experience in the Visual Studio editor that allows developers like you to stay focused on your work and get contextual information about your code without ever leaving the editor. Using CodeLens, you can quickly find all references of code or see the pass rate of unit tests. With the release of 17.12, extenders can now create a custom CodeLens on supported languages provided by Visual Studio! CodeLens support in VisualStudio.Extensibility goes beyond what the Visual Studio SDK (VSSDK) offers in that it not only allows for custom UI to be displayed for your CodeLens; it also offers a way for users to interact with your custom CodeLens through invokable CodeLens.

Check out this sample to learn how you can create a custom interactive word counter CodeLens using this new API. The sample extension allows you to define what to search for and count its occurrences in a C# method block, all from the context of CodeLens!

A screenshot of a computer Description automatically generated

To get started on creating your own CodeLens provider, please review our documentation here. CodeLens support is currently released as an experimental API. We welcome questions and suggestions on the API as we work to stabilize it. Note that we currently only allow CodeLenses to be added to existing languages supported by Visual Studio. Stay tuned for when we enable CodeLens support for arbitrary files.

Access the output window with ease

During 17.12, we revamped the APIs for writing to Visual Studio’s output window. The original APIs were one of the first APIs we migrated from VSSDK to VisualStudio.Extensibility and had started to show their age. In the time we’ve been working on the new model, we’ve iterated on the principles of API design and refined them. Looking back at the original output window APIs, we realized that they did not meet our standards for simplicity and ease of use. In the revamp, we abstracted away concepts like resource IDs and channels to provide a simpler interface, and we gave users multiple ways to write to the output window, including writing using string, TextWriter, or PipeWriter. Check out the updated docs and sample to see how you can utilize the new and improved APIs!

Given that these original APIs were marked as preview, we changed them in accordance with our preview API guidance. For more information about breaking changes, refer to the Breaking Changes article.

Debug your extensions more easily

With this release, we’ve also updated the diagnostics explorer to better assist you in debugging VisualStudio.Extensibility extensions. We separated the diagnostics pages into 2 groups – extension centric and platform centric. This separation makes it simpler to find information specific to your extension versus information that’s about the underlying Visual Studio platform to get more contextual data.

A screenshot of a computer Description automatically generated

A screenshot of extension specific diagnostics pages

Our documentation goes into detail on what each of these pages provide. You can download the latest version of the diagnostics explorer from the Marketplace here.

We want to hear from you!

Since embarking on this journey to provide a new extensibility model for Visual Studio, our goal has always been to keep our ecosystem partners engaged. Besides regular blog posts like this one to update our customers of the latest additions to VisualStudio.Extensibility, we also have extensive and up-to-date documentation on how to use the APIs, as well as media content that gives a quick overview of VisualStudio.Extensibility. We also have 2 different channels for customers to interact with us to either report issues or suggest new features:

  • GitHub: Our GitHub page is the primary destination for extenders to ask questions or report issues with respect to creating extensions for Visual Studio. While we try our best to answer questions, we can’t always get to them in real time. Our goal is to eventually have the GitHub page be something that the community can help answer each other’s questions. That can only happen if more extenders adopt VisualStudio.Extensibility to build their extensions.
  • Developer Community: We primarily use Developer Community to track feature requests. Occasionally, we’ll get issues created in our GitHub page that are related to a feature not yet implemented in VisualStudio.Extensibility. Our practice is to then turn that issue into a suggestion ticket and use that ticket to track upvotes and post updates. In our most recent releases, we closed 2 of these suggestion tickets with the implementation of settings last release, and the support for code lens this release. We encourage you to review the current list of feature requests for VisualStudio.Extensibility and upvote any most relevant to your scenarios.

Keep those questions and suggestions coming! There are many things we take into consideration when planning our roadmap, but rest assured that customer feedback is something that’s always top of mind for us.

Stay connected with the Visual Studio team by following us on YouTube, Twitter, LinkedIn, Twitch and on Microsoft Learn.

The post VisualStudio.Extensibility 17.12: CodeLens support is here! appeared first on Visual Studio Blog.


Copy files across instances of Visual Studio

$
0
0

Transferring code files between different instances of Visual Studio has often been a tedious task. To simplify this process, Visual Studio 2022 now includes a feature that allows you to easily copy and paste code files and folders between instances using the Solution Explorer. This enhancement aims to streamline workflow and save time.

gif showing how to drag and drop files into a different instance of VS

Until now, moving code files and folders between different Visual Studio instances has been a hassle. Developers often had to manually relocate files, risking errors and inefficiencies in their workflow. With the new copy and paste functionality, this problem is now a thing of the past. Visual Studio 2022 makes it easier to manage your code files, regardless of the project type.

How the Feature Works

The process is straightforward:

  • Select the desired file or folder: Navigate to the Solution Explorer and choose the code file or folder you wish to transfer.
  • Use Ctrl+C or Ctrl+X: Copy or cut the selected file or folder.
  • Switch to another Visual Studio instance: Open the instance where you want to paste the file or folder.
  • Use Ctrl+V: Paste the file or folder. All changes will be accurately reflected in the file system.

Additionally, you can also drag and drop files and folders between instances, providing even more flexibility in how you manage your projects.

Expanded Functionality

Previously, this feature was limited to a few specific project types. However, in response to your feedback, we’ve expanded this functionality to include all major project types in Visual Studio. Whether you are working on a web application, a desktop application, or a complex multi-project solution, you can now benefit from this streamlined capability.

Continuous Improvement

We are committed to making Visual Studio the best development environment available. Your feedback is invaluable to us, and it directly influences the improvements we make. This new feature is a testament to our dedication to listening to our users and enhancing their development experience.

Thank you for your continued support and feedback. Together, we are making Visual Studio better every day.

The post Copy files across instances of Visual Studio appeared first on Visual Studio Blog.

Making you more productive with Visual Studio v17.12

$
0
0

The 12th update to Visual Studio 2022 is packed with lots of exciting new features that users have been asking for! Here are some of the awesome highlights from this release that are some of my personal favorites. For all the details, be sure to check out our release notes.

Copy from the Error List

You see an error in the Error List that you don’t know how to fix. So, you select it and hit Ctrl+C to copy the description for a web search. After you’ve pasted it into the search engine, you realize it copied all column headers and row values instead of just the description. Now you must delete everything except the error description before you can perform the web search. This is cumbersome, but now we have a fix!

Select an error with options to Copy, Copy Row, and search for help on the Web

When you copy an error from the Error List using Ctrl+C, only the description is copied to the clipboard. This makes it easier to search for the error online or share it with others.

You can still copy the entire row by right-clicking the error and selecting Copy Row from the context menu or hitting Ctrl+Shift+C.

If what you wanted to do with the error description was to do a web search, then just hit Ctrl+F1 to search for information about the error online.

Go to line anywhere in code search

Sometimes you know that there’s an issue on a certain line in your code and you want to get to it quickly. Maybe you were told about an error being thrown on line 43 of some file, or you want to get to the bottom of a specific file.

Code search now supports quick navigation to a specific line in your code.

Open Code Search and go to a line in the current document by using colon + line number. For example, :39 will navigate to line 39 in the active file.

inputting :39 and cursor goes to line 39

You can also go to a line in a different document by using file name + colon + line number. For example, Order:43 will navigate to line 43 in Order.cs. If you don’t specify the exact file name, then the search will try to find the best match.

order:43 was entered and it took the curser to file Order line 43

Dock the code search window

If you need Code or Feature Search to stay out of your way, you now have more control over the behavior of the search window.

You can now dock the search window and perform tool window actions with it, like Solution Explorer and others.

Search window is docked below the code

After opening Code Search or Feature Search, click on the box icon at the top right to convert it into a tool window. You may choose to dock it elsewhere, pop it out, auto-hide, etc. You can revert to the dismissible window by closing the tool window and reopening search.

highlighting the convert to tool window option

We’ve also simplified and cleaned up the previewing experience in search. There is now one button, indicated with an eye icon, to toggle the preview on and off.

highlighting the preview icon

The position of the preview panel will also adjust based on the dimensions of the search window.

Search window on the right, size has been adjusted

Refresh the Find results

We heard from a lot of users that it’s frustrating having to reopen the Find window and go through the motions of redoing a search to get updated results. Maybe you just refactored some code and want to confirm everything has been changed as expected, or you pulled some recent changes and need your recent Find operation to reflect those updates.

After completing Find in Files, you will now have the option to Refresh the Find results in the window. You’ll get your updated results without having to redo the search.

highlighting the refresh icon

We’ve also redesigned the former Repeat Find option to distinguish it from Refresh. It is now represented as Modify Find with a pencil icon. This button will still reopen Find in Files with the same search criteria you used for that results window.

highlighting the modify find option

Copy files between instances

We are excited to introduce a highly requested feature in Visual Studio! You can now seamlessly copy and paste code files and folders between different Visual Studio instances using the Solution Explorer. Simply select the desired file or folder, use Ctrl+C or Ctrl+X, switch to another Visual Studio instance, and use Ctrl+V to include those files or folders in your new solution. All changes will be accurately reflected in the file system.

In addition to copying and pasting, you can also drag the files and folders from one instance of Visual Studio to another.

gif dragging an dropping files between instances of VS

Previously, this functionality was available only for a few project types, but we have now expanded it to include all the major project types in Visual Studio.

Multi-project launch configuration

The Multi-Project Launch Configuration feature allows you to set up and save profiles for launching specific projects within a multi-project solution in predefined states for debugging.

Gif showing the multi-launch config experience

This simplifies the process of working with complex solutions, improves debugging efficiency, and enables easy sharing of configurations among team members.

Thank you!

We deeply appreciate your valuable feedback and feature requests, which have been instrumental in shaping these updates. Your insights have a profound impact on our development process, and we are committed to continually enhancing your experience with Visual Studio. We encourage you to keep sharing your thoughts and suggestions, as they are vital in helping us make Visual Studio the best it can be. Thank you for your continued support and collaboration.

Happy Coding!

The post Making you more productive with Visual Studio v17.12 appeared first on Visual Studio Blog.

Top 5 GitHub Copilot Features in Visual Studio from Microsoft Ignite 2024

$
0
0

Ignite banner showing session "Discover GitHub Copilot's Untapped Potential in Visual Studio" by Scott, Dalia, Jessie

At this year’s Microsoft Ignite, it was truly exciting to see Scott, Dalia, and Jessie demo some of the most innovative features of GitHub Copilot that are transforming the developer experience in Visual Studio. From the breakout session, we highlighted five standout features that are pushing productivity to the next level. Whether you’re working on complex edits or crafting custom workflows, these tools showcase how AI can elevate your coding game in ways you never thought possible.

*Note: It will take 24-48 hours after the session for the recording to be uploaded.

1. Copilot Edits: Collaborative Iterations

Copilot Edits showing inline chat edits, and Copilot Edits entry point

It was amazing to see Copilot Edits in action. This new editing surface is designed for seamless multi-file changes, making large-scale updates across your project feel effortless. Imagine needing to redesign your UI or implement logic that spans multiple files—Copilot handles it by generating a change plan tailored to your goals, without the usual headache of tracking dependencies manually.

What makes this feature transformative is how Copilot analyzes your codebase, identifies the necessary edits through multiple files, and iterates on those changes while maintaining the context from your conversation history. And the best part? Visual Studio’s inline code previews let you review, modify, or accept suggestions directly in the IDE, making complex updates feel more like a smooth collaboration than a solo effort. This iterative approach ensures that Copilot evolves alongside your intentions, keeping you in control while streamlining your updates.

2. Vision: Code Smarter with Contextual Understanding

Picture of Copilot Chat with two screenshots in the prompt box (Vision)

This feature blew us away with its ability to process images and screenshots, allowing GitHub Copilot to instantly grasp your intentions, without the hassle of going back and forth, tediously describing UI changes.

For instance, when updating a UI, you can simply paste screenshots of the current and desired states into Copilot. It analyzes the differences, determines the necessary changes, and suggests edits tailored to your goals. Vision bridges the gap between visual inputs and actionable suggestions, empowering developers to handle visually-oriented tasks with ease. It truly makes Copilot feel like a collaborative partner in your workflow.

3. Icebreakers: A Launchpad for Productivity

Icebreakers, 4 clickable prompts in the Copilot Chat window

We all know that getting started can sometimes feel like the hardest part, but Icebreakers make it so much easier. These curated starter prompts, like “Refactor my code” or “Add a new feature,” inspire action and guide your initial steps when facing common coding challenges. Seeing Scott demo how Icebreakers now support more complex, multi-step workflows was incredible. They seamlessly integrate with Copilot Edits, enabling actionable plans for even the most intricate tasks.

Whether you’re navigating an unfamiliar codebase or tackling a large project, Icebreakers reduce cognitive load, giving you a clear starting point and boosting productivity right from the get-go. It was exciting to see how this feature now helps developers take control of complex tasks and move forward with confidence.

4. Function Calling: Bridging Gaps in Logic

A picture that describes how function calling work -- takes a vague prompt and finds references to fill in the gaps

Function Calling, which enhances GitHub Copilot’s ability to provide precise recommendations by automatically determining the relevant context and tools based on your natural language prompts. Copilot seamlessly integrates the necessary context, saving you time and effort.

Function Calling streamlines the process by dynamically accessing open files and project structure, eliminating the need to manually specify paths. This makes debugging and integration faster and more efficient. Watching them demo this feature was a highlight, as they showed how quickly developers can go from idea to implementation with Copilot’s context-aware functionality!

5. Custom Instructions: Your Copilot, Your Way

Picture of copilot-instructions.md file and how it is referenced in a response.

Custom Instructions allow Copilot to adapt to your unique team workflow. No two teams are alike, and seeing Jessie demonstrate how you can fine-tune Copilot’s behavior to align with your team’s coding conventions and communication style was truly amazing!

With Custom Instructions, you can add team-specific practices to your Copilot instructions file, ensuring consistency across your codebase. This feature is a game-changer for teams who want to make their workflow more efficient while ensuring alignment with best practices.

Your New Development Sidekick

The advancements showcased at Ignite reaffirm GitHub Copilot’s role as a transformative tool for developers. From simplifying multi-file edits to embracing team-specific workflows, these features show how AI can be both powerful and adaptable.

Try these features in Visual Studio today and see how GitHub Copilot can help you code smarter, faster, and with more confidence.

Which feature are you most excited to try? Let us know in the comments below!

The post Top 5 GitHub Copilot Features in Visual Studio from Microsoft Ignite 2024 appeared first on Visual Studio Blog.

Copying error messages just got easier

$
0
0

Have you ever been frustrated by the tedious process of copying error descriptions from the Error List? Previously with Visual Studio, copying an error would include all column headers and row values, which isn’t always what you want. If you were planning to search for the error online, it was a hassle to clean up the text after pasting.

Context menu highlights options Copy, Copy Row, and Search the Web for Help

Now when you `Ctrl+C` on a row in the Error List, only the error description is copied to the clipboard. You can still copy the entire row with `Ctrl+Shift+C` and now even directly search the web for the error. This makes it easy to get the information you need, saving precious time and headaches.

Additional options for copying

Visual Studio 2022 now offers multiple copy options in the Error List for quick access to what you need.

After selecting the relevant error, you can choose the option in the context menu or use the following keyboard shortcuts.

Context menu option Keyboard shortcut Description
Copy Ctrl+C Copy only the description
Copy Row Ctrl+Shift+C Copy the entire row, description and all
Search the Web for Help Ctrl+F1 Search online for the error with Bing

You can also Copy and Copy Row with multiple errors at a time, so you can get all the information you need at once.

Conclusion

We are continually improving Visual Studio based on your feedback, striving to make your development experience as smooth and productive as possible. This update to the Error List copying functionality is just one of the many ways we are working to enhance your workflow. Thank you for your continued support and valuable insights.

The post Copying error messages just got easier appeared first on Visual Studio Blog.

Debugger and Diagnostics updates in Visual Studio 17.12

$
0
0

We are thrilled to announce a host of exciting new features in Visual Studio 17.12, designed to enhance your development experience and boost your productivity. Our team has been working diligently to address some of the most popular requests from our developer community, and we are confident that these updates will significantly improve your workflow.

For a full list of updates, check out the release notes.

Display Inline Method Return Values

The Visual Studio debugger now displays inline values for return statements, responding to one of the most requested features from the developer community.

This enhancement allows you to see the exact values being returned by functions directly in the code, eliminating the need for additional code or temporary variables to inspect return values.

Gif showing inline returns connecting with GitHub Copilot chat

With GitHub Copilot, you can take it further by using the Ask Copilot option on hover to analyze return values directly in Visual Studio, allowing you to address issues immediately.

It is supported in both native and managed code.

Export breakpoint groups with ease

Visual Studio Breakpoint Groups now support import and export functionality, enabling you to easily manage and maintain your breakpoint structures across multiple projects or environments.

Gif showing exporting breakpoints into file explorer

This new feature allows you to export your breakpoint groups with their configurations and later import them into different solutions, ensuring a consistent debugging setup without the need to manually recreate breakpoints groups again.

Inspect variable with Copilot

With GitHub Copilot seamlessly integrated into Visual Studio, analyzing values from Locals, Autos, and DataTips becomes a streamlined experience. Similar to method return values, you can instantly access AI-powered insights to identify potential errors, diagnose unexpected outcomes, or uncover anomalies by simply right-clicking on any value.

This feature keeps the focus on debugging by providing actionable suggestions and detailed context directly within the IDE, eliminating the need to switch tools or disrupt workflow.

Image leveraging GitHub Copilot chat to inspect images

IntelliSense in the IEnumerable Visualizer

The IEnumerable Visualizer has been enhanced with IntelliSense, providing real-time code suggestions and autocompletion, which makes writing LINQ expressions faster and more accurate.

Gif showcasing IntelliSense in the IEnumerable Visualizer

This enhancement streamlines the process of building and editing queries by providing intelligent code recommendations, minimizing errors, and accelerating development. Additional improvements are planned for upcoming releases, including AI assistance for writing LINQ queries.

Analyze memory use over time

The Diagnostics Tool window now supports comparing memory snapshots, making it easier to analyze changes in memory usage over time. To use this feature, ensure you have at least two memory snapshots captured in the Memory tab.

You can select snapshots for comparison by holding Ctrl and clicking on the desired rows or by holding Shift and using the up/down arrow keys to select two consecutive snapshots. To unselect a snapshot, simply hold Ctrl and click on the snapshot you want to deselect. Once two snapshots are selected, click the View Diff button located above the snapshot list to view the differences between them.

Image in the Memory Usage tab highlighting the View Diff

Meter histogram in the profiler

We’ve also introduced the Meter Histogram feature in the Diagnostics Window, enhancing your ability to analyze and visualize histogram data generated by histogram instruments. This upgrade allows you to capture and explore data distributions in greater detail, presenting the results through clear and intuitive visualizations during profiling sessions. With this feature, identifying patterns, trends, and insights from histogram-based metrics becomes more efficient, providing a seamless and effective way to optimize and debug your applications.

Image highlighting the meter histogram in the profiler

Thank you!

We are dedicated to continuously improving your development experience, and many of these advancements are driven by your invaluable feedback and suggestions. Your input plays a vital role in shaping the future of Visual Studio, and we encourage you to keep sharing your ideas with us.

Thank you for being an essential part of our developer community and for your ongoing support. Together, we can reach new milestones and make Visual Studio the ultimate development environment.

Happy coding!

The post Debugger and Diagnostics updates in Visual Studio 17.12 appeared first on Visual Studio Blog.

Viewing all 1144 articles
Browse latest View live


<script src="https://jsc.adskeeper.com/r/s/rssing.com.1596347.js" async> </script>