Quantcast
Channel: Visual Studio Blog
Viewing all 1144 articles
Browse latest View live

Updates for C++ developers in Visual Studio 2022 17.12

$
0
0

Visual Studio 17.12 is here and comes with a host of new features for C++ developers. We’ve made improvements across our toolchain, C++ Build Insights, Unreal Engine support, and more. This post gives a quick overview of what’s available; for all the details, see What’s New for C++ Developers in Visual Studio 2022 17.12 on the C++ blog.

Standard Library and MSVC Compiler

As always, you can find all the details about our STL work in the changelog on GitHub. Thanks to everyone who contributed changes for this release!

On the conformance side, we have finished the implementation of C++23’s P2286R8 Formatting Ranges and the multidimensional subscript operator (e.g. my_3d_span[i,j,k]). This release also comes with some new C++26 features:

  • P2997R1 Removing The Common Reference Requirement From The Indirectly Invocable Concepts
  • P0952R2 A New Specification For generate_canonical()
  • P2968R2 Make std::ignore A First-Class Object

You’ll find improvements to several debug visualizers, including those for mutex/recursive_mutex and move_iterator.

We added lifetimebound attributes to min, max, clamp, ranges::min, ranges::max, and ranges::clamp, allowing MSVC code analysis and Clang –Wdangling to detect dangling references in improper usage. See the documentation for warnings C26815 and C26816 for more information about lifetimebound annotations.

Finally, we improved the performance of several types and algorithms. The popcount() function now uses a compiler intrinsic on ARM64. We further improved the vectorized implementations of the minmax_element() and minmax() algorithm families, and optimized the search() and find_end() algorithms. We also overhauled the implementations of condition_variable and condition_variable_any, which has knock-on effects on the timed_mutex and recursive_timed_mutex types.

Set Command Line Arguments for Unreal Engine Projects

For Unreal Engine projects, you can now set the command line arguments to pass to your application directly from the toolbar. This toolbar component will show up by default if you have the Game development with C++ workload installed. If you don’t see it, you can add it by right-clicking on the toolbar and selecting Set Arguments.

Set command line arguments box (-graphicsadapter=0)

We’ll be adding support for this feature to non-UE projects in the future. See Pass command-line arguments while debugging on Microsoft Learn for documentation.

Open Folder for Unreal Engine uproject

We have added an additional entry point to open your Unreal Engine uproject with Visual Studio’s uproject support. You can now open your uproject directly from the File menu by selecting Open > Folder…. This will open your Unreal Engine project in Visual Studio.

For more information on how to use this feature, see the documentation on Microsoft Learn and our announcement blog post.

Change Signature Improvements

We have updated the Change Signature interface, allowing you to add, remove, and rearrange parameters in the parameter configuration section. Additionally, you can change their order by selecting and dragging them to a new position.

The access methods remain the same: press Ctrl+. to trigger the Quick Actions and Refactorings menu and select Change Signature.
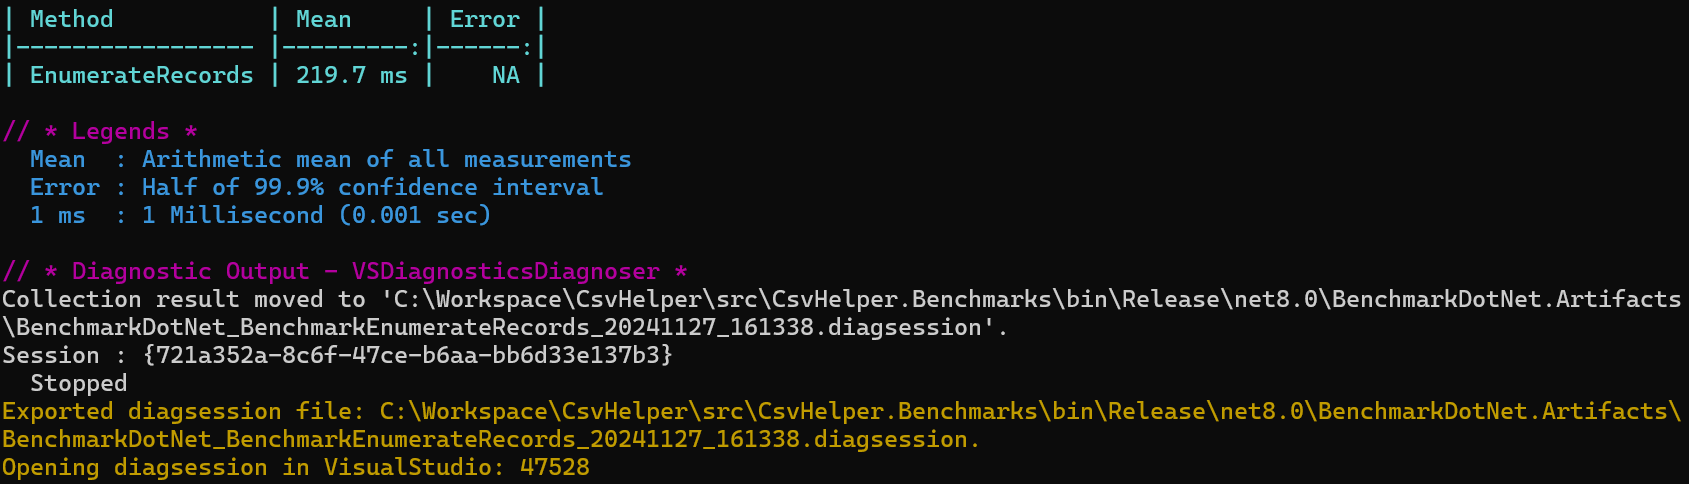
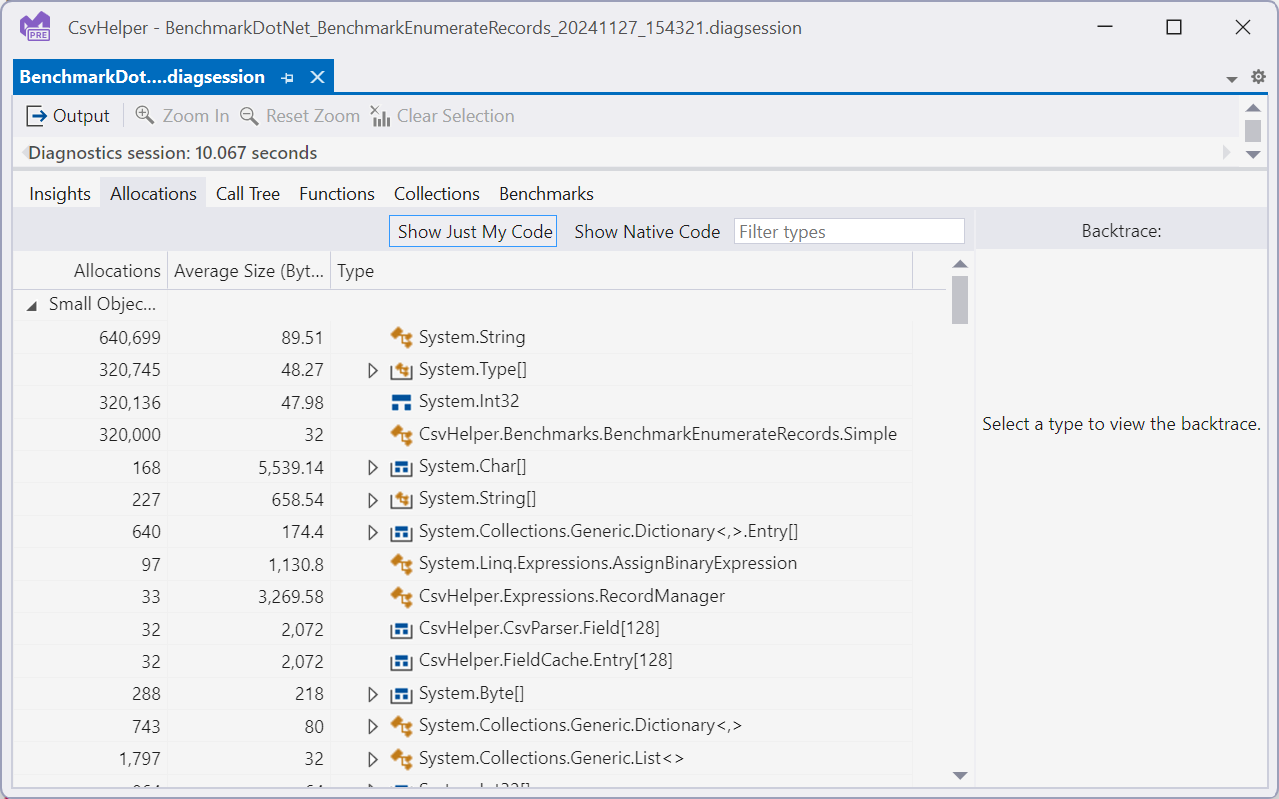
 Image showing and updated method signature (bool LayoutHorizontal(const char * label, int numItems, float itemLabelSize, bool showBorders) and parapmeters

C++ Build Insights

This release of Visual Studio comes with a bunch of quality-of-life improvements for C++ Build Insights.

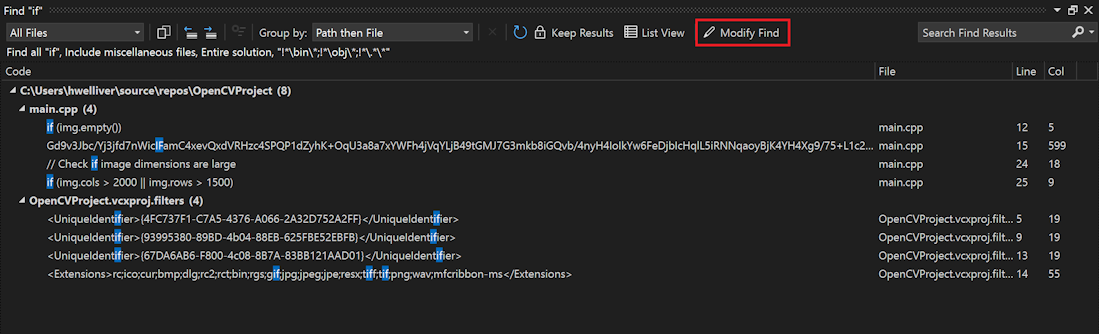
You can now select a few files, run Build Insights on them, and see exactly how these files impact build performance: Run Build Insights on File Selection File Selection Command in contextual menu of selected files.

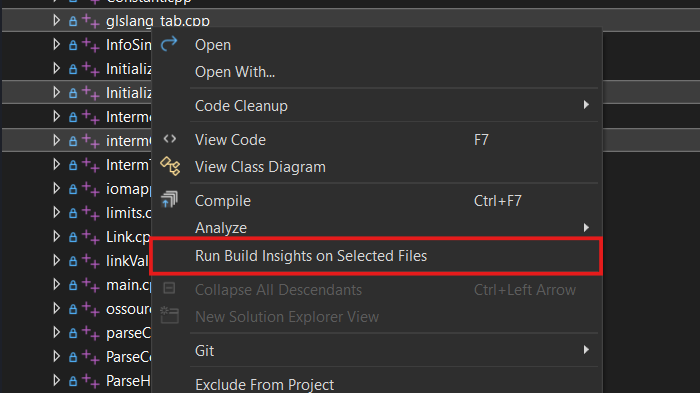
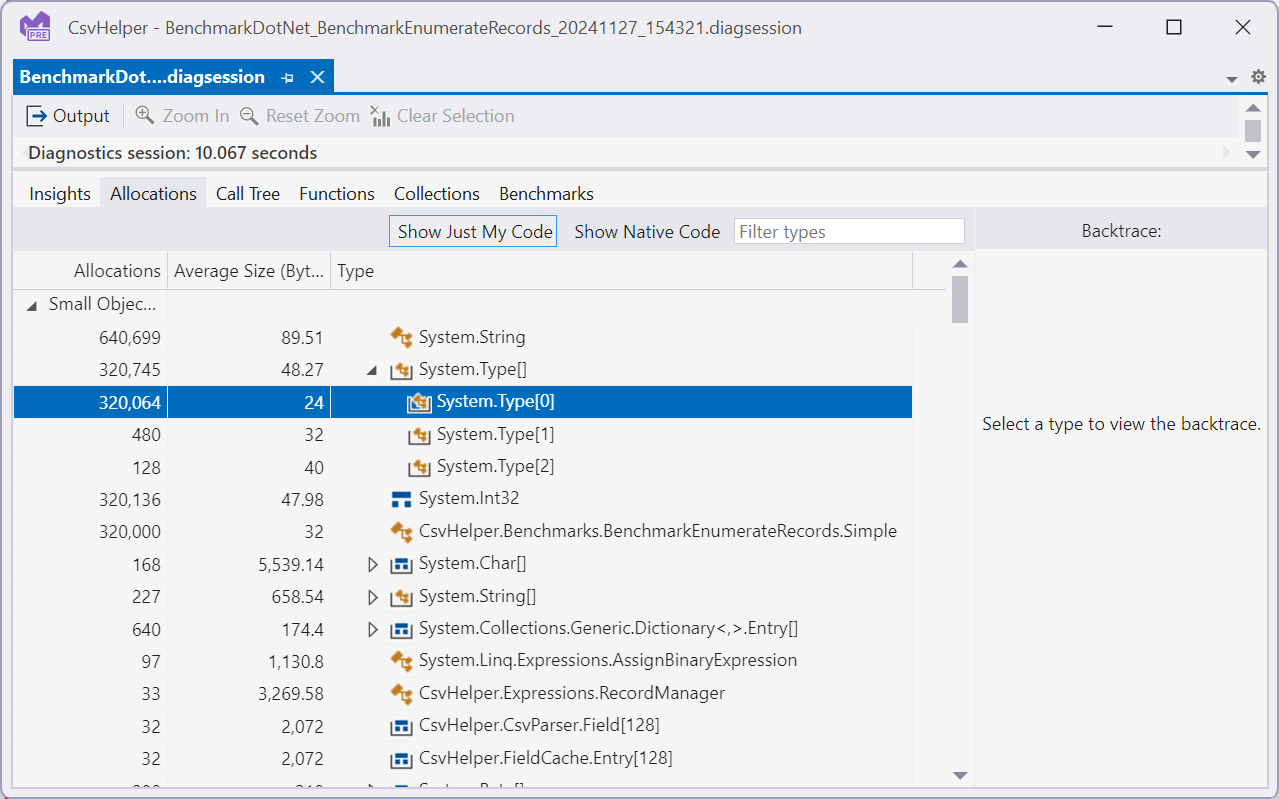
You can filter results by project and file path:

File Path Filter

Note that we now truncate paths to make them easier to read.

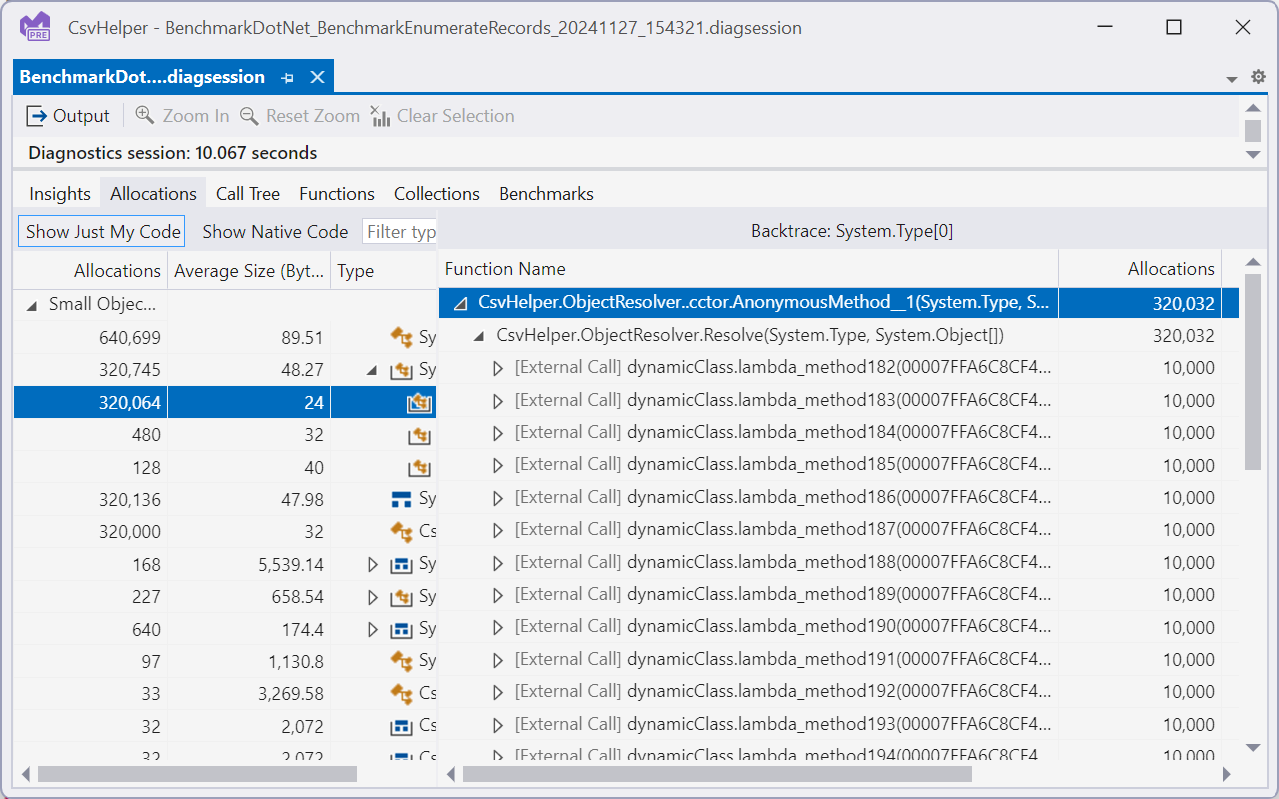
You can designate a folder to automatically store the reports so you can easily access them during your investigation.

Setting to save traces in custom location

Finally, you can now see a short description on how each tab of Build Insights can be used, along with a link to the documentation for a detailed explanation.

Image showing the highlighted ? for Build insights

Summary

We hope this has given you a taste of what’s new. For all the details, see What’s New for C++ Developers in Visual Studio 2022 17.12 on the C++ blog.

We are very much interested in your feedback. The comments below are open. Feedback can also be shared through Visual Studio Developer Community. You can also reach us via email at visualcpp@microsoft.com.

The post Updates for C++ developers in Visual Studio 2022 17.12 appeared first on Visual Studio Blog.


Transform your debugging experience with GitHub Copilot

$
0
0

Are your unit tests failing, and do you want to debug them more effectively? The latest feature in Visual Studio 2022, powered by GitHub Copilot, has the perfect solution for you. Introducing the Debug with Copilot button in Test Explorer, this feature takes the hassle out of debugging failed tests and gets you closer to passing tests in no time.

Screen shot of Visual Studio with the Ask Copilot buttons highlighted on the Test Explorer.

Debugging failing unit tests can often be a tedious and frustrating process. Developers spend significant time identifying the root cause of the failure and figuring out the steps to resolve it. This time-consuming process can delay development timelines and reduce productivity. But fear not, Visual Studio 2022 with GitHub Copilot has an innovative solution to streamline this process.

Introducing Debug with Copilot in Test Explorer

With Debug with Copilot in Test Explorer, your debugging experience is about to become more efficient and user-friendly. When you click on this button, GitHub Copilot steps in to assist you with a comprehensive debug plan. This plan includes setting appropriate breakpoints, watching variables, and launching the debug session.

How it works

Once you initiate the feature, GitHub Copilot provides a detailed debug plan tailored to your specific test. It sets the necessary breakpoints and watches variables that are crucial for determining the next steps. As the debug session progresses and hits a breakpoint, GitHub Copilot analyzes the values of the watched variables and provides guidance on whether to continue debugging or proceed with fixing the problematic code.

Screen shot of GitHub Copilot chat after initiating Debug with Copilot from Test Explorer.

You can engage in a continuous conversation with GitHub Copilot until your test passes, making the entire process more interactive and less time-consuming. This feature not only saves time but also enhances your debugging skills by providing insightful suggestions and guidance.

Screenshot of GitHub Copilot chat after variables returned from debug session showing it knows how to fix the failure.

Appreciation for our users

We are immensely grateful for the continuous feedback from our users, which drives us to make Visual Studio better with each update. Your insights and suggestions are invaluable in helping us deliver features that truly make a difference in your development workflow.

Thank you for being a part of this journey with us. We are excited to see how the Debug with Copilot feature transforms your debugging experience and contributes to your success.

The post Transform your debugging experience with GitHub Copilot appeared first on Visual Studio Blog.

AI-Powered Insights: Streamlining Variable Analysis with GitHub Copilot in Visual Studio

$
0
0

Tired of spending countless hours troubleshooting errors and unexpected values in your code? Visual Studio 2022 introduces GitHub Copilot Variable Analysis. This powerful tool makes inspecting and analyzing variables from Locals, Autos, watch windows and DataTips effortless, helping you solve issues faster and cutting down on time and frustration.

Enhanced Debugging Experience

Debugging can often resemble searching for a needle in a haystack, especially in complex codebases. But GitHub Copilot Variable Analysis can make the debugging experience much easier and smoother. Simply hover over any variable in the Locals, Autos, Watch, or DataTips windows to reveal the Copilot icon. Clicking this icon launches an interactive chat within Visual Studio, delivering detailed, AI-driven insights about the variable’s values and how they affect your code’s execution.

in Autos menu, hovering over root2 variable showing ask copilot as an option

inline, hovering over root2 with ask copilot option

This feature is also accessible via the right-click context menu for added convenience.

How It Works

When you click the Copilot icon next to a variable, GitHub Copilot analyzes its value and delivers comprehensive insights. The debugger supplies necessary references, allowing Copilot to evaluate the code and offer relevant insights for understanding variable behavior or specific values.

When relevant, Copilot also offers code solutions. To incorporate a suggested solution, simply click the preview button in the chat, which will insert the code directly into the editor. If the code aligns with your requirements, you can accept it and continue debugging.

Gif showing the root2 ask copilot option. Copilot generates an explanation and new code, the author accepts this new code

The Benefits of Real-Time Analysis

Variable Analysis is a standout feature of GitHub Copilot, enabling real-time evaluation of variables. When unexpected values arise, you can quickly access detailed information, significantly improving your troubleshooting speed. This seamless integration within the IDE reduces the need for internet searches or context switching, allowing you to concentrate on resolving issues.

Furthermore, GitHub Copilot empowers you to make informed decisions rapidly. Whether addressing errors or understanding variable behavior, you receive instant feedback without disrupting your workflow.

Thank you for your feedback

We believe that the continuous feedback from our users is what makes Visual Studio better with every release. We appreciate your input and are committed to incorporating your suggestions to improve your development experience. Thank you for helping us make Visual Studio the best IDE for developers worldwide.

The post AI-Powered Insights: Streamlining Variable Analysis with GitHub Copilot in Visual Studio appeared first on Visual Studio Blog.

Introducing the Copy Git Permalink Feature in Visual Studio 17.12

$
0
0

We are excited to announce the release of the Copy Git Permalink feature in Visual Studio 17.12. This new functionality streamlines the process of sharing code references, enhancing collaboration and ensuring that critical context is preserved.

Git menu showing the Copy GitHub Permalink option

Effortless Code Sharing

If you’ve found yourself needing to share code snippets with colleagues, you know the challenges of preserving context. With the new Copy Git Permalink feature, you can now generate a permalink directly from Visual Studio to the remote repository. Simply select the desired code, right-click, and choose the “Copy Permalink” option under the Git submenu. Then, your colleague can open the link you shared to get to that line of code on the web, providing them with the surrounding code without disrupting their local environment.

This feature supports both Azure DevOps repositories and GitHub (requires sign-in). If you’d like the ability to extend the support for your own favorite Git hosting provider, please upvote this Visual Studio Extensibility suggestion ticket.

Best Practices for Accuracy

To ensure that your permalink reflects the latest code, remember to commit and push your changes before generating the link. Visual Studio will automatically find the most recent commit on the web if your changes haven’t been pushed recently.

To include line and column numbers in your permalink, make sure the text of interest is selected.

Historical Code Reference

The Copy Git Permalink option is also available within the embedded commit details view in the Git Repository window. This allows you to reference specific code from previous commits without switching branches.

in the Branch explorer showing a real example where you would copy Git Permalink

From Marketplace to Product

This started as a hackathon project of a Visual Studio engineer, Etienne Baudoux, which turned into the popular Copy Git Link extension. The productivity gains experienced by internal Microsoft adopters and the votes received in a related suggestion ticket made it clear that an in-box alternative to this extension would be appreciated.

Conclusion

We encourage you to explore the new Copy Git Permalink feature and share your feedback with us. We are committed to enhancing your development experience and look forward to hear your thoughts.

The post Introducing the Copy Git Permalink Feature in Visual Studio 17.12 appeared first on Visual Studio Blog.

How Inline Return Values Simplify Debugging in Visual Studio 2022

$
0
0

Have you ever found yourself creating temporary variables just to inspect return values from functions? It’s a small task that can quickly become tedious, breaking your rhythm and cluttering up your code. Visual Studio 2022 introduces a smarter way to handle this with “Inline Return Values,” allowing you to stay focused on coding without the extra steps.

Image Screenshot 2024 12 03 130526

This new feature allows you to view return values directly in your code, right where you need them. With Copilot integration, you can go a step further by analyzing the return values in real time. It simplifies understanding and verifying your code’s behavior, cutting out unnecessary steps. Whether you’re working with native or managed code, this feature is designed to enhance your workflow, providing a seamless, intuitive debugging experience tailored to your needs.

How It Works

Previously you might have used the return values shown in the Autos / Locals windows. These values would appear after the function has exited and returned to the caller. Inline return values show this information before the function exits and directly in the editor. And with Copilot integration, you can now receive explanations and solutions without ever leaving your code.

When you hit a breakpoint or step through your code, Visual Studio 2022 automatically displays “the value which will be returned inline, right next to the closing brace of the method. This provides immediate, clear feedback, making it easy to spot issues and verify that your functions are returning the expected results. Gif showcasing inline return values with copilot

To explore the return values further, simply hover over the inline display and click “Ask Copilot” icon on the datatip. A new Copilot chat window will open, and the debugger will gather relevant context and pass it to Copilot for analysis. Copilot will not only explain why you’re seeing those values, but also provide insights into potential issues. If necessary, it can even suggest code fixes to ensure the correct return values, streamlining your debugging process.

You will experience similar Copilot-assisted variable analysis capabilities for Locals, Autos, Watch windows, and DataTips as well , learn more here : AI-Powered Insights: Streamlining Variable Analysis with GitHub Copilot in Visual Studio – Visual Studio Blog

Tell us what you think!

We hope the inline return values feature enhances your debugging experience! As we continue to develop seamless inline data inspection, your feedback is invaluable. Consider completing our quick survey to help us improve this feature.

If you have comments or questions about this or any other Visual Studio features, please use the Report a Problem tool. Stay connected with the Visual Studio team by following us on Twitter @VS_Debugger, Twitter @VisualStudio, YouTube, and LinkedIn.

The post How Inline Return Values Simplify Debugging in Visual Studio 2022 appeared first on Visual Studio Blog.

Introducing Code Referencing for GitHub Copilot Chat in Visual Studio

$
0
0

Are you tired of the uncertainty that comes with using code suggestions from AI tools? We’ve got exciting news for you! Visual Studio 2022 now includes code referencing in GitHub Copilot, ensuring greater transparency and control for developers.

We are thrilled to announce that code referencing is now available in GitHub Copilot Chat within Visual Studio. This new feature introduces a filter that detects when code suggestions match public code on GitHub, providing you with valuable context to make more informed decisions about the code you incorporate into your projects.

Make Informed Decisions with Code Suggestions

In the rare instances where GitHub Copilot suggests code that matches public repositories on GitHub, this feature displays a list of those repositories along with their licenses directly in the editor. This transparency empowers you to:

  • Learn from existing implementations: Gain insights from how others have tackled similar problems.
  • Consider dependencies: Decide whether to use an existing library instead of writing new code.
  • Acknowledge similar work: Give or receive credit for comparable code within the community.

How It Works

When GitHub Copilot suggests code that matches public code, it now lets you know of this match. You can view the matching code, its source file, and any associated licensing information directly within Visual Studio. This allows you to make more informed decisions about whether to use the suggested code.

If a match is found, a notification appears in the editor showing:

  1. The matching code snippet
  2. Repositories where the code appears
  3. The licenses governing each repository

You have the option to block suggestions containing matching code or allow them with full awareness of their context.

In Copilot Chat it will show like this

Highlighting that copilot found similar code in git repos with the option to view

Instead of this:

Original error showing that the response matched public code so it was blcoked

Try It Out Today

We believe this new code referencing feature enhances your development experience by adding an extra layer of transparency and choice. Try it out in Visual Studio 17.12 Preview 3 and above, and let us know your feedback. Your insights help us improve and tailor our tools to better meet your needs.

Configuration Note

Please note that this feature may need to be configured by your administrator. To ensure its enabled for you, check your settings:

  • Copilot – Suggestions matching public code (duplication detection filter): Allowed

GitHub Copilot can provide you with details about matching code when you accept such suggestions. Learn more.

Enabling or Disabling Suggestions Matching Public Code

Note: If you are a member of an organization on GitHub Enterprise Cloud and have been assigned a GitHub Copilot seat through your organization, you may not be able to configure suggestions matching public code in your personal account settings. Your settings will be inherited from your organization or enterprise.

Your personal settings for GitHub Copilot include an option to either allow or block code suggestions that match publicly available code:

  • Block suggestions matching public code: GitHub Copilot checks code suggestions with their surrounding code against public code on GitHub. If there’s a match or near match, the suggestion is not shown.
  • Allow suggestions matching public code: When Copilot suggests matching code, you can view details of the matches and navigate to the relevant repositories on GitHub.

To adjust your settings:

  1. In the upper-right corner of any page on GitHub, click your profile photo, then click Your Copilot.
  2. Next to Suggestions matching public code, use the dropdown menu to select Allow or Block.

For more information, see Managing Copilot policies as an individual subscriber.

Developers often face the challenge of not knowing the origins of code suggestions offered by AI tools. This can lead to concerns about licensing and the appropriateness of using certain code snippets. With the new code referencing feature in GitHub Copilot, those worries are outdated.

Fostering knowledge sharing

By integrating code referencing into GitHub Copilot, we are fostering a culture of knowledge sharing and transparency. This feature not only empowers individual developers but also supports larger teams in navigating the complexities of public code with ease.

The post Introducing Code Referencing for GitHub Copilot Chat in Visual Studio appeared first on Visual Studio Blog.

Keep working with non-blocking Code Cleanup

$
0
0

Are you tired of waiting for Code Cleanup to finish every time you save your work? Visual Studio 2022 will no longer lock up and get in the way of your tasks as it’s cleaning up the code under the covers.

Image async code cleanup on save

Every developer knows the importance of maintaining clean code. However, the traditional Code Cleanup process in Visual Studio could take a while to run and lock up the entire IDE, which made it inappropriate to run on save for all scenarios. These interruptions could break your flow and slow down your development progress.

Now, when you save your work, Code Cleanup can run seamlessly in the background without interrupting your workflow.

Background cleanup for uninterrupted coding

With this enhancement enabled, the cleanup process runs quietly in the background without locking up the IDE. This means no more waiting for the cleanup to be completed before resuming your work, whether that’s opening tools or navigating around to different files in your codebase. Your IDE stays fully responsive, ensuring a smoother and more efficient user experience.

Automatic cancellation for real-time adjustments

Need to make a quick edit, but Code Cleanup started up after you saved? When the editor detects typing, the cleanup process stops. Simply save again to restart cleanup on the updated code. This ensures that you can stay in your workflow and make changes to your code without any worries.

Setting up Code Cleanup on save

To enable Code Cleanup on save, navigate to Tools > Options > Text Editor > Code Cleanup. Turn on the option Run Code Cleanup profile on Save and choose your desired profile.

Second item in Options window shows checkbox for Run Code Cleanup profile on Save

Thank you for your feedback

We continuously strive to enhance your development experience based on your invaluable feedback. These updates to the Code Cleanup feature are a testament to our commitment to making Visual Studio the best it can be. Your insights drive our innovations, and we appreciate your continuous support.

The post Keep working with non-blocking Code Cleanup appeared first on Visual Studio Blog.

Effortless publishing to Azure WebJobs on Linux

$
0
0

Are you tired of the cumbersome process involved in publishing your .NET console applications to Azure WebJobs on Linux? For developers yearning for a seamless and efficient method to deploy their applications, Visual Studio 2022 introduces a much-anticipated solution.

Publish to specific target Linux

Visual Studio 2022 now supports right-click publishing to Azure WebJobs on Linux, making the deployment process faster and more intuitive than ever before. This new feature brings much-needed convenience to developers working with cross-platform .NET 5.0+ Console Apps, allowing them to effortlessly publish their code with just a few clicks.

Why This Matters: The Problem at Hand

Deploying applications to Azure WebJobs on Linux traditionally required several manual steps, often leading to inefficiencies and increased potential for errors. Developers faced a fragmented workflow, which could be time-consuming and prone to mistakes, ultimately impacting project timelines and productivity.

The Solution: Simplified Publishing Process

With the right-click publish feature in Visual Studio 2022, the deployment process has been streamlined significantly. Here’s how it benefits you:

Ease of Use: Simply right-click on your project in Visual Studio and select the option to publish to Azure WebJobs on Linux. The intuitive interface guides you through the process, reducing the complexity and time required for deployment.

Cross-Platform Compatibility: This feature supports .NET 5.0+ Console Apps, ensuring that your applications are compatible across various platforms, enhancing their versatility and reach.

Enhanced Efficiency: By minimizing manual steps and automating the deployment process, developers can focus more on writing code and less on deployment logistics, leading to improved productivity and project efficiency.

Final Thoughts

We are incredibly excited about this new addition to Visual Studio 2022 and believe it will significantly enhance your development experience. Your continuous feedback is invaluable to us and plays a crucial role in making Visual Studio the best it can be. Thank you for your support, and we look forward to hearing how this feature improves your workflow.

The post Effortless publishing to Azure WebJobs on Linux appeared first on Visual Studio Blog.


Effortless publishing with Azure Functions Flex Consumption

$
0
0

Struggling with complex deployment processes for your serverless applications? Visual Studio 2022 introduces a seamless solution with the new Azure Functions Flex Consumption hosting plan, now generally available.

Create new Function App Linux screenshot

Imagine a world where deploying your serverless applications to a hosting plan that supports fast scaling and VNet is as simple as a right-click. With the Azure Functions Flex Consumption hosting plan, this is now a reality. This feature allows you to right-click publish to Flex directly from Visual Studio 2022, streamlining your workflow and saving valuable time.

One of the standout features of the Flex Consumption plan is its Virtual Network integration at no extra cost. This ensures that your apps can communicate securely with other resources in your Azure infrastructure without incurring additional expenses.

Fast and predictable scaling

Flex Consumption offers fast and predictable scaling with instance size choice and per instance concurrency control. This means you can tailor the performance of your applications to meet the specific demands of your users, ensuring a smooth and responsive experience.

Enjoy the benefits of a true serverless environment with scale to zero capabilities. You only pay for instances while they are active, allowing for cost-effective management of your resources. Additionally, the optional Always Ready instances feature mitigates cold starts, providing a more efficient and user-friendly experience.

Try it out today

The Azure Functions Flex Consumption hosting plan is currently in Preview. Learn more about this feature in our announcement blog post and documentation. Try out one of our samples to see how easy it is to integrate this new functionality into your projects.

Your continuous feedback is invaluable, and it helps us make Visual Studio better with every update. We appreciate your support and look forward to hearing your thoughts on this new feature.

The post Effortless publishing with Azure Functions Flex Consumption appeared first on Visual Studio Blog.

Boost your Git confidence with the new file rename notification

$
0
0

Have you ever renamed a file in Solution Explorer and wondered if Git is tracking your changes correctly? You’re not alone. Many developers have found this process confusing and worry whether their changes are being properly staged in Git. But worry no more – there’s a solution!

Messaging showing that files have been renamed and that Git is picking up on these chnages

When you rename files in Solution Explorer, Visual Studio 2022 will now remind you to stage your changes to see the renamed files in Git. This small but mighty notification ensures that Git is recognizing your file change.

Why This Matters

There is often confusion on how Git works when you rename files, especially since there’s a specific git mv command that is used when you want to move or rename a file or directory. But don’t be deceived, Git never stores any information to track renames. Even when you run a git mv operation, it’s just a short cut for doing a git rm, and then git add on the file. That’s because Git only looks at code change additions (git add) and removals (git rm) over time. In some views Git runs rename detection as it’s navigating history and may display a set of an addition and removal as a rename, but under the hood it uses a heuristic based on the similarity of the two files to call it a rename instead – and sometimes it gets it wrong!

This shows up in Visual Studio when you rename a file from Solution Explorer and look at your changed files list. In all cases, it is shown as an addition and a removal. Understandably, this can be disconcerting if you’re expecting Git to detect and track the rename and fear you might be losing history information. However, since Git is not tracking renames at all, you won’t be at risk! Your file changes are still in the Git history and can be retrieved. To gain some additional piece of mind, once you stage your files, Git runs the rename detection, and you can see how it resolves the addition and removal into a rename under the staged section. That’s where this new notification comes in.

Tip: If you want to ensure that Git can always identify your file renames when navigating history, you can keep your file naming changes in a separate commit to file content changes. That way, there’s a perfect match between the file that Git sees as removed and the one that Git sees as added, so it’ll correctly detect the rename. This isn’t required and can be inconvenient if it doesn’t match up to your flow but can be helpful when looking through your history later.

User Feedback Driven Updates

This feature was developed in response to feedback from the Developer Community. We listened to your concerns and collaborated with you to create a solution that makes your workflow more efficient and stress-free. Your input is invaluable, and we are committed to continuously improving Visual Studio based on your feedback.

We want to extend our heartfelt thanks to our users. Your continuous feedback helps us make Visual Studio better with each release. Keep sharing your thoughts and experiences with us!

The post Boost your Git confidence with the new file rename notification appeared first on Visual Studio Blog.

Create internal GitHub repos for your team

$
0
0

Visual Studio 2022 now includes support for creating internal repositories for GitHub organizations. This feature allows developers to work within their GitHub organization’s guidelines within the Visual Studio environment more effectively.

Creating a new git rep with local path

Managing repositories involves configuring varying levels of visibility and permissions. Visual Studio 2022’s new feature aims to smooth this process by providing support for internal repositories, ensuring that developers can be aligned with their organization’s polices when they create new repositories.

How it works

In the Create a Git repository dialog, the visibility of your new repository now includes the new internal option if you’ve selected an account where internal repositories are available. Additionally, Visual Studio now offers detailed guidance for each type of repository. This guidance clarifies the visibility settings of new projects based on the account being used, helping developers ensure the correct setup of their repositories from the outset. If you try to create a repository with the wrong visibility, the action will fail, so that you don’t share your sourcecode with anyone you didn’t mean to.

This functionality reduces the need for leaving Visual Studio to create internal repositories from GitHub – an unfamiliar flow, allowing developers to focus more on coding and less on managing repository settings.

Continuous improvement with your feedback

The feedback from Visual Studio users has been instrumental in developing these features. This continuous input helps enhance the functionality of Visual Studio, making it a more efficient tool for developers. Leave your thoughts on this feature here.

Thank you for your ongoing feedback, which continues to improve Visual Studio with every update.

The post Create internal GitHub repos for your team appeared first on Visual Studio Blog.

Refresh your Find results

$
0
0

Are you tired of having to repeatedly launch the Find window in Visual Studio to update your search results? Whether you’ve just refactored some code or pulled recent changes, having to redo a search to get updated results is no longer necessary. With the new refresh option, you can now update your Find results without the hassle of starting over.

Refresh search results icon highlighted

The Refresh search results button in Visual Studio 2022 will save you time and effort when searching through your code.

Refresh your previous Find

No more friction when updating your earlier Find results! After completing a Find, you can click the clockwise arrow icon to refresh the results instantly. This ensures all changes you’ve made since the last Find are reflected without having to reopen the Find window.

In the toolbar, Refresh search results icon to the right of Group by and Stops a background find

Modify Find to refine search parameters

To avoid confusion, we’ve also relabeled the former Repeat Find to Modify Find, now represented with a pencil icon.

Clicking Modify Find reopens Find in Files with your prior search criteria for that set of results, making it easier to refine your searches and get the results you need.

In the toolbar, Modify Find at the far right

Conclusion

We are thrilled to bring you these improvements in Visual Studio 2022, aimed at making your development process more efficient and less cumbersome. Your continuous feedback helps us make Visual Studio even better, and we appreciate your ongoing support.

Thank you for being a valued user of Visual Studio. We look forward to hearing more about your experiences with the Refresh functionality in Find Results and are always open to your suggestions for further enhancements.

The post Refresh your Find results appeared first on Visual Studio Blog.

GitHub Copilot Free is here in Visual Studio

$
0
0

If you haven’t already heard, GitHub just announced Copilot Free! And great news: you can already start using Copilot Free right now in Visual Studio. It’s available now, and we’re putting the finishing touches on a more streamlined experience in January.

We’re excited to bring these benefits to the entire Visual Studio family. With Copilot Free, you’ll have AI-powered tools right at your fingertips—smarter debugging, AI generated commit messages, AI-breakpoint placement, and of course, direct access to Completions, Chat, and much more. Developers have seen a 25% speed increase with Copilot—and now you can experience that boost firsthand in Visual Studio.

Ready to give it a try?

A couple of recommendations

  1. Try it now: Don’t wait to experience the benefits. Give GitHub Copilot Free a spin in Visual Studio today. Just note that for now, you won’t be notified when you hit your usage limit, but we’ve got you covered with updates coming in January.
  2. Stay Updated: Keep your Visual Studio installation current and subscribe to the preview channels. By staying on the cutting edge, you’ll be among the first to enjoy the latest updates, ensuring you get the most out of Copilot Free as we roll out new features.

Looking ahead to January

Copilot Free will be even easier to use in Visual Studio. You’ll see clear indicators when you hit your usage limits—no more guesswork. And if you find yourself needing more, upgrading to a no-limits plan will be smooth and seamless, so you can keep your ideas flowing.

Keep an eye on the latest previews for these updates, and don’t forget to share your feedback through Developer Community!

The post GitHub Copilot Free is here in Visual Studio appeared first on Visual Studio Blog.

Security updates to Azure publishing from Visual Studio

$
0
0

Visual Studio 2022 introduces a new feature to improve the security of publishing applications to Azure App Service. This feature is designed to disable Basic Authentication and enable integrated security for a more secure publishing process.

Disabling basic Auth

Basic Authentication has been identified as a less secure method for managing app deployments. Visual Studio 2022 addresses this issue by offering you an option to disable Basic Authentication, which enhances security by using integrated authentication.

The problem with Basic Authentication

Basic Authentication involves sending user credentials in a format that is not highly secure, making it vulnerable to interception. This poses a risk to the integrity of applications.

Secure publishing with integrated authentication

The new feature in Visual Studio 2022 disables Basic Authentication and enables integrated security for publishing to Azure App Service. This ensures that publishing credentials is handled securely, reducing the risks associated with Basic Authentication.

When publishing to an Azure App Service that has Basic Authentication enabled (which is not recommended), users will see the Turn on Basic Authentication option, and it will be unchecked by default. Customers who need to retain Basic Authentication can check the box, but given the recommendation is to disable Basic Authentication it’s unchecked by default, so you start secure if this is the first time you’re publishing or, you get secure once you go through the publishing process after you update Visual Studio.

publishing a new app service (basic auth available)

If you’ve created the Web App recently via the portal or this or any future version of Visual Studio, Basic Authentication will be disabled by default. For any Web App that’s already got Basic Authentication disabled, we circumvent inadvertently making the Web App less secure by disabling the checkbox altogether, so you stay secure.

publishing a new app service (basic auth not available)

This feature improves the overall security of the publishing process, ensuring that sensitive credentials are not exposed. It also simplifies the process by defaulting to a more secure option, reducing the need for manual security configurations. If, at any point, you need to re-enable Basic Authentication, this is always possible in the Azure Portal.

Conclusion

We deeply appreciate your invaluable feedback, which plays a crucial role in enhancing Visual Studio. Thank you for being a vital part of our community.

The post Security updates to Azure publishing from Visual Studio appeared first on Visual Studio Blog.

Connect securely to your Azure resources

$
0
0

Visual Studio 2022’s Connected Services features are being updated to help you start secure. In the past, for example with Azure Storage, we’d inject the entire connection string into your configuration. With this update, we’ve removed the secrets from the UX – and from what we save to configuration – altogether. This means your code has fewer secrets in it, so you won’t push those into your source control repository inadvertently.

Connecting to Azure storage old view

Integrated authentication, by default

Prior to this update, Connected Services would inject secret-inclusive connection strings for resources like Azure Storage into your secrets. If you were using secrets.json for local storage, this would result in your secrets being stored in files on disk.

screenshot of code with secret blurred out in it

After this update, your secrets.json will contain no actual secrets, but rather the Azure Storage endpoints for your service instance. Using the latest Azure SDKs, your code connects to your Azure resources using your Visual Studio or Azure CLI login. Locally, your logged-in credential does the magic; in Azure, the app service’s managed identity takes over!

screenshot of the same code after update with no secret in code

Benefits with this update

Enhanced security: Fewer secrets on disk means your development process is automatically more secure, since you mitigate the potential for these secrets to be inadvertently committed to source control.

Simplified development and deployment: Focus on what you do best – coding – while Connected Services handles the tedious parts, more securely than ever.

Automated configuration: During publishing, your app is seamlessly configured with the necessary identity and roles needed to access resources, making the process smoother than ever.

Thank You for Your Feedback

Your invaluable feedback drives our continuous improvement. We’re thrilled to bring you these enhancements and can’t wait to hear about your experiences with the new Connected Services feature. Happy coding!

The post Connect securely to your Azure resources appeared first on Visual Studio Blog.


Go to line anywhere with Code Search for Visual Studio 2022

$
0
0

Finding the exact line of code where an issue is occurring can be like searching for a needle in a haystack. Whether you are debugging an error on line 43 of a file or diving into a specific section of code, you can efficiently jump to the right places with this newest addition to Code Search.

In Code Search, you can now jump to a specific line in the current file or another file, making it faster and easier to move around your codebase.

Navigate to a line in the current document

No need to scroll endlessly to find a specific line. With the updated Code Search, you can swiftly jump to any line in the current document by simply typing colon + line number. For example, typing :39 instantly takes you to line 39 in the active file.

Navigate to a line in the current document :39 items shown

Navigate to a line in a different document

But that’s not all! You can also navigate to a specific line in a certain document by appending the file name with a colon and the line number. For instance, entering Order:43 will direct you to line 43 in the Order.cs file. If you don’t specify the exact file name, the search will try to find the best match for you.

Navigate to a line in a different document Order:43 items

We appreciate your feedback

Your feedback is invaluable to us. It helps us make Visual Studio better with each update. We are excited to see how this new feature will enhance your coding workflow.

From feedback we received during Previews, we’ve already got work lined up to support another format for line navigation. See more at Support Filename(line,column) format in Code Search – Developer Community (visualstudio.com).

We look forward to hearing about your experiences and suggestions.

The post Go to line anywhere with Code Search for Visual Studio 2022 appeared first on Visual Studio Blog.

Dock the Code Search window in Visual Studio 2022

$
0
0

Ever felt frustrated with the search window cluttering your workspace? The latest feature in Visual Studio 2022 gives you more control over the behavior of the Code and Feature Search window, making your search experience smoother and more efficient.

Search docked below the editor.

Some users have shared that the search window feels intrusive, interrupting your work by appearing mid-screen or on the wrong screen and taking up precious screen real estate. You now have the option to turn the search window into a tool window and dock it where you’d like.

Choose how you want your search window

Visual Studio now allows you to dock the search window and perform various tool window actions, like Solution Explorer and other tool windows. The window will continue to pop up by default, but you can now dock, pop out, or auto-hide the search window as a tool window.

After launching Code Search (Ctrl+T or Ctrl+,) or Feature Search (Ctrl+Q), click the box icon with an arrow at the top right of the window. This icon transforms the search window into a versatile tool window, which you can then dock anywhere in your interface and organize your workspace as you like.

Switch to a docking window button next to Hide or Show preview button

If you try it out and decide this feature isn’t for you, you can go back to the popup version of the window by clicking on the box icon with a rectangle.

Switch to a popup window button next to Hide or Show preview button

Streamlined previewing experience

We’ve also simplified the previewing experience within the search window. The interface has been simplified and cleaned up, providing a more user-friendly experience. A single button, marked with an eye icon, allows you to toggle the preview panel on and off.

Hide or Show preview button

Moreover, the preview panel’s position will now automatically adjust based on the dimensions of the search window, ensuring a seamless and adaptable viewing experience.

Preview panel is below results list with search window docked right

We appreciate your feedback

We are deeply grateful for the continuous feedback from our dedicated users, which plays a crucial role in making Visual Studio better with each update. Your input helps us refine and enhance the features that matter most to you.

Thank you for being an integral part of the Visual Studio community. We can’t wait for you to experience the improved search window control in Visual Studio 2022!

The post Dock the Code Search window in Visual Studio 2022 appeared first on Visual Studio Blog.

Unlocking insights with Meter Histogram in the profiler

$
0
0

Are you struggling with performance bottlenecks in your applications? Look no further! Visual Studio 2022 introduces the Meter Histogram feature in its performance profiling suite, providing you with the tools to analyze and visualize histogram data like never before.

Meter Histogram in Visual Studio

The Meter Histogram is a key enhancement to Visual Studio’s performance profiling suite. This feature enables you to capture and analyze histogram data generated by various performance instruments, offering clear insights into the distribution of your application’s data. By visualizing this data, you can easily identify patterns and anomalies that may be causing performance bottlenecks.

Understanding histogram data visualization

When recording data from histogram instruments, the Meter Histogram feature visualizes the histogram results, providing a clear and intuitive representation of data distribution over time. This visualization helps developers quickly find patterns and anomalies that may be affecting application performance.

Additionally, the swim lane graph offers a detailed, segmented view of performance metrics. This feature enhances your ability to pinpoint and address performance issues by breaking down data into easily digestible segments, making it easier to understand the root cause of any bottlenecks.

Image highlighting the swim lane segments

In the fast-paced world of software development, optimizing performance is crucial. The Meter Histogram feature in Visual Studio 2022 empowers developers to gain deeper insights into their applications, leading to more efficient and high-performing software. This tool is a must-have for anyone looking to take their performance profiling to the next level.

Continuous improvement, thanks to you

We value your feedback as it helps us make Visual Studio better. If you have any ideas or issues regarding the Meter Histogram feature or anything else, please use the Report a Problem tool in Visual Studio.

Stay connected with the Visual Studio team through Twitter @VS_Debugger, Twitter @VisualStudio, YouTube, and LinkedIn.

Thank you for choosing Visual Studio!

The post Unlocking insights with Meter Histogram in the profiler appeared first on Visual Studio Blog.

Benchmarking with Visual Studio Profiler

$
0
0

In Visual Studio 17.13 Preview we have released our updated BenchmarkDotNet diagnosers, allowing you to use more of the tools in the performance profiler to analyze benchmarks. With this change it is super quick to dig into CPU usage and allocations of benchmarks making the measure, change, measure cycle quick and efficient.

Benchmarking a real project

So, to show how we can use the tools to make things better let’s go ahead and benchmark a real project. At the time of writing this article, CsvHelper is the 67th most popular package on Nuget.org with over 9 million downloads of the current version. If we can benchmark this and make it better, we can help lots of users.

You can follow along by pulling down my fork of this at: CsvHelper Fork. The notable changes are that I have added are a new console project (CsvHelper.Benchmarks) that we can use to store our benchmarks, adding the BenchmarkDotNet package to do the actual benchmark runs, and a simple EnumerateRecords benchmark that parses a CSV stream into records which is shown below.

public class BenchmarkEnumerateRecords
{
	private const int entryCount = 10000;
	private readonly MemoryStream stream = new();

	public class Simple
	{
		public int Id { get; set; }
		public string Name { get; set; }
	}

	[GlobalSetup]
	public void GlobalSetup()
	{
		using var streamWriter = new StreamWriter(this.stream, null, -1, true);
		using var writer = new CsvWriter(streamWriter, CultureInfo.InvariantCulture, true);
		var random = new Random(42); // Pick a known seed to keep things consistent

		var chars = new char[10];
		string getRandomString()
		{
			for (int i = 0; i < 10; ++i)
				chars[i] = (char)random.Next('a', 'z' + 1);
			return new string(chars);
		}

		writer.WriteHeader(typeof(Simple));
		writer.NextRecord();
		for (int i = 0; i < BenchmarkEnumerateRecords.entryCount; ++i)
		{
			writer.WriteRecord(new Simple()
			{
				Id = random.Next(),
				Name = getRandomString()
			});
			writer.NextRecord();
		}
	}

	[GlobalCleanup]
	public void GlobalCleanup()
	{
		this.stream.Dispose();
	}

	[Benchmark]
	public void EnumerateRecords()
	{
		this.stream.Position = 0;
		using var streamReader = new StreamReader(this.stream, null, true, -1, true);
		using var csv = new CsvReader(streamReader, CultureInfo.InvariantCulture, true);
		foreach (var record in csv.GetRecords<Simple>())
		{
			_ = record;
		}
	}
}

A few things to note here. We have a global setup function that creates a simple CSV stream and holds it in a memory stream for us. We do this inside the [GlobalSetup] of the benchmark run so that it doesn’t skew the results of our benchmark, we only want to benchmark the actual parsing of the CSV file, not creating test data.

Next, we have a global cleanup function that properly disposes our memory stream, which is just good practice in the event more benchmarks get added so we don’t continuously leak memory.

Lastly, our benchmark simply creates a CsvReader from a stream and then reads each record from it. This exercises the parsing functionality of CsvHelper which is what we are going to try and optimize.

Getting insight into the benchmark

From here you can add a BenchmarkDotNet (BDN) Diagnoser to the benchmark class to capture information about the benchmark while it is running. BenchmarkDotNet comes with an included [MemoryDiagnosers] which captures allocation and overall memory usage information. If we add this attribute and run the benchmark you should get something like

Benchmark run results before local changes

From here you can see the normal mean, error, and standard deviation that BDN provides along with output from our diagnoser which shows we have allocated 1.69 MB of memory during the benchmark and its breakdown in the different GC heaps. If we want to dig further, which I do 😊, then we can include the Microsoft.VisualStudio.DiagnosticsHub.BenchmarkDotNetDiagnosers package from Nuget.org, which hooks BenchmarkDotNet into the Visual Studio Profiler so we can see what is happening during the run. After including this package and adding the [DotNetObjectAllocDiagnoser] and [DotNetObjectAllocJobConfiguration] to the benchmark and rerunning we get:

Allocation benchmark

The biggest thing of note is the line at the bottom showing the path to a collected diagsession file which is the Visual Studio profilers file format for its results. With the new updates it automatically opens in VS and now we have all the stuff we need to dig in and maybe reduce some allocations.

Hunting for allocations

Now that we have a diagsession detailing all the allocations from the run, lets see if we can reduce the allocations we are doing and reduce the load on the garbage collector.

Types allocated in benchmark run

Since our benchmark is designed to deserialize 10,000 records from the memory stream we want to look for anything that is a multiple of 10,000 as that is indicating it is allocating for each record. Immediately we see, string, Type[], int32, and Simple. String and Int32 are the properties on our Simple record type so that makes sense, and Simple is the record type we are deserializing so again that makes sense. The Type[] is a bit suspicious and digging in further things just look worse:

Empty array allocations during benchmark run

In this case it looks like we are allocating an empty Type[] for each record we deserialize, each one being 24 bytes adding up to 7.6MB of allocations in this benchmark run. These junk allocations that can’t hold any data wind up accounting for 14% of allocations in the benchmark run. This is crazy, and something we should be able to fix. Double clicking on the type shows us the backtraces, which shows it is coming from some anonymous function:

Empty type array allocation location

Going to source for this (right click context menu-> Go to Source File) we see the following:

ObjectResolver function from CsvHelper NuGet package

To me it isn’t immediately obvious where this allocation is coming from, so the easiest thing to do is just add a breakpoint to the CreateInstance call and then look around in the debugger. Now BDN runs our benchmarks in a separate process to better control the benchmarks, so to debug we can just instantiate our benchmark and call our benchmark method ourself. We can do this by updating main like so:

static async Task Main(string[] args)
{
	//_ = BenchmarkRunner.Run<BenchmarkEnumerateRecords>();

	var benchmarks = new BenchmarkEnumerateRecords();
	benchmarks.GlobalSetup();
	await benchmarks.EnumerateRecords();
	benchmarks.GlobalCleanup();
}

Running in the debugger we hit where our allocation is occurring:

In ObjectResolver code running under the debugger

Again, it isn’t super obvious where this allocation is occurring so let’s step into the call in case this is coming from an inlined frame:

CreateInstance function running under VS debugger

This method has a Type parameter but not Type[]. It is a relatively short function though so maybe it and its caller are getting inlined so let’s step in again.

Image GetFuncDebugger

Unfortunately no Type[] yet, but this method is marked as AggressiveInlining which explains why we didn’t see it in the allocation stack. One last step in and boom, we got our Type[] allocation!

Image GetArgTypesDebugger

Now this is where the ah hah moment is! We are calling GetArgTypes which returns a Type[] based on the object[] that is passed in. We start by allocating an array that is the same size as the object[], but if the object[] is length 0 then we allocate a new 0 length array. In this case we can easily fix this by checking the parameter size and returning early in the case that there are no arguments to get the type from.

[MethodImpl(MethodImplOptions.AggressiveInlining)]
private static Type[] GetArgTypes(object?[] args)
{
	if (args.Length == 0)
	{
		return Array.Empty<Type>();
	}

	var argTypes = new Type[args.Length];
	for (var i = 0; i < args.Length; i++)
	{
		argTypes[i] = args[i]?.GetType() ?? typeof(object);
	}

	return argTypes;
}

After making this change, we can rerun our benchmarks, remember measure/change/measure, and we get the following:

Benchmark run after local changes showing performance improvement

We effectively cut down on the allocated memory by ~14%! While this may not seem like a huge win, this scales with the number of records. For CSV files with lots of records this is a big win, especially in a library that is already very fast and heavily optimized.

Let us know what you think

In summary, we were able to take a real-world project, add a benchmark to it, use the Visual Studio profiler, and make a meaningful contribution in just a single blog post. By creating a benchmarking suite, it is easy to isolate specific code that you want to improve by measure/change/measure and see the impact of your performance optimizations. We’d love to hear what you think!

The post Benchmarking with Visual Studio Profiler appeared first on Visual Studio Blog.

Enhanced Change Signature in C++

$
0
0

Change Signature allows you to modify a function’s parameters, including reordering, adding, removing, or altering them across various locations. Previously, the Change Signature feature in Visual Studio involved multiple clicks and nested pop-up windows. In Visual Studio 2022 version 17.12, we’ve reduced the number of clicks and eliminated these nested steps to streamline the process.

Image of the improved Change Signature UI

Simplified Process with Intuitive Interface

We have updated the user interface for the Change Signature feature based on direct feedback we received from C++ developers to reduce the number of clicks and pop-up windows. It allows you to manage function parameters more efficiently by adding, removing, modifying and rearranging them directly in the parameter list editor. This layout allows you to see all your changes in one place, reducing the likelihood of errors.

This updated interface allows you to select and drag parameters to change their order to the desired position. This not only speeds up the process but also makes it easier to visualize and implement the changes.

Image change signature cut

Previous Change Signature UI:

Image word image 251968 2

Access Change Signature

To access the improved Change Signature feature, you can press Ctrl+. or right-click in the Visual Studio editor and select Quick Actions and Refactorings… to open the Quick Actions and Refactoring menu. From there, select Change Signature to start making your modifications. This feature not only allows you to change the signature but also ensures that any parameter renames are reflected throughout the function. This access ensures you can make changes on-the-fly without disrupting your workflow.

Send us your Feedback

We are committed to continuous improvement based on your feedback. Your insights are invaluable, and we encourage you to keep sharing them with us using the Send Feedback button in Visual Studio, through the Developer Community, or via email at visualcpp@microsoft.com.

Stay connected with the Visual Studio team by following us on Twitter @VisualC, Twitter @VisualStudio, YouTube, and LinkedIn.

The post Enhanced Change Signature in C++ appeared first on Visual Studio Blog.

Viewing all 1144 articles
Browse latest View live


<script src="https://jsc.adskeeper.com/r/s/rssing.com.1596347.js" async> </script>