Quantcast
Channel: Visual Studio Blog
Viewing all 1144 articles
Browse latest View live

Join us at VS Live! 2025 Las Vegas

$
0
0

Join Your Favorite Speakers at VS Live! Las Vegas

With the new year here, many developers are looking for the best ways to stay ahead in a rapidly evolving tech landscape. That’s why Visual Studio Live! Las Vegas, March 10-14, 2025, is a must-attend event!

Stay ahead of the curve with the latest enhancements in .NET, Azure, GitHub, GitHub Copilot, Visual Studio, and more. Visual Studio Live! Las Vegas is your fastest way to catch up on the innovations shaping the tech landscape.

What Makes VS Live! Las Vegas a Must-Attend? 

From hands-on workshops to deep-dive sessions, this event is loaded with practical guidance you can apply immediately in your day-to-day development work. And I’m especially excited about our two powerhouse keynotes—we’ll explore the future of .NET, AI, and secure cloud-native data solutions. 

But that’s just the start. This year’s session lineup covers a huge spectrum, including: 

  • AI Development: See the latest for developers infusing their apps with AI leveraging LLMS, vector databases, and the latest SDKs to enhance developer. Also come see the latest enhancements in GitHub Copilot for AI assisted development. 
  • Mobile & Desktop App Development: Come learn how to build native Windows apps with WinUI 3 and the Windows App SDK, dive deep into native multi-platform development with .NET MAUI, and hybrid development across all platforms with Blazor Hybrid. 
  • .NET & C# Best Practices: Learn the newest .NET/C# features, bust common myths, and sharpen your skills in asynchronous programming, configuration, and more. 
  • SQL, Cosmos, Fabric, and AI: Dive into vector search, SQL integration with AI frameworks, the latest in CosmosDB, and data analysis in Fabric—directly from the team that builds them.  This will include details on the new release of SQL Server 2025 and SQL database in Fabric. 
  • Developer Well-Being & Leadership: Sessions on burnout, imposter syndrome, and team-building for remote developers—because our industry is about people as much as technology. 
  • Hands-On Labs: Roll up your sleeves in multi-day labs exploring Python & AI, .NET Aspire, SQL Server 2025, Blazor, and more—perfect for those who learn by doing. 

Two Keynotes You Won’t Want to Miss

Image vs live lv 2025 speakers

Why I Think You’ll Love This Conference 

  • Hands-On .NET & Azure Insights: There’s no better way to learn than by doing, and VSLive! is packed with demos, labs, and real-world examples. 
  • Expert Speakers & Networking: Rub elbows with Microsoft insiders, MVPs, and fellow Visual Studio developers. I’m always amazed by how many real-world problems get solved in hallway chats. 
  • Vegas Vibes & Big Ideas: After the sessions, explore the excitement of Las Vegas while solidifying the new connections you’ve made. 

Ready to Register? 

  • Exclusive Discounts: If you have a Visual Studio Professional or Enterprise subscription, check my.visualstudio.com for exclusive discounts included with your subscription. 
  • Early Bird Deals: If you’re not a subscriber, save by registering early on the VSLive! Las Vegas event page. But hurry—Early Bird specials are ending soon. 

I’ll be there, and I’d love to meet you to talk about all things Visual Studio, Azure, GitHub, AI, and more. Feel free to reach out with me via LinkedIn if you would like to meet during the conference.  

Let’s make 2025 the year we elevate our skills together. Visual Studio Live! is more than a conference—it’s a community of developers learning, sharing, and growing. I can’t wait to see you there!

See you in Las Vegas!

The post Join us at VS Live! 2025 Las Vegas appeared first on Visual Studio Blog.


Our Favorite NEW Visual Studio Features of 2024

$
0
0

Last year, the Visual Studio team delivered many new developer-focused improvements and AI integrations, many of which came directly from your feedback on Developer Community. In this post, we highlight the team’s favorite features from 2024 that boost productivity, streamline workflows, and enhance your coding experience. Let’s dive in!

Image Hover Preview: See your images instantly! (Mads Kristensen 00:30)

Struggling to visualize referenced images in your code? Visual Studio’s Image Hover Preview solves this by showing a quick preview of any image, complete with dimensions and file size, when you hover over its reference. It’s a small addition with a big impact on productivity.

When you hover an image source it shows a preview in Visual Studio

I love this feature!

Error Copying Improvements: Copy only what you need (Mads Kristensen 00:55)

Historically, copying error messages might have included detailed data that weren’t necessary to you. With this update, you can copy (Ctrl+C) just the error description, making it easier to search for solutions online.

Copy now takes just the description from error messages

Before:

Severity Code Description Project File Line Suppression State

Error (active) CS0103 The name ‘Test’ does not exist in the current context ConsoleApp1 C:\Users\jamont\source\repos\ConsoleApp1\ConsoleApp1\Program.cs 7

After:

The name ‘Test’ does not exist in the current context

Drag/Drop across multiple instances of Visual Studio (Mads Kristensen 1:45)

You can now copy/paste or drag/drop files between Visual Studio instances seamlessly. This feature works across most project types and enhances workflow efficiency.

gif showing how to drag and drop files into a different instance of VS

Rename Suggestions: Smarter names for cleaner code (Dalia Ado Sheasha 2:48)

Tired of unclear variable or method names? The Rename Suggestions feature analyzes your code to offer context-aware naming options. It’s a lifesaver when working on legacy or inherited projects.

I hate naming things; this means I don’t have to!

Copilot for Commits: Automated and personalized messages (Jessie Houghton 4:23)

Commit messages just got easier. GitHub Copilot now generates customized commit messages, ensuring they align with your preferences and cover every change.

Image AI Generated Commit 1

Memory Layout Viewer: Optimize memory usage (Sy Brand 5:25)

Visual Studio now lets you visualize memory layout, identify gaps, and optimize memory usage. This is particularly beneficial for projects requiring efficient memory management.

Color coded visual of memory layouts by bytes

Async Debugging made easy (Andy Sterland 6:23)

Debugging async/await code is notoriously tricky. The new Async Debugger in Visual Studio provides clearer insights into async calls, making it easier to identify issues and debug effectively.

New .NET MAUI templates: Start projects with ease (Rachel Kang 8:08)

With this update to .NET MAUI templates, you can now include sample content to jump-start your project. These templates integrate popular toolkits for a smoother development experience.

Showcasing an example .NET MAUI template

Everything Copilot (Bruno Capuano 9:50)

You can now ask domain specific questions in Copilot Chat. Which, in combination with Copilot Edits, provides targeted code suggestions that you can add in session. If you want to change up the suggestions, you now can choose between different models in Copilot Chat.

New Extension Manager and Extension Hot Loading (Maia Kelner 11:11)

Installing extensions no longer interrupts your flow. With extension hot loading, you can install and use extensions without restarting Visual Studio.

Full-length extension descriptions in the Extension Manager

Check out the new Bright Xaml Extension!

Unreal Engine integration: Game development streamlined (David Li 12:55)

Game developers rejoice! Open Unreal Engine projects directly in Visual Studio, configure targets, and leverage the new Unreal Engine toolbar for efficient workflows.

New Unreal Engine toolbar, options to attach processes, scan blueprints, configure tools, and more

Code Search (Sandy Armstrong 14:13)

Use Ctrl + T to launch search. You can now search for specific scopes (current document, entire solution, etc)

Code search ability to search by entire solution, project, or document

You can dock the feature search window!

.NET Aspire integrations (James Montemagno 15:09)

You can now easily orchestrate your existing .NET applications and services with a single click. Visual Studio will automatically create the .NET Aspire `AppHost` and `ServiceDefault` projects and configure everything for you! From the same context menu in Visual Studio you can easily add .NET Aspire integrations to your project by bringing up a filtered NuGet search. Check it out!

Highlighting .NET Aspire Orchestrator Support

We love your feedback!

These innovations and improvements are a direct result of your input. The Visual Studio team thrives on feedback, and your suggestions continue to make it better. Keep sharing your thoughts and ideas on Developer Community. We’re building the future of development together!

The post Our Favorite NEW Visual Studio Features of 2024 appeared first on Visual Studio Blog.

Announcing a free GitHub Copilot for Visual Studio

$
0
0

We’re excited to announce an all new free plan for GitHub Copilot, available for everyone today in Visual Studio. All you need is a GitHub account. No trial. No subscription. No credit card.

With GitHub Copilot Free, you’ll receive:
  • 2,000 code completions per month
  • 50 chat messages per month
  • Access to the latest AI models with Anthropic Claude 3.5 Sonnet and Open AI’s GPT-4o.

GitHub Copilot’s Features in Visual Studio

GitHub Copilot transforms your Visual Studio experience with powerful features designed to save you time and supercharge your productivity:

Copilot Edits: Multi-File Editing

Copilot Edits helps you quickly make changes to multiple files with just one prompt. Edits combines the conversational flow of chat and an inline review experience to help you write code faster and better.

  • Preview with clarity: Know exactly what’s being modified with a summary of the affected files and the proposed changes.
  • Review with flow: View code diffs inline, directly in your editor. Use the TAB key to accept or the Alt+Del key to reject individual changes or apply/dismiss all at once.
  • Iterate with confidence: Use checkpoints to revisit earlier iterations of a code file or try an alternative approach anytime for novel ideas.

Chat with @workspace and @vs

Copilot Chat is deeply integrated into your workflow. It understands your entire solution and your Visual Studio environment. Just use commands like @workspace or @vs to get context-specific responses. will intuitively take in your related files and knowledge about the traits your solution to always give you the most relevant responses.

Never write a commit message again

Copilot will automatically review staged changes and suggest a commit message for you. You can even customize the prompt to make the generated message sound like you or follow your team’s conventions.

Use Copilot to fix your errors

Resolve code errors effortlessly with GitHub Copilot’s file awareness. Now integrated into the lightbulb and error list, Copilot offers fixes and explanations for C# and C++ issues.

Set your breakpoints automatically

Use Copilot to help you quickly find where to apply breakpoints without manually crafting complex expressions, speed up the debugging process and make it easier to pinpoint and resolve issues in your code.

GitHub Copilot is Everywhere in Visual Studio

Discover the amazing features GitHub Copilot brings to Visual Studio! From boosting productivity to simplifying your coding journey, there’s so much to explore. Check out this video for a deeper dive into all the features and tips to get started.

Want to stay in the loop on the newest and most exciting updates for Visual Studio? Follow us on Twitter and LinkedIn, and keep an eye on our blogs for the latest announcements!

The post Announcing a free GitHub Copilot for Visual Studio appeared first on Visual Studio Blog.

Iterate across multiple files more efficiently with GitHub Copilot Edits (Preview)

$
0
0

GitHub Copilot Edits (Preview) in Visual Studio 2022 combines the conversational flow of chat and an inline review experience to help you iterate across your codebase with more control and efficiency.

💡 Here’s how Copilot Edits helps with iterating across multiple files:
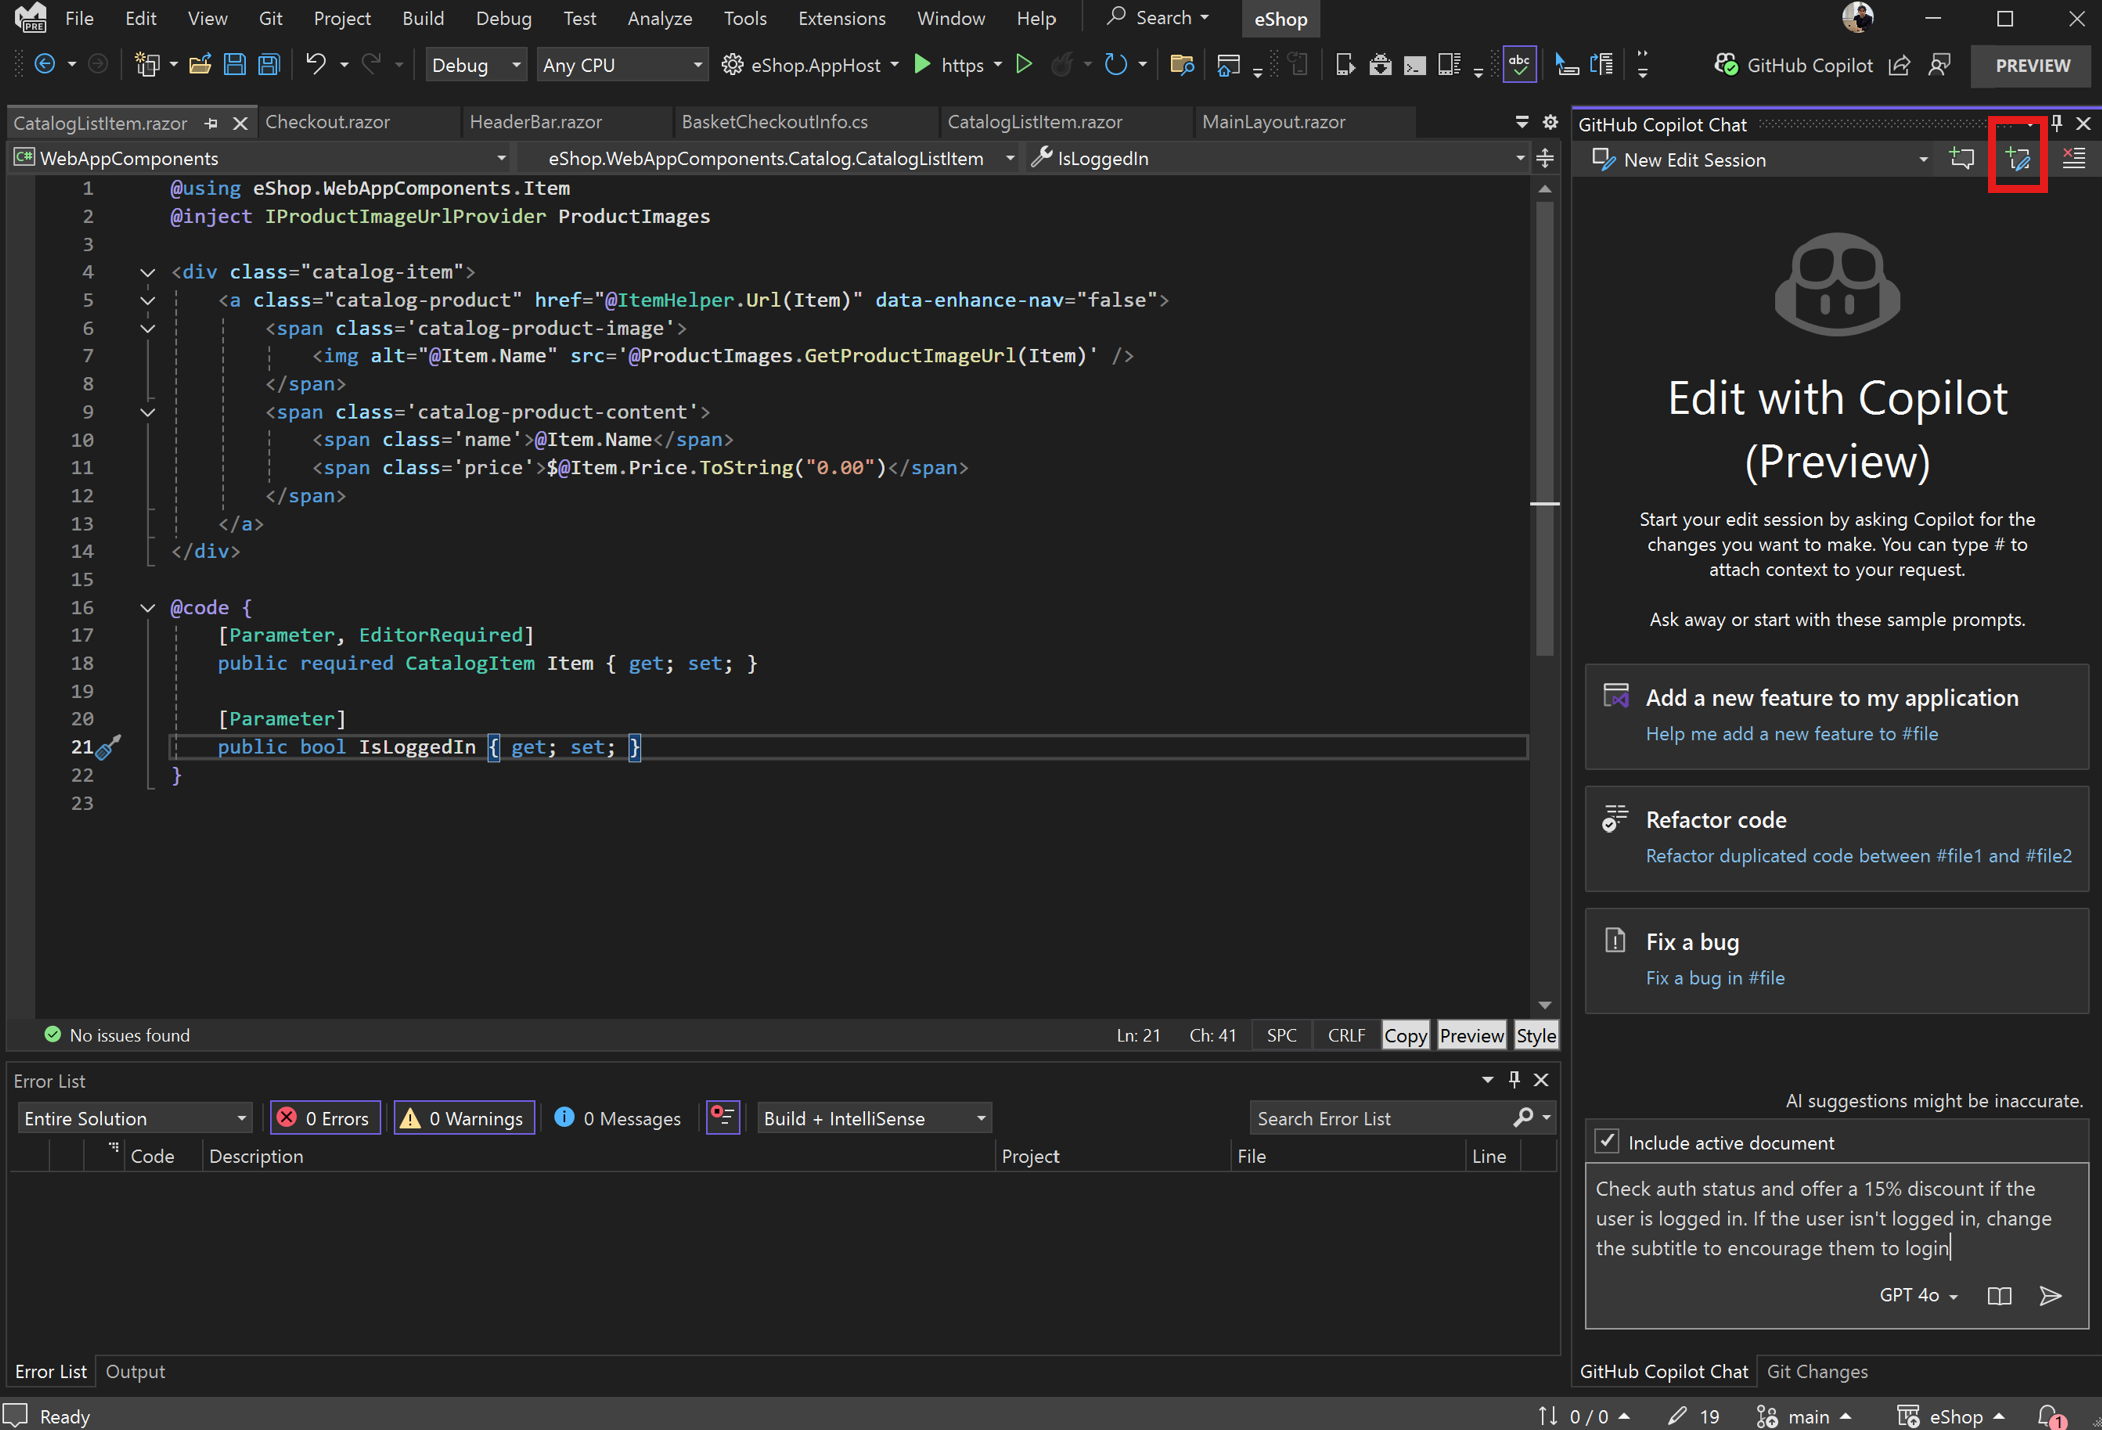
  • Preview with clarity: Review a clear summary that highlights affected files and proposed changes.
  • Review with flow: View code diffs inline, directly in your editor. Either the TAB key to accept and Alt+Del keys to reject individual changes, or apply/dismiss all at once.
  • Iterate with confidence: Use checkpoints to revisit earlier iterations of a code file or try an alternative approach anytime for novel ideas.

Available in Visual Studio 2022 Preview

Get started with GitHub Copilot Edits in Visual Studio

  1. Start an Edits thread: In the Copilot Chat window, click the Edits thread button (a “+” symbol with a pencil icon).
  2. Describe your changes: Use natural language to describe your edits, just as you would in Copilot Chat.
  3. Specify context or let Copilot discover: Copilot Edits will automatically consider your current file, open files, or search for related files across your codebase. You can also specify context using # commands like #errors, #file, #solution.

Image eshop copilotedits gettingstarted

For more details on how to use Copilot Edits, visit our documentation.

We appreciate your feedback

Your feedback is invaluable for helping us improve Copilot Edits – please share with us on the Developer Community ticket for Copilot Edits or the Send Feedback button in Visual Studio.

The post Iterate across multiple files more efficiently with GitHub Copilot Edits (Preview) appeared first on Visual Studio Blog.

Customizing collapsed text Indicators

$
0
0

Visual Studio 2022 introduces new options for customizing the collapsed text indicator, which helps in distinguishing between different sections of collapsed text in the editor. This aims to make the coding environment more intuitive and easier to use by providing additional customization for visual cues.

New collapsed text ellipses

Customizing your coding environment

You can now personalize the color and background of the editor’s collapsed text indicator independently by setting custom colors for both the collapsed and expanded text indicators. This feature can be accessed via the Tools > Options > Environment > Fonts and Colors menu.

Customizing the collapsed text indicator to yellow and red

The two new entries in the Test Editor settings list that control the color of the collapsed text indicator are:

  • Collapsed Text Indicator (Collapsed)
  • Collapsed Text Indicator (Expanded)

In addition to customizing the collapsed and expanded colors separately, both the foreground and background colors for these indicators can be set independently from one another.

Conclusion

This new customization feature in Visual Studio 2022 enhances the coding environment by providing clear visual distinctions between different sections of code, making it easier to navigate and manage.

The post Customizing collapsed text Indicators appeared first on Visual Studio Blog.

Customize your AI-generated git commit messages

$
0
0

When it comes to collaborative software development, clear and effective communication is key. One area that often gets overlooked is the Git commit message. Poorly crafted commit messages can lead to confusion and inefficiencies within a team. That’s why we’ve built on the suggestions and feedback for the AI-generated commit messages, and now you can add custom prompt instructions!

Screenshot showing how you can customize the format of your git commit messages

This new capability enables you to tailor commit messages to fit your workflow and team’s standards seamlessly.

This means you have control over the number of lines, the length of the lines, and even the style of the commit message. By specifying these details, you ensure that each commit message is not only meaningful but also consistent with your team’s guidelines.

To make use of this feature, simply navigate to Tools > Options > Copilot and input your desired parameters. This customization can significantly enhance your workflow by making commit messages more informative and standardized, ultimately leading to better collaboration and less confusion.

We value your feedback

We continuously strive to improve our tools based on your feedback. Your insights are invaluable in making Visual Studio an even better platform for developers around the world. We appreciate your ongoing support and encourage you to keep sharing your thoughts with us. Let us know what you think of this feature in this suggestion ticket.

The post Customize your AI-generated git commit messages appeared first on Visual Studio Blog.

Your fonts are now preserved when changing theme

$
0
0

Do you find yourself adjusting your font settings every time you change themes in Visual Studio, We’ve made some changes that we think will help.

Image of 2 themes where the fonts stay the same and adapt to the updated theme

The latest update in Visual Studio 2022 allows theme switching without affecting font settings. This feature maintains the selected font face and size regardless of the chosen theme, while font colors continue to adapt to the theme.

Seamless integration for a better user experience

This improvement is automatically enabled for all users, facilitating a consistent appearance in your coding environment. If you prefer the prior behavior, you can revert it easily. Just navigate to Tools > Manage Preview Features and locate the option Separate font settings from color theme selection. Unchecking this box will once again tie your font directly to the theme.

Why this feature matters

Font choices can be deeply personal, and we know that preserving the right font settings enhances productivity and allows you to focus more on just coding. This feature supports individual preferences for readability, accessibility, and aesthetics, making the development environment both comfortable and efficient.

Thank you for your feedback

This improvement comes from our invaluable developer feedback community. Your suggestions make Visual Studio better with each update. Keep sharing your thoughts to help us enhance your coding experience.

The post Your fonts are now preserved when changing theme appeared first on Visual Studio Blog.

HTTP File updates for Request Variables and more

$
0
0

Many users have requested adding support for Request Variables in HTTP files in Visual Studio. With Request Variables, you can send an HTTP request and then use data from the response, or request, in any subsequent request that is sent from the HTTP file. We have also added support for a shared environment, $shared, which enables you to share variables across different environments. In this post we will outline the new support which has been added for Request Variables and more. All the features listed in this post are included in Visual Studio 2022 17.12+.

Request Variables

When working with APIs it’s common to get a value from an endpoint and then use that value in a subsequent request. This can be achieved by using Request Variables. We have docs for Request Variables, but we will go over everything here as well. One of the more common scenarios for using Request Variables is when you call into an endpoint to authenticate to the APIs and get a token back which can be used for future requests. The sample request below is for David Fowler’s TodoApi sample. The API has an endpoint where you can create a new user by supplying the username and password. This is the endpoint that we are making a request to.

@username = bloguser
# login and save the response as "login"
# @name login
POST {{TodoApi_HostAddress}}/users/token
Content-Type: application/json
{
  "username": "{{username}}",
  "password": "{{password}}"
}
###

In this case the username is defined in the HTTP file, but the password is stored securely using HTTP Environments. The request below is to the /users/token endpoint, and we pass in the username and password as a part of the body of the HTTP request. The special sauce that makes this a Request Variable, sometimes referred to as Named Request, is the line immediately above the comment.

# @name login

After sending this request in Visual Studio you can then get values from the response, or the request. In snippet below, you can see how we use the login Request Variable to access the token which was returned as a part of the response when it was submitted. The login response body contained a single value, token. Now that we have logged in, we can create a TODO item with the request below.

# Create a TODO item
# @name todo1
POST {{TodoApi_HostAddress}}/todos
Authorization: Bearer {{login.response.body.$.token}}
Content-Type: application/json

{
  "title": "Write blog post"
}
###

In this request we extract the token value and use it to specify the value for the Authorization header. The syntax {{login.response.body.$.token}}. Let’s take a closer look at the syntax.

{{login.response.body.$.token}}

Below is a table summarizing the syntax for using values from Request Variables.

Element Description
requestVarName (login in this case) Request Variable which is being referenced.
response|request Whether the value will be extracted from the response or the request.
body|headers Whether the value will be extracted from the headers or body of the request or response (as specified in response|request).
*|JSONPath|XPath|Header The expression that will be evaluated to extract the result.

For a request returning a JSON body, use a JSONPath expression.

For a request returning an XML body, use XPath.

* will return the entire result.

* cannot be used when extracting from headers.

For the sample request above, we are extracting the token from the response and passing it in as a header for the request to the /todos endpoint. After we send this request, the result that is returned is shown below.

{
  "id": 36,
  "title": "Write blog post",
  "isComplete": false
}

Now that we have created a TODO item, we can update that item with the request below. If you noticed the request above has declared a Request Variable named todo1, so we can refer to values from the response, or request, using that. Let’s update the title to add “ today” at the end of the current title. The request below will update the TODO item. We will use PUT since this is an update to an existing item.

PUT {{TodoApi_HostAddress}}/todos/{{todo1.response.body.$.id}}
Authorization: Bearer {{login.response.body.$.token}}
Content-Type: application/json

{
  "id": {{todo1.response.body.$.id}},
  "title": {{todo1.response.body.$.title}} today,
  "isComplete": {{todo1.response.body.$.isComplete}}
}
###

In this request we use data from the original todo1 request to populate the body of the PUT request. Notice that the title property appends “ today” to the end of the existing title. After sending this request, the result was.

{
  "id": 36,
  "title": "Write blog post today",
  "isComplete": false
}

Here you can see that the title of the blog post was successfully updated. In these examples I have shown working with “flat” JSON results, but you can use any JSONPath expression to extract the data from the response, or request, body. If your endpoints are returning XML, use an XPath expression instead of JSONPath. Let’s move on to discuss the support for $shared.

$shared Environment

When working with HTTP environments you can define multiple different environments for your HTTP requests. For example, you may create a dev environment which refers to your API which is running locally and a test environment when you want to send request to a remote test environment. In these cases you may want to declare a variable which is made available to all environments. This is exactly what the new $shared environment is for. HTTP environments are defined in a file named http-client.env.json, also http-client.env.json.user. If you create an environment named $shared, the variables will be made available in any environment. If a variable is declared in both $shared and standard environments, the value defined in the standard environment will win. Below is an example HTTP environment file containing a $shared environment and two standard environments.

{
  "$shared": {
    "message": "Default msg from Shared",
    "username": "httpfile-user",
    "hosturl": "http://example.com/api/sample"
  },
  "dev": {
    "hosturl": "http://localhost:5000/api/sample"
  },
  "prod": {
    "message": "Message from prod environment"
  }
}

This is a very basic HTTP environment file where we have a dev and prod environment defined in addition to the $shared. In the dev environment the value for hosturl has been customized to point to localhost and the prod environment has customized the message value. To show how this works we will use a third-party open-source website httpbin.org. httpbin.org is a great tool for API developers. We will create an HTTP file that makes request to httpbin.org and have it return the values which were provided. We will use the /headers endpoint so that httpbin will echo the headers that we send to it. Below is the request that we will send.

GET https://httpbin.org/headers
X-Message: {{message}}
X-User: {{username}}
X-Hosturl: {{hosturl}}

###

This request will use the variables defined in the HTTP environment in the request sent to httpbin.org. Reminder that you can select the environment in the dropdown in the top right of HTTP file editor. I’ve set the environment to dev, and the result from httpbin.org is shown below.

{
  "headers": {
    "X-Hosturl": "http://localhost:5000/api/sample",
    "X-Message": "Default msg from Shared",
    "X-User": "httpfile-user"
  }
}

In the response I removed some irrelevant headers. We can see that the values are being populated as expected. The value for hosturl is localhost as specified in the dev environment and the other values come from the $shared. When we switch the environment to prod and send the same request the response is as follows.

{
  "headers": {
    "X-Hosturl": "http://example.com/api/sample",
    "X-Message": "Message from prod environment",
    "X-User": "httpfile-user"
  }
}

The values for both hosturl and message have changed. The value for hosturl and username are coming from the $shared and message is coming from the value provided in the prod environment. If you send a request without an environment selected, values from $shared will be available. Now we have covered the new support for $shared, we will close out the blog post now.

Closing

In this post we have covered two new features for HTTP files, Request Variables and $shared in HTTP environments. With Request Variable support you can now create “chained” requests which take values from previous requests. This should enable you to exercise your APIs more in realistic ways than before. In addition, with $shared you can now share variables across environments making it easier for you to work with HTTP environments. If you are new to HTTP files take a look at the docs for more info.

The updates in this post were inspired by feedback from users like yourself. You can share feedback with us via Developer Community: report any bugs or issues via report a problem and share your suggestions for new features or improvements to existing ones.


The post HTTP File updates for Request Variables and more appeared first on Visual Studio Blog.


VisualStudio.Extensibility: Managing .NET runtime versions

$
0
0

We continue to invest in the VisualStudio.Extensibility SDK to allow developers like you to create extensions that run faster and smoother than ever before! VisualStudio.Extensibility helps you build extensions that run outside the main Visual Studio IDE process for improved performance and reliability, and that can be installed without the need to restart Visual Studio. Additional benefits include a sleek and intuitive .NET 8-based API and comprehensive, well-maintained documentation to help you develop amazing extensions faster than ever before.

In the recent releases of Visual Studio, we’ve focused on documenting features that are polished for GA, so we haven’t blogged often about features available only in the preview channel. However, some features are worthy of early announcement to gather feedback so we can iterate earlier and make the experience better. Today, we’re writing about one such feature – managing the .NET runtime versions, which is available for you to try out in 17.14 Preview 1.

A key benefit of VisualStudio.Extensibility is that extensions can run out of process on .NET 8, giving you access to a modern, more performant runtime. However, .NET has some fundamental differences from .NET Framework (netfx): each version of the runtime can run side by side and each version of the runtime goes out of support faster than netfx. A new version of .NET comes out every year, with odd number releases receiving 18 months of support, and even number releases receiving 36 months (see here for the official .NET support policy). Thus, for extensions running out of process on VisualStudio.Extensibility, we must roll forward our version of .NET every so often, even after Visual Studio 2022 is past active development and goes into servicing. To get more details on Visual Studio’s support policy, please see here.

In 17.14 preview 1, we are introducing the experience that extension developers and consumers can expect when .NET runtime versions roll forward. The following diagram provides a sample timeline of what you can expect for VisualStudio.Extensibility extensions in VS 2022 in the coming years with respect to .NET runtime versions:

Timeline for VS .NET runtimes

Extension consumers should not expect major or intrusive changes to their workflow when .NET runtime versions are rolled forward. Visual Studio will continue to load their VisualStudio.Extensibility extensions, even if these extensions do not specify that they target the latest supported version of .NET. Let’s wind back time and suppose VisualStudio.Extensibility extensions started running on the .NET 6 runtime. With .NET 6 having just reached its end of life, Visual Studio will now load VisualStudio.Extensibility extensions on .NET 8 runtime, even if the extension did not specify that it supports .NET 8. The following screenshot displays the information (icon) displayed when Visual Studio loads an extension that does not specify it supports the installed .NET runtime. When .NET 8 reaches end-of-life, users can expect a similar transition from .NET 8 to .NET 10.

Command sample with pop up saying what this is acceptable on

For extension developers, you will have an opportunity to try loading your extensions in the new runtime version before the current runtime goes out of support. The following screenshot displays the new F5 debug experience when a new .NET runtime version is available.

Dropdown showing options for runtime with new runtime highlighted

For more information on how to configure your extension to run against different runtimes, please see our official documentation on the subject here.

We understand that this model of updating the runtime even when Visual Studio 2022 goes out of active development deviates from how extensions are typically maintained in the in-proc, VSSDK model. For developers familiar with .NET, each version brings about breaking changes, although they are often scoped and announced well in advance. As with most .NET applications, the majority of extensions do not need to be rewritten or updated to target the latest .NET runtime version. If you as extension developers do not want to take on the additional burden of considering .NET runtime version compatibility, you can also choose to run their VisualStudio.Extensibility extension in the main devenv.exe process against the .NET Framework runtime. However, in doing so you would lose the ability to install your extensions without restarting Visual Studio, since the extensions are no longer run in isolation.

This is a big shift, so we anticipate a lot of questions around this. We urge you to use our GitHub repo to file issues or sound off your concerns in this Developer Community feedback ticket if you have questions or concerns regarding this change.

We want to hear from you!

The time and effort you’ve spent reporting issues and sharing suggestions so far has been instrumental in shaping VisualStudio.Extensibility. We need your help as we continue to develop VisualStudio.Extensibility! Please try out the features and APIs announced and let us know what you think. Check out the docs, browse the code samples, and build your first extension. You can send feedback and report issues through our issue tracker.

To request features, look at Developer Community to see if someone else made a similar request first. Create a new one if you can’t find a similar request. By checking for similar requests and upvoting and commenting on them, you help us better prioritize requests. Give VisualStudio.Extensibility a try today and share your thoughts with us!

We appreciate the time you’ve spent reporting issues/suggestions and hope you continue to give us feedback when using Visual Studio on what you like and what we can improve. Your feedback is critical to help us make Visual Studio the best tool it can be! You can share feedback with us via Developer Community: report any bugs or issues via report a problem and share your suggestions for new features or improvements to existing ones.

Stay connected with the Visual Studio team by following us on YouTube, Twitter, LinkedIn, Twitch and on Microsoft Learn.

The post VisualStudio.Extensibility: Managing .NET runtime versions appeared first on Visual Studio Blog.

Visual Studio 2022 v17.13 is Now Available!

$
0
0

We are excited to announce the availability of Visual Studio 2022 v17.13. This update focuses on stability and security, along with continuous improvements for all developers using Visual Studio.

Abstract Visual Studio image

Based on your feature requests, several new tools and enhancements have been added to this release. This update includes improvements for developers, such as advanced debugging capabilities, efficient code management, and enhanced security features. These additions aim to simplify workflows and boost productivity.

For detailed information on each new feature, check out the release notes. If you’re pressed for time, here are the key highlights.

Productivity

  • Customize file encoding: Specify the default encoding for saving files in Visual Studio.
  • Reimagine the horizontal scrollbar: The horizontal scrollbar in the editor now repositions itself to always be accessible, even when space is limited.
  • Choose whether to indent word wrap: You can now specify whether lines that wrap in the editor should be indented.
  • Navigate to recent files in Code Search: In Code Search, you can now easily jump between your recent files.
  • Enhanced line & column navigation: Visual Studio now supports advanced line and column navigation in Code Search.

GitHub Copilot

  • Meet GitHub Copilot Free: GitHub Copilot Free is now available, gives you 2,000 code completions and 50 chat requests per month at no cost—all seamlessly integrated into Visual Studio.
  • AI-enhanced Feature Search: You can now ask GitHub Copilot to get detailed responses for your queries.
  • Use GitHub Copilot Edits across files: Iterate across multiple files more efficiently.
  • GitHub Copilot shortcuts: New keyboard shortcuts for threads in GitHub Copilot Chat.
  • Slash command expansions: Enhance slash commands by expanding into natural language.

Debugging & diagnostics

  • Highlight syntax with IEnumerable Visualizer: Enhanced editable expression with syntax highlighting is now available.
  • Craft complex LINQ queries: Enhanced editable expression with GitHub Copilot Inline Chat directly in the IEnumerable Visualizer.
  • Streamline debugging for native code: The Visual Studio profiler’s instrumentation tool now supports targeted instrumentation for native code.
  • Thread summaries in Parallel Stacks: Enhance the debugging process with AI thread summaries in Parallel Stacks.
  • Display unified async stacks in profiler: The Visual Studio profiler unifies async stacks for streamlined .NET profiling.
  • Use color-coded swim lanes for CPU profiling: The Visual Studio profiler enables multiprocess CPU analysis with color-coded graphs and filtering.

Git tooling

  • Add comments on pull requests: Review pull requests in Visual Studio by adding new comments to the files on the checked-out branch.
  • Catch issues at commit time: Get GitHub Copilot-powered suggestions for your code changes to help you catch potential issues early and improve your code quality.
  • View and manage Git tags: Navigate and push Git tags seamlessly from Visual Studio.

IDE

  • Preserve font preferences across themes: Changing themes will now preserve your font and font size preferences.
  • Onboard a GitHub account: Add GitHub accounts from the first launch wizard or the Visual Studio shell.
  • Manage multiple GitHub accounts: Add multiple GitHub accounts and set an active account to drive GitHub features like GitHub Copilot and version control.
  • Add a new markdown file: Adding a new markdown file just got easier with the new template available in the Add New Item dialog.
  • Check out the new features in the Teams Toolkit: Learn about the Teams Toolkit improvements in the new release.

Cloud

  • Leverage .NET Aspire and Azure Functions: Azure Functions can now use .NET Aspire to integrate serverless technology into .NET Aspire.
  • Launch a new Docker configuration: Enable depends_on support with the DependencyAwareStart launch configuration option.
  • Add scale to Docker Compose: The scale property in Docker Compose is now supported.

Web

  • Extract HTML to Razor component: Use a code action to easily extract HTML to a Razor component in Visual Studio.
  • Disable format on paste for Razor files: You can now disable the format on paste feature for Razor in Visual Studio.

Data

  • Use SDK-style SQL projects in SSDT: You can now use the SDK-style project file format in your SQL Server Data Tools projects with enhanced SQL debugging and schema comparison capabilities.

Stay in touch

As you use Visual Studio, let us know what you love, what you like, and where you’d like us to improve. You can share feedback with us via Developer Community: report any bugs or issues via report a problem and share your suggestions for new features or improvements to existing ones.

Stay connected with the Visual Studio team by following us on YouTube, Twitter, LinkedIn, Twitch and on Microsoft Learn.

As always, we appreciate the time you’ve spent reporting issues and hope you continue to give us feedback on how we’re doing and what we can improve.

The post Visual Studio 2022 v17.13 is Now Available! appeared first on Visual Studio Blog.

First preview of Visual Studio 2022 v17.14

$
0
0

We are pleased to announce the release of Visual Studio 2022 v17.14 Preview 1, marking the initial preview of our next update to Visual Studio. This update prioritizes delivering exceptional developer experiences, with an emphasis on stability and security, as well as AI enhancements. Download the preview and see the full list of enhancements in the release notes.

abstract image of Visual Studio

Stability & security

In this release, we’re focusing on bug fixes that help make Visual Studio more stable and secure. This is something we do from time to time. Our goal is to ensure that developers can work in a reliable and secure environment without disruptions. By addressing critical issues and enhancing overall performance, we aim to provide a seamless development experience. Our commitment to stability and security means rigorous testing and quality assurance processes are in place, ensuring that every aspect of the IDE functions optimally.

AI improvements

Visual Studio 2022 v17.14 includes AI features that aim to improve developer productivity by automating routine tasks, providing code suggestions, and enhancing coding efficiency. The platform offers AI-assisted code completion, refactoring tools, and personalized insights, allowing developers to write more efficient code and focus on complex aspects of their projects, potentially speeding up development cycles.

We hope you enjoy this preview of Visual Studio, and we look forward to hearing what you think. You can share feedback with us via Developer Community, by reporting issues via report a problem and share your suggestions for new features or improvements to existing ones.

You can download the preview from our website or update it from within the IDE. Please note that you should not use this preview in production environments, and some extensions or workloads may not be compatible with it.

Thank you for using Visual Studio and happy coding!

The post First preview of Visual Studio 2022 v17.14 appeared first on Visual Studio Blog.

New restrictions on package loading

$
0
0

As Visual Studio transitions its core packages and services to an async loading/retrieval model, we’ve identified bugs in both the initial async implementation and the existing synchronous package loading mechanism.

While most of these bug fixes have been transparent to extenders, one requires attention due to changed constraints. This post highlights that change. Note that this is only applicable to VSSDK based extensions and does not apply to VisualStudio.Extensiblity. For more information on the differences between extensibility models in Visual Studio, please refer to this documentation: Choose the right Visual Studio extensibility model for you – Visual Studio (Windows) | Microsoft Learn

Summary

The change prevents cyclical package load requests to avoid a race condition where service requests, which should never return null, may occasionally do so. Cyclical package loads were never recommended, and any previous success was due to design decisions made over 25 years ago when Visual Studio was primarily single-threaded, and package loads had to occur on the UI thread.

If you trigger a cyclical package load request it will fail with an HRESULT of 0x80049283 (VS_E_CYCLICPACKAGELOAD). For managed callers this would surface as a COMException with that HRESULT, for native callers the HRESULT would be returned directly.

The change occurred in 17.12 Preview 2 (version 17.12.35309.182) and is present in all subsequent previews and releases.

Background Context

Service Discovery 101

In Visual Studio, a service is tied to a package. When the service is requested, the package loads (if not already loaded) and registers a service factory (IServiceProvider) to retrieve the service instance.

Typically, service factories are registered in the package’s Initialize(Async) method (or SetSite for native packages).

The service retrieval path in Visual Studio works as follows:

  1. Caller A asks for Service B
  2. The service manager checks if a service factory for Service B is already registered. If so, it invokes the factory and returns the result.
  3. If no factory is registered, it checks if the package providing the service factory is loaded. If loaded, the request fails, as the service cannot be acquired.
  4. If the package is not loaded, it loads the package, expecting it to register the service factory, and checks again for registration.
  5. If no factory is registered, the request fails.
  6. If a factory is registered, it is invoked to retrieve the service instance.

The Problem

The issue arises when a recursive package load is required.

So, for example, if Package A is currently loading and it calls GetService to get a service it itself provides. This creates a loop in the package load request chain as A is loading and has entered a code path, that to complete, must wait for A to finish loading.

Another example would be if Package A is currently loading and calls GetService on a service that comes from Package B. If Package B, during its load, calls GetService on a service that comes from package A we again have a loop in the package load request chain.

These loops can be arbitrarily long (i.e. Package A triggers Package B to load, which triggers package C to load, which triggers package D to load …. which triggers Package A to load).

If a service being requested during a package load from a package that is currently loading then:

  • If the package has registered the service factory before the request is made, the service manager invokes the factory and returns the service—this is the ideal path.
  • If the package has not registered the service factory before the request is made, a problem occurs. When the service manager checks if the package is loaded, it detects the package is still loading (not fully loaded). If it blocks waiting for the package to finish loading, a deadlock occurs, as the package load waits for the service return, but that requires the package load to complete. If it ignores the loading state, it returns null, since the service factory hasn’t been registered yet.

To make this work, the original design marked a package as “loaded” right before its Initialize/SetSite was called.

This was a reasonable compromise in the context of the time, as all package loads were synchronous and occurred on the UI thread, eliminating concerns about concurrent load requests. It also allowed cycles to “work” if the service-providing package registered all its services before attempting to retrieve any services that could lead to a cycle.

So Why the Change?

The term “work” was used in quotes because, while it sometimes worked, it was unreliable. For it to work, all packages had to register their service factories before making requests that could introduce a cycle. This was unenforceable, error-prone, and led to issues where internal packages would re-query for services if the initial request returned null. It was also susceptible to failure from minor changes, like refactoring initialization code or altering the load order of packages, which could invert the request chain and break the cycle (or introduce another).

Additionally, this approach only worked in a single-threaded loading model, which Visual Studio no longer uses.

In a multi-threaded loading model, the likelihood of race conditions increases. If a package is marked as loaded before its SetSite/Initialize method is called, a request from another thread may consider the package already loaded and attempt to retrieve the service, racing with the original package’s service factory registration.

To prevent null services from being returned due to this race condition, we must ensure that all loads, except the original request, block until the package initialization completes (until Initialize(Async)/SetSite returns). However, blocking on in-progress loads should only occur if the calling thread is independent of the original thread that initiated the load; otherwise, it could deadlock the entire process.

The Fix

To solve this problem, we rely on AsyncLazy to manage package loads. AsyncLazy uses AsyncLocal to detect re-entrant invocations. It can determine, from the context of any thread, if the caller is related to the original thread that invoked AsyncLazy’s value factory. If so, it throws an exception; if not, it blocks the caller until the original invocation completes.

This behavior is exactly what we need, but it means cyclic load requests will now throw an exception, causing a failure. While this is unavoidable (and actually desirable), it represents a change in behavior. This approach ensures a package isn’t considered loaded until its Initialize(Async)/SetSite completes, eliminating the registration race condition, and properly handles concurrent load requests—blocking if unrelated to the original load, or failing otherwise.

Call to Action

This change is necessary to prevent a race condition, which arises from how Visual Studio services are discovered.

Ways to avoid cycles

Since cycles are no longer allowed, it’s important to avoid creating them. The good news is that changes made to address these issues will also work in older versions, as cycles were never a good idea. While race conditions still exist in older versions, these cannot be avoided without applying this fix more broadly, which would impact a larger user base.

The most common mistake we observed was developers being too eager in Initialize(Async)/SetSite, often leading to cycles. Specifically, people would:

  1. Eagerly create service instances, which often required fetching other services.
  2. Eagerly create tool windows, which also required fetching services.
  3. Eagerly fetch services to store in backing fields, even if they weren’t used in Initialize(Async)/SetSite.

Your Initialize(Async)/SetSite should do minimal work. You won’t know why your package was loaded, but if it was to retrieve a service or load a tool window, those actions will occur by a follow-up call after Initialize(Async)/SetSite completes.

To avoid cycles, services can be retrieved “just in time” using Lazy<T> or AsyncLazy<T> outside of Initialize(Async)/SetSite. Similarly, while service factories should be registered eagerly, the actual service creation (which can involve fetching other services) happens only after the package is fully loaded, eliminating the cycle risk.

Tool windows should also be created outside Initialize(Async)/SetSite, and any required services can be fetched at that point. An example of this pattern can be seen here: Upgrading to Visual Studio 2022 17.12.1 displays error Exception from HRESULT: 0x80049283 – Developer Community In this case the extension is eagerly creating its toolwindow inside its InitializeAsync, this is unnecessary. A separate call will be made by the environment when your toolwindow is needed.

Customer Value

This change was made to reduce instances of services returning null when they should never do so. Such failures are problematic because if the caller doesn’t null-check the result, it could crash Visual Studio. If they do check for null, they must handle the missing service appropriately. Most users opted to disable functionality that depended on the missing service, leading to inconsistent behavior—where Visual Studio sometimes appeared to lack features that worked in previous sessions, even though the code hadn’t changed.

For extenders, this change adds some extra work, but it also eliminates the uncertainty around services occasionally returning null. They can now consistently treat null as either a fatal error or an indication that a feature is unavailable, rather than a strange, self-correcting issue that might resolve with a retry.

Conclusion + Thanks

We understand that changes to “working” code are generally undesirable. Initially, we didn’t expect many people to be affected, but after issues were reported by two internal teams and one external team, we realized a fix we anticipated would be non-disruptive was, in fact, impacting extenders.

This post was directly motivated by user feedback, which alerted us to the issue, rather than users silently adjusting their code without fully understanding the cause, for that we are grateful.

We appreciate the time you’ve spent reporting issues/suggestions and hope you continue to give us feedback when using Visual Studio on what you like and what we can improve. Your feedback is critical to help us make Visual Studio the best tool it can be! You can share feedback with us via Developer Community: report any bugs or issues via report a problem and share your suggestions for new features or improvements to existing ones.

Stay connected with the Visual Studio team by following us on YouTube, Twitter, LinkedIn, Twitch and on Microsoft Learn.

The post New restrictions on package loading appeared first on Visual Studio Blog.

VisualStudio.Extensibility: Tagger support and updates to settings

$
0
0

We continue to invest in the VisualStudio.Extensibility SDK to allow users like you to create extensions that run faster and smoother than ever before! VisualStudio.Extensibility helps you build extensions that run outside the main Visual Studio IDE process for improved performance, reliability, and installation without restarting Visual Studio. Additional benefits include a sleek and intuitive .NET 8-based API and comprehensive, well-maintained documentation to help you develop amazing extensions faster than ever before.

For the latest up-to-date docs and installation instructions, visit https://aka.ms/VisualStudio.Extensibility. We encourage you to report bugs and suggest features via the issue tracker on our GitHub repo, where you can also find extension samples to help you get started.

What’s new for VisualStudio.Extensibility in 17.13?

Our 17.13 release of VisualStudio.Extensibility includes the following features:

  • Enhanced editor extensibility through tagger support
  • Expanded settings API to allow for observation of changed settings values

Both sets of APIs are marked as experimental, which means that they are subject to change as we iterate on the design based on customer feedback. A core principle of VisualStudio.Extensibility is to provide intuitive APIs. As hard as we work to shape the API to be intuitive from inception, we understand that there are likely gaps we’re missing or assumptions we’re making that could be addressed over time. We therefore mark new APIs as experimental to allow customers to report such gaps so we can address them. To read more about our experimental API and breaking changes policy, please see here.

Taggers – the foundation of custom text decoration

A powerful editor is foundational to a developer’s daily workflow, providing the essential tools and features needed to write, debug, and maintain code efficiently. In Visual Studio, text decorators are one of the key differentiators that enhance this experience. These decorators, such as text colorization and CodeLens, offer contextual information to help developers understand and navigate their code more effectively. At the heart of these decorative features is the concept of taggers. Taggers are the mechanism to mark the text in the editor with hidden information, enabling the editor to adopt various text decorations later.

For example, to provide a custom CodeLens, first we need to define where the CodeLens should show up. Is it CodeLens for a method or a class? Different languages have different syntax for how methods are defined, and some languages may not have classes at all. To know where the blocks of code that make sense for your custom CodeLens to show up, we first need to “tag” the text in the editor with additional information. In 17.12, we talked about how CodeLens can only be created for languages supported by default in Visual Studio, like .NET or C++. This is because the text is already tagged by our own language services to contain the metadata needed for CodeLens. In 17.13, we are providing the API to provide your own tags, so that you can add CodeLens to languages not supported by Visual Studio. The following example shows a snippet of how to define CodeLens tags for a markdown file.


[VisualStudioContribution]
internal class MarkdownCodeLensTaggerProvider : ExtensionPart, ITextViewTaggerProvider<CodeLensTag>, ITextViewChangedListener
{
    private readonly object lockObject = new();
    private readonly Dictionary<Uri, List<MarkdownCodeLensTagger>> taggers = new();

    public TextViewExtensionConfiguration TextViewExtensionConfiguration => new()
    {
        AppliesTo = [DocumentFilter.FromDocumentType("vs-markdown")],
    };

    public Task<TextViewTagger<CodeLensTag>> CreateTaggerAsync(ITextViewSnapshot textView, CancellationToken cancellationToken)
    {
        var tagger = new MarkdownCodeLensTagger(this, textView.Document.Uri);
        lock (this.lockObject)
        {
            if (!this.taggers.TryGetValue(textView.Document.Uri, out var taggers))
            {
                taggers = new();
                this.taggers[textView.Document.Uri] = taggers;
            }

            taggers.Add(tagger);
        }

        return Task.FromResult<TextViewTagger<CodeLensTag>>(tagger);
    }
}

Of course, there’s a lot more that goes into creating taggers for markdown files, so to view the whole code sample, please see here, or you can refer to our documentation for more details. Try it out and customize the CodeLens experience in your extension even more!

Observing changes to settings values

Another addition we introduced in 17.13 is an enhancement to our settings API which allows extenders to get notified of changes to their settings values. Extenders can now generate settings observers to monitor changes and read their settings value snapshot.


public MyToolWindow(MyCategoryObserver settingsObserver)
{
    settingsObserver.Changed += this.SettingsObserver_ChangedAsync;
}

private async Task SettingsObserver_ChangedAsync(MyCategorySnapshot settingsSnapshot)
{
    this.MySetting = settingsSnapshot.MySetting.ValueOrDefault(defaultValue: true);
    ...
}

Please read our documentation for more detailed information and walk through our sample code for full context.

We want to hear from you!

The time and effort you’ve spent reporting issues and sharing suggestions so far has been instrumental in shaping VisualStudio.Extensibility. We need your help as we continue to develop VisualStudio.Extensibility! Please try out the features and APIs announced and let us know what you think. Check out the docs, browse the code samples, and build your first extension. You can send feedback and report issues through our issue tracker.

To request features, look at Developer Community to see if someone else made a similar request first. Create a new one if you can’t find a similar request. By checking for similar requests and upvoting and commenting on them, you help us better prioritize requests. Give VisualStudio.Extensibility a try today and share your thoughts with us!

We appreciate the time you’ve spent reporting issues/suggestions and hope you continue to give us feedback when using Visual Studio on what you like and what we can improve. Your feedback is critical to help us make Visual Studio the best tool it can be! You can share feedback with us via Developer Community: report any bugs or issues via report a problem and share your suggestions for new features or improvements to existing ones.

Stay connected with the Visual Studio team by following us on YouTube, Twitter, LinkedIn, Twitch and on Microsoft Learn.

The post VisualStudio.Extensibility: Tagger support and updates to settings appeared first on Visual Studio Blog.

Introducing Code Referencing for GitHub Copilot Completions in Visual Studio

$
0
0

When GitHub Copilot completions (or “gray text”) pop up on your screen, have you ever wondered where does the completions come from and worried about if it matches with public code leading to license issues? If you have, we are introducing code referencing to support you and provide more transparency!

We are excited to announce that code referencing is available now for GitHub Copilot Completions in Visual Studio 2022 17.13, a feature previously introduced in Copilot Chat (see previous blog post). So you can feel more confident when accepting the completions!

Learn about Completions Public Code Match

When you accept a completion that matches code in a public GitHub repository for the first time in your solution, a toast notification will appear on the bottom right of your editor.

A toast notification that pops up on the bottom right corner of Visual Studio with the title: Found similar code in public repos. Body text include: Copilot completion code matches will appear in the Copilot output window pane. There are two buttons in the toast: on the left, View code matches and on the right, More info.

From the toast, you can view code matches in the GitHub Copilot Output Window, where includes more detailed information about the license type and a link to GitHub.com, where the original public code file lives. You can click on the link to read more about the original file and make informed decisions, such as including code attribution or removing the code from your project.

The Visual Studio Output Window, showing output from GitHub Copilot. One output message is highlighted with a red rectangular box. The highlighted output message is [Completions Public Code Match Information] Similar code with license type [MIT], followed by a link to github.

From the toast, you can also learn more information about public code match and how to manage it as an individual subscriber here: Managing Copilot policies as an individual subscriber.

In your future coding workflow, you can always check for any public code match by opening the Output Window (Ctrl+Alt+O) and searching for “Completions Public Code Match Information.”

Note:

  • Code referencing for completions only occurs for accepted Copilot completions. Any code you have written, as well as completions you have modified or dismissed, are not checked for public code matches.
  • Typically, matches to public code occur in less than one percent of Copilot completions, so you should not expect to see code references for many completions. This estimation is higher if you work in open-source repositories.

Configure Code Referencing

Note: If you are a member of an organization on GitHub Enterprise Cloud and have been assigned a GitHub Copilot seat through your organization, you may not be able to configure suggestions matching public code in your personal account settings. Your settings will be inherited from your organization or enterprise.

If you are an individual subscriber, your personal settings for GitHub Copilot include an option to either allow or block code suggestions that match publicly available code:

  • Block suggestions matching public code: GitHub Copilot checks code suggestions with their surrounding code against public code on GitHub. If there’s a match or near match, the suggestion is not shown.
  • Allow suggestions matching public code: When Copilot suggests matching code, you can view details of the matches and navigate to the relevant repositories on GitHub.

To adjust your settings:

  1. In the upper-right corner of any page on GitHub, click your profile photo, then click Your Copilot.
  2. Next to Suggestions matching public code, use the dropdown menu to select Allow or Block.

For more information, see Managing Copilot policies as an individual subscriber.

Code with More Confidence and Transparency

This new functionality offers developers greater transparency on their code completions (or “gray text”) by providing detailed information on any public code matches found. Prior to this change, Copilot completions with public code match were automatically blocked. Now, developers have the choice to access more code completions and receive sufficient information about any public code matches, enabling them to make informed decisions.

Try It Out Today

We believe this new code referencing feature in Copilot Completions improves your development experience with more transparency and informed choices. Give it a try in Visual Studio 17.13 or later, and share your feedback with us.

We appreciate the time you’ve spent reporting issues/suggestions and hope you continue to give us feedback when using Visual Studio on what you like and what we can improve. Your feedback is critical to help us make Visual Studio the best tool it can be! You can share feedback with us via Developer Community: report any bugs or issues via report a problem and share your suggestions for new features or improvements to existing ones.

Stay connected with the Visual Studio team by following us on YouTube, Twitter, LinkedIn, Twitch and on Microsoft Learn.

The post Introducing Code Referencing for GitHub Copilot Completions in Visual Studio appeared first on Visual Studio Blog.

Unlocking More Power: Tool Calling in GitHub Copilot for Visual Studio

$
0
0

Have you ever been frustrated when Copilot doesn’t understand you? While it can’t read your mind, we’ve been working hard to make your coding experience smoother.

Previously, Copilot in Visual Studio could look at files in your repository, but you needed to specify the context of your code manually. We understand this wasn’t the most intuitive experience, so we’ve been working on a smarter way to infer information automatically.

Introducing Tool Calling: A Smarter Copilot

Tool Calling is here—a major update that changes how you interact with Copilot. Now, Copilot can automatically search for more relevant code or tools it needs to address your questions. This works with GPT-4o and Claude Sonnet.

You can now simply describe what you need in natural language, and Copilot can decide what of the information below is relevant:

  • Your current file
  • Open files or related files in your solution
  • Your whole codebase
  • debugger (locals, call stacks, etc.)
  • or Visual Studio itself

Web integration is also coming soon, allowing you to ask questions that span both local code and external data sources. (But for now you can use @GitHub.)

And that’s not all we added….

Smarter Knowledge Retrieval

Even more transparency and control

While Tool Calling is a significant improvement, it’s not perfect. To tweak any missteps, try the Retry button to generate a fresh response. You can also manually specify files, methods, classes, or entire solutions using # references in your prompts.

Help Shape the Future

Tool Calling enables both enhanced context retrieval and greater workflow automation. Please update to the latest version of Visual Studio to access upcoming features. We also invite you to try Chat again and share your feedback—let us know what works, what doesn’t, and how we can improve your experience.

Happy coding!

Want to try this out?

Activate GitHub Copilot Free and unlock this AI feature, plus many more.

No trials. No credit cards. Just your GitHub account. Get Copilot Free

The post Unlocking More Power: Tool Calling in GitHub Copilot for Visual Studio appeared first on Visual Studio Blog.


Leverage vision in Copilot Chat

$
0
0

Now, in the preview channel, you can attach images in GitHub Copilot chat to help you illustrate your ideas effectively and get the best responses. 

Upload image to copilot prompt box

Imagine working on a UI development task where describing a design or layout through text just doesn’t cut it. Or perhaps you’re debugging an issue and need to share a screenshot of an error state or message. Starting in 17.13 Preview channels, you can now paste an image from your clipboard or use the paperclip icon in the chat window to upload your image directly from your file explorer. Simply add your prompt text and send! Copilot will analyze the image and use it as additional context to generate a better response. 

Vision attachment breakout game example

In this simple example, Copilot was able to interpret the attached image context as a colorful breakout game. Combining that request with the open file and the loaded project, Copilot can create a plan and suggest code to scaffold an entire working project from scratch. When combined with the iteration power of Copilot edits, even more is possible with existing code bases. Check out this clip of the Microsoft Ignite session that previewed this functionality to see it in action. 

More details 

PNG, JPG, and GIF image attachments are only supported in the preview release on GPT-4o, though the model will only take a single frame of an animated GIF. Additionally, you can attach up to three images per message, providing ample space to convey your ideas visually.  

Building with your feedback 

This capability to attach images in GitHub Copilot chat helps bring the latest in LLM improvements to work for you in Visual Studio. To continue to improve these experiences, please share your feedback on this survey.

As we continuously strive to improve Visual Studio, and your feedback is invaluable! We appreciate your ongoing support and are excited to bring you this new feature to enhance your coding experience. 

The post Leverage vision in Copilot Chat appeared first on Visual Studio Blog.

Claude 3.7 Now Available in GitHub Copilot for Visual Studio

$
0
0

The world of AI is evolving at a breathtaking pace, and today brings an exciting milestone for developers and tech enthusiasts alike. Anthropic’s newest release, Claude 3.7, is now available directly within GitHub Copilot for Visual Studio 2022 17.13, heralding a new era of seamlessly integrated, advanced AI coding assistance. This new Sonnet model supports the non-thinking modes in Copilot.

Image image

How to Access Claude 3.7

Getting started is easy:

  • Open the Chat Window: Click the Copilot badge at the top right of your Visual Studio interface.
  • Launch Copilot Edit: Open the chat window to initiate an editing session.
  • Select Your Model: In the prompt box, open the model picker. By default, ChatGPT 4 is selected, but you can easily switch to Claude 3.7 Sonnet to harness its advanced features.

If you don’t see Claude 3.7 as an option, there could be two reasons:

  1. It’s not available for Copilot Free users. Only paid Copilot users have access to this model.
  2. You need to enable the policy for 3.7 Sonnet in your GitHub profile. Make sure to enable Claude access in your setting.

Learn More

For further details, check out the Using Claude Sonnet in Copilot Chat – GitHub Docs. 

We’re super excited about this enhancement to our development environment and can’t wait to hear your feedback. Let us know what you think!

The post Claude 3.7 Now Available in GitHub Copilot for Visual Studio appeared first on Visual Studio Blog.

Catch issues before you commit to Git

$
0
0

Discovering issues with code changes after committing changes can be frustrating. Fortunately, Visual Studio offers a new feature that helps you catch potential problems early, improving your code quality.

copilot giving a suggestion on new code on how to improve it

Visual Studio now includes a feature powered by GitHub Copilot that lets you review your local code changes before committing them, before they are part of your pull request. This can help identify performance and security issues early, ensuring you maintain a higher quality codebase.

How to Get Started

To use this feature, ensure your GitHub Copilot subscription is active and enabled within Visual Studio. If you don’t already have GitHub Copilot, you can sign up for free here.

You’ll need to enable the necessary feature flags:

  • Tools > Options > Preview Features > Pull Request Comments
  • Tools > Options > GitHub > Copilot > Source Control Integration > Enable Git preview features.

Then, you’ll see a new sparkle comment button in the Git Changes window. Clicking this button allows GitHub Copilot to review your local code changes and provide inline suggestions.

Copilot reviews changes and suggests commit improvements

As always with AI powered features, you’ll want to review Copilot’s suggestions for accuracy, which you can do directly in your working file. You can navigate between comments or collapse them using the up arrow icon in the top right corner of the comment box. Please share your scenarios with us in the survey to help us make the comments as useful as possible.

Share your feedback

We rely on your user feedback to guide our roadmaps in Visual Studio. Please share your thoughts on this feature in this survey. Also, we’re already tracking a suggestion to improve this feature with customization, so share your thoughts here.

We value your continued support and insights to make your experiences in Visual Studio the best they can be, especially now with AI!

The post Catch issues before you commit to Git appeared first on Visual Studio Blog.

Great new productivity features in Visual Studio

$
0
0

Sometimes it’s the little things in life that matter the most. In the latest version of Visual Studio, we’ve added some features and tweaks that aim to put a smile on your face and make you more productive. Here is a list of some of these, and if you want the full list, make sure to check out the release notes.

Customize file encoding

Developers working in cross-platform environments often need files to be saved with specific file encodings. Changing these encodings can lead to various issues.

Visual Studio now allows you to set the default file encoding for saving files. This feature ensures that your preferred encoding is used whenever possible.

To set the default encoding, navigate to Tools → Options → Environment → Documents. There, you will find an option titled Save files with a specific encoding. If this option is unchecked, Visual Studio will manage file encoding using its default behavior. If checked, Visual Studio will use the encoding specified in the adjacent combo box whenever a file is saved.

Image showing save file option with the following option Western European (Windows) - Code page 1252

If Visual Studio cannot save with the specified encoding (e.g., requesting ASCII encoding for a file containing Unicode characters), it will display a dialog informing you of the issue.

Choose whether to indent word wrap

We are excited to introduce a new feature that allows you to control whether wrapped lines are indented in the editor. This enhancement provides greater flexibility and customization for your coding environment, ensuring that your code appears exactly as you prefer.

code with word wrapped enabled

To change this option, follow these steps:

  1. Go to Tools → Options → Text Editor → General.
  2. Look for the option called Automatically indent when word wrap is enabled.

By default, this option is enabled, meaning that wrapped lines will be indented. If you prefer your wrapped lines not to be indented, simply uncheck this option. This setting can help improve readability and maintain the desired formatting of your code, especially in projects where indentation style is crucial.

Preserve font preferences across themes

We understand that the fonts developers select when coding is a personal choice, influenced by preferences for readability, accessibility, or aesthetics. Visual Studio themes primarily focus on presentation colors and are independent of your preferred fonts.

With this update, we’ve introduced functionality to retain your font face and size choices when switching themes. You can now set your font preferences once and switch themes in Visual Studio without needing to reconfigure your font settings every time. Note that the colors of your fonts remain linked to the theme, as that is the purpose of themes, but your font selections will be preserved.

2 themes that have that stay the same

This feature will be enabled by default for all users. If you prefer the previous behavior, go to Tools > Manage Preview Features and find the option Separate font settings from color theme selection. If this option is checked, your font preferences will be maintained regardless of theme changes. Uncheck the box to reinstate the previous behavior which ties font choices to theme.

Reimagine the horizontal scrollbar

The editor tray in Visual Studio is a valuable space for a wealth of information. You can control your zoom, check the health of your document, see what line you’re on, and access a variety of additional information.

Unfortunately, sometimes all of that information can crowd out the horizontal scrollbar, making it difficult to scroll through your window. This is particularly true in a side-by-side view where the system tray isn’t very wide.

With this latest update, these struggles are a thing of the past. If the scrollbar drops below a usable width, it will reposition itself above the system tray to ensure it’s always accessible. By default, it will return to the editor tray as soon as there’s enough room for it again.

Highlighting the horizontal bar

While we believe this behavior will be ideal for most users, if you encounter any issues, you can control the behavior in Tools → Options. The option is located under Text Editor → Advanced and is labeled Editor horizontal scrollbar location. This setting allows you to choose whether the scrollbar adjusts its position according to the available space, stays in the editor tray, or always appears above the editor tray.

Options to change horizontal bar behavior

Thank you!

We are dedicated to continuously improving your development experience, and many of these advancements are driven by your invaluable feedback and suggestions. Your input plays a vital role in shaping the future of Visual Studio, and we encourage you to keep sharing your ideas with us.

Happy coding!

The post Great new productivity features in Visual Studio appeared first on Visual Studio Blog.

New Debugging and Profiling Features in Visual Studio (v17.13)

$
0
0

The latest Visual Studio update (v17.13) brings a strong set of debugging and profiling features designed to speed up troubleshooting, making it more efficient. With AI-driven features in this release, variable analysis and data inspection are smarter and more intuitive, and problems are easier to identify and debug. Profiling tool improvements also deliver better support and visualization for multi-process execution, native code, and async workflows, with clearer insights into performance bottlenecks. For a full list of debugger and diagnostics features in this release, check out the release notes.

GitHub Copilot Assited Debugging Features

Smarter exception and variable analysis

GitHub Copilot Exception Analysis and Variable Analysis now use your project context intelligently to find and bring to your attention the most relevant code to errors.

With sharper, actionable insights and smarter, context-aware solutions, these capabilities can guide you to the root cause of issues more quickly, make your debugging workflow more streamlined, and provide greater overall accuracy in debugging errors.

GitHub Copilot explaining an error

AI-Powered Parallel Stacks window

Auto-Summarize in Parallel Stacks gives you AI-generated summaries so you can get a quick idea of what each thread is doing. Copilot Chat Integration with App Summarization goes a step further, identifying probable problems, recommending solutions, and enabling you to ask questions, get them explained, and get AI-powered suggestions—all in the context of your debugging session.

Combined, these tools simplify parallel debugging so you can diagnose and repair threading problems more quickly and confidently.

Copilot Chat Integration In Parallel Stack Deadlock example

Enhanced Editable Expressions in IEnumerable Visualizer

The IEnumerable Visualizer now features GitHub Copilot Inline Chat, allowing you to refine editable expressions using natural language. Open a prompt with the Copilot sparkle button, tell it what you would like to change, and receive AI-generated LINQ queries for customized filtering your data. Including syntax highlighting to make it easier to read.

IEnumerable expression Visualizer

Profiling Features

Targeted Instrumentation for native code

The Instrumentation tool in the Visual Studio now has targeted instrumentation for native code, allowing you to choose functions and classes to inspect thoroughly.

This improves performance monitoring and makes it easier for you to spot issues, streamlining your debugging experience.

List of instruments you can easily select and view

Display unified async stacks in profiler

The Visual Studio profiler now improves debugging of .NET applications by showing stitched async stacks in the summary and detail call tree windows.

This feature gives a more cohesive, clearer picture of asynchronous operations, making it easier for developers to follow the entire execution path, including asynchronous method calls, in a single, unified stack trace.

Detailed tree view of call stacks

Multiprocess Analysis with Color-Coded Swimlanes in CPU Usage

CPU Usage tool in the Visual Studio profiler now supports multiprocess analysis, with performance graphs displayed as separate color coding for each process in swim lanes.

The graphs are displayed as stacked area charts. You can also filter processes by a dropdown at the top left, to enable focused analysis.

This enhancement enables you to profile and isolate CPU usage by process with ease in one session. Providing better visualization of resource usage, it optimizes profiling performance and simplifies multiprocess application performance tuning.

graph of CPU usage

Thank you!

We aim to make your debugging and profiling experience as smooth and productive as it can be. We really appreciate the feedback and suggestions you provide, as that is what determines the direction of the tools you use daily. Never stop providing us with feedback, as we can keep making Visual Studio an excellent and user-friendly tool for developers like you.

Happy coding!

The post New Debugging and Profiling Features in Visual Studio (v17.13) appeared first on Visual Studio Blog.

Viewing all 1144 articles
Browse latest View live


<script src="https://jsc.adskeeper.com/r/s/rssing.com.1596347.js" async> </script>