Quantcast
Channel: Visual Studio Blog
Viewing all 1144 articles
Browse latest View live

Roadmap for AI in Visual Studio (February)

$
0
0

After a busy January (catch up here), we’re shifting focus to reliability and refinement. This month is about tightening core workflows, improving agent stability, and building on the MCP foundations we’ve been laying.

These are active areas of work, not delivery commitments. Upvote the features that matter most to you.

Agent Mode & Coding Agents

Reliability is the priority this month. We’re raising the floor on agent-driven scenarios with:

Planning Agent

First steps toward a dedicated agent for multi-step task planning and execution.

Copilot SDK & Platform Integration (Experimental)

We’re also beginning early work to better integrate the Copilot CLI into Visual Studio Copilot.

Model Context Protocol (MCP)

MCP keeps external tools and services connected to VS in a governed, scalable way. February focus:

Models & Context Management

Under-the-hood work to keep Copilot fast as context grows:

Copilot experience in Editor

Smoother Copilot integration with existing editor behavior:

We’re excited for you to try these improvements as they roll out. As always, feedback is incredibly important—please upvote or comment on the linked Developer Community items so we know what matters most to you.

Thanks for continuing to build with us.

The post Roadmap for AI in Visual Studio (February) appeared first on Visual Studio Blog.


Unlock language-specific rich symbol context using new find_symbol tool

$
0
0

Refactoring at scale is a time-consuming and error-prone process for developers. In large codebases, developers have relied on manual searches and incremental edits across multiple files to accomplish these tasks.

Modern development workflows depend on fast and accurate code navigation to avoid these pitfalls. When developers refactor existing code, explore unfamiliar areas of a large codebase, or make targeted changes, they naturally rely on IDE language service features such as Find All References, Go to Definition, and Go to Implementation to understand how code is structured and connected.

Agent mode now has access to these same language-aware capabilities through the new find_symbol tool. This goes beyond traditional text or file search traditionally available in agent mode by enabling symbol-level reasoning powered by enterprise-grade language services.

Find symbol tool selected in VS Copilot Chat

What is find_symbol?

Find_symbol exposes rich, language-specific symbol information to Copilot Agent Mode, allowing the agent to reason about symbols (including functions, classes, interfaces, and variables).

Specifically, this tool allows Copilot agent mode to:

  • View all references of a given symbol across the entire codebase
  • Understand symbol metadata such as type, declaration, implementation, and scope

The find_symbol tool is available today in the latest Visual Studio 2026 Insiders version 18.4. Supported languages include: C++, C#, Razor, TypeScript, and any other language for which you have a supported Language Server Protocol (LSP) extension installed.

For best results, write clear prompts and use AI models that support tool-calling. Learn more at AI model comparison – GitHub Docs

Example scenarios

All examples below were showcased using bullet3, an open-source C++ physics simulation engine.

Adding additional functionality to existing code

As applications evolve, you often need to enhance existing functions without breaking current behavior. This can include adding logging or performance metrics.

These tools help the agent quickly identify all relevant references, ensuring complete and accurate updates for feature additions.

Find symbol references found 4 references to growtable

API Refactoring

Refactoring an API, such as hardening it, requires deep understanding of how the API is consumed across a codebase. With symbol-level insight, the agent can discover all usages, distinguish between call paths, and propose safe refactors with minimal breakage.

find symbol able to find 18 references to a hash table and reoslve accesses

Tell us what you think

We appreciate the time you’ve spent reporting issues/suggestions and hope you continue to give us feedback when using Visual Studio on what you like and what we can improve. You can share feedback with us via Developer Community: report any bugs or issues via report a problem and share your suggestions for new features or improvements to existing ones.

Stay connected with the Visual Studio team by following us on YouTube, X, LinkedInTwitch and on Microsoft Learn


The post Unlock language-specific rich symbol context using new find_symbol tool appeared first on Visual Studio Blog.

Custom Agents in Visual Studio: Built in and Build-Your-Own agents

$
0
0

Agents in Visual Studio now go beyond a single general-purpose assistant. We’re shipping a set of curated preset agents that tap into deep IDE capabilities; debugging, profiling, testing alongside a framework for building your own custom agents tailored to how your team works.

Built in agents

Each preset agent is designed around a specific developer workflow and integrates with Visual Studio’s native tooling in ways that a generic assistant can’t.

  • Debugger – Goes beyond “read the error message.” Uses your call stacks, variable state, and diagnostic tools to walk through error diagnosis systematically across your solution.
  • Profiler – Connects to Visual Studio’s profiling infrastructure to identify bottlenecks and suggest targeted optimizations grounded in your codebase, not generic advice.
  • Test – (when solution is loaded) Generates unit tests tuned to your project’s framework and patterns, not boilerplate that your CI will reject.
  • Modernize (.NET and C++ only) -Framework and dependency upgrades with awareness of your actual project graph. Flags breaking changes, generates migration code, and follows your existing patterns.

Access them through the agent picker in the chat panel or using ‘@’ in chat.

Bring your own: custom agents (preview)

The presets cover workflows we think matter most, but your team knows your workflow better than we do. Custom agents let you build your own using the same foundation—workspace awareness, code understanding, tools accessed by your prompts, your preferred model, and your tools.

Where it gets powerful is MCP. You can connect custom agents to external knowledge sources internal documentation, design systems, APIs, and databases so the agent isn’t limited to what’s in your repo.

A few patterns we’re seeing from teams:

  • Code review that checks PRs against your actual conventions, connected via MCP to your style guide or ADR repository
  • Design system enforcement connected to your Figma files or component libraries to catch UI drift before it ships
  • Planning helps you think through a feature or task before any code is written. Gathers requirements, asks clarifying questions, and builds out a plan that you can hand off

The awesome-copilot repo has community-contributed agent configurations you can use as starting points.

Get started

Custom agents are defined as .agent.md files in your repository’s .github/agents/ folder:

your-repo/
└── .github/
    └── agents/
        └── code-reviewer.agent.md

A few things to note:

  • This is a preview feature; the format of these files may change over to support different capabilities
  • If you don’t specify a model, the agent uses whatever is selected in the model picker
  • Tool names vary across GitHub Copilot platforms- check the tools available in Visual Studio specifically to make sure your agent works as expected
  • Configurations from the awesome-copilot repo are a great starting point, but verify tool names before using them in VS

Tell us what you’re building

Share your configurations in the awesome-copilot repo or file feedback here.

The post Custom Agents in Visual Studio: Built in and Build-Your-Own agents appeared first on Visual Studio Blog.

Visual Studio February Update

$
0
0

This month’s Visual Studio update continues our focus on helping you move faster and stay in flow, with practical improvements across AI assistance, debugging, testing, and modernization. Building on the momentum from January’s editor updates, the February release brings smarter diagnostics and targeted support for real world development scenarios, from WinForms maintenance to C++ modernization.

All of the features highlighted are available in the Visual Studio 2026 Stable Channel as part of the February 2026 feature update (18.3). Please update to the latest version to try out these new features!

WinForms Expert Agent

The WinForms Expert agent provides a focused guide for handling key challenges in WinForms development. It covers several important areas: Designer vs. regular code: Understand which C# features apply to designer-generated code and business logic.

  • Modern .NET patterns: Updated for .NET 8-10, including MVVM with Community Toolkit, async/await with proper InvokeAsync overloads, Dark mode with high-DPI support, and nullable reference types.
  • Layout: Advice on using TableLayoutPanel and FlowLayoutPanel for responsive, cross-device design.
  • CodeDOM serialization: Rules for property serialization and avoiding common issues with [DefaultValue] and ShouldSerialize*() methods.
  • Exception handling: Patterns for async event handlers and robust application-level error handling.

The agent serves as an expert reviewer for your WinForms code, providing comprehensive guidance on everything from naming controls to ensuring accessibility. The WinForms Agent is automatically implemented and included in the system prompt when necessary.

Smarter Test Generation with GitHub Copilot

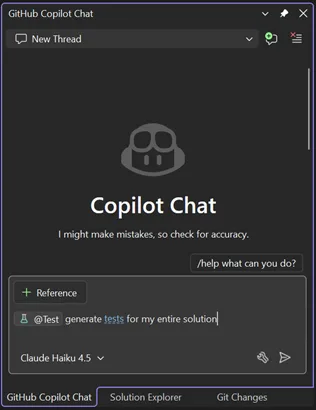
Visual Studio now includes intelligent test generation with GitHub Copilot, making it faster to create and refine unit tests for your C# code. This purpose-built workflow works seamlessly with xUnit, NUnit, and MSTest.

GitHub Copilot Chat pane in Visual Studio showing a new chat thread. The Copilot Chat welcome screen appears with a message about checking accuracy, a prompt asking ‘generate tests for my entire solution,’ and the selected model labeled Claude Haiku 4.5. The input box includes a reference button and test generation command.

Simply type @Test in GitHub Copilot Chat, describe what you want to test, and Copilot generates the test code for you. Whether you’re starting fresh or improving coverage on existing projects, this feature helps you write tests faster without leaving your workflow.

Slash Commands for Custom Prompts

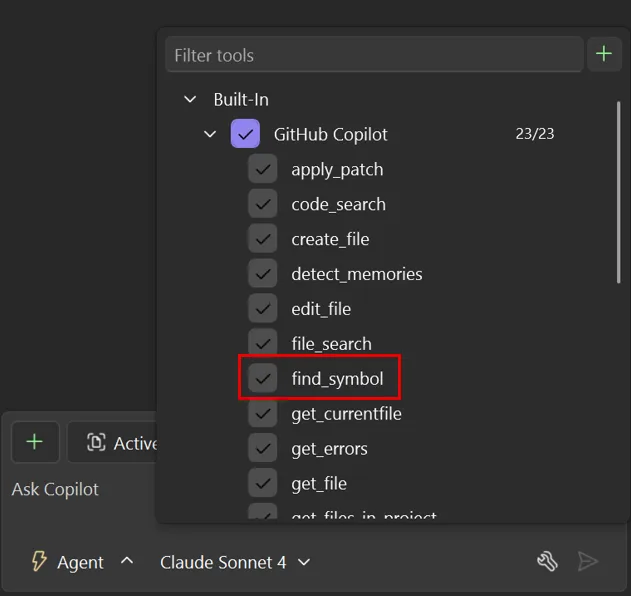
Invoke your favorite custom prompts faster using slash commands in Copilot Chat. Type / and your custom prompts appear at the top of the list, marked with a bookmark icon for easy identification.

Copilot Chat slash command menu in Visual Studio showing available commands such as quality check, clear, explain, fix, and generate, with Agent mode enabled and Claude Sonnet 4.5 selected in the chat input area.

We’ve also added two additional commands:

/generateInstructions: Automatically generate a copilot-instructions.md file for your repository using project context like coding style and preferences

/savePrompt: Extract a reusable prompt from your current chat thread and save it for later use via / commands

These shortcuts make it easier to build and reuse your workflow patterns.

C++ App Modernization

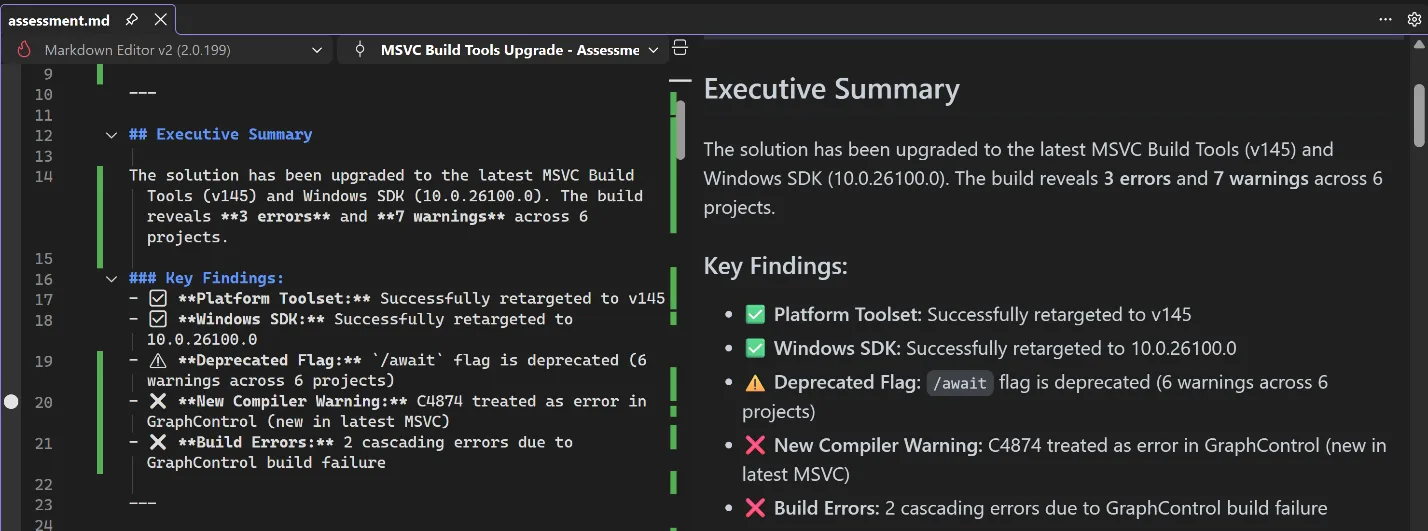
GitHub Copilot app modernization for C++ is now available in Public Preview. GitHub Copilot app modernization for C++ helps you update your C++ projects to use the latest versions of MSVC and to resolve upgrade-related issues. You can find our user documentation on Microsoft Learn.

Split view in Visual Studio showing a Markdown file on the left and a rendered preview on the right with an Executive Summary and Key Findings for an MSVC Build Tools upgrade including errors and warnings.

DataTips in IEnumerable Visualizer

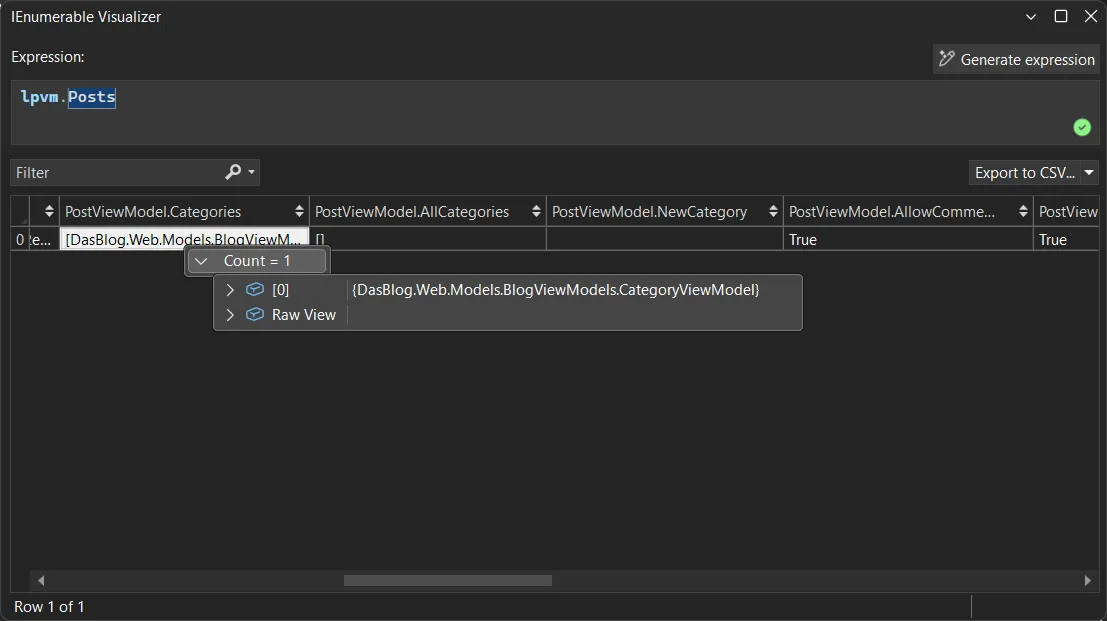
You can now use DataTips in the IEnumerable Visualizer while debugging. Just hover over any cell in the grid to see the full object behind that value, the same DataTip experience you’re used to in the editor or Watch window.

When you hover over a cell, a DataTip shows all the object’s properties in one place. This makes it much easier to debug collections with complex or nested data. Whether it’s a List<T> of objects or a dictionary with structured values, one hover lets you quickly inspect everything inside.

Visual Studio IEnumerable Visualizer showing the expression lpvm.Posts. A table displays one row with columns for PostViewModel properties, including Categories with a count of one, AllCategories, NewCategory, and AllowComments set to True. A tooltip shows a CategoryViewModel object with an option to view raw data.

Analyze Call Stack with Copilot

You can now Analyze Call Stack with Copilot to help you quickly understand what your app is doing when debugging stops. When you pause execution, you can select Analyze with Copilot in the Call Stack window. Copilot reviews the current stack and explains why the app isn’t progressing whether the thread is waiting on work, looping, or blocked by something.

This makes the call stack more than just a list of frames. It becomes a helpful guide that shows what’s happening in your app so you can move faster toward the real fix.

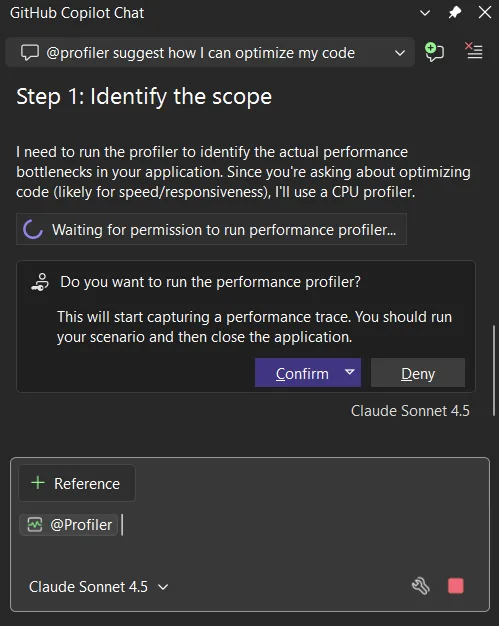
Profiler agent with Unit Test support

The Profiler Agent (@profiler) now works with unit tests. You can use your existing tests to check performance improvements, making it easier to measure and optimize your code in more situations. The agent can discovers relevant unit tests/BenchmarkDotNet benchmarks that exercise performance-critical code paths.

If no good tests or benchmarks are available, it automatically creates a small measurement setup so you can capture a baseline and compare results after changes. This unit-test-focused approach also makes the Profiler Agent useful for C++ projects, where benchmarks aren’t always practical, but unit tests often already exist.

GitHub Copilot Chat showing profiler suggestion to optimize code step identify scope message requesting permission to run CPU performance profiler with confirm and deny buttons and model selector visible

Faster and More Reliable Razor Hot Reload

Hot Reload for Razor files are now faster and more reliable. By hosting the Razor compiler inside the Roslyn process, edits to .razor files apply more quickly and avoid delays that previously slowed Blazor workflows. We also reduced the number of blocked edits, with more changes now applying without requiring a rebuild, including file renames and several previously unsupported code edits. When a rebuild is still required, Hot Reload can now automatically restart the app instead of ending the debug session, helping you stay in flow.

We are continuing to invest in features that help you understand, test, and improve existing code, not just write new code. Try these updates in the Visual Studio 2026 Stable Channel and let us know what is working well and where we can improve. Your feedback directly shapes what we build next.

The post Visual Studio February Update appeared first on Visual Studio Blog.

Viewing all 1144 articles
Browse latest View live


<script src="https://jsc.adskeeper.com/r/s/rssing.com.1596347.js" async> </script>